Security Orchestration, Automation, and Response (SOAR)
Overview:
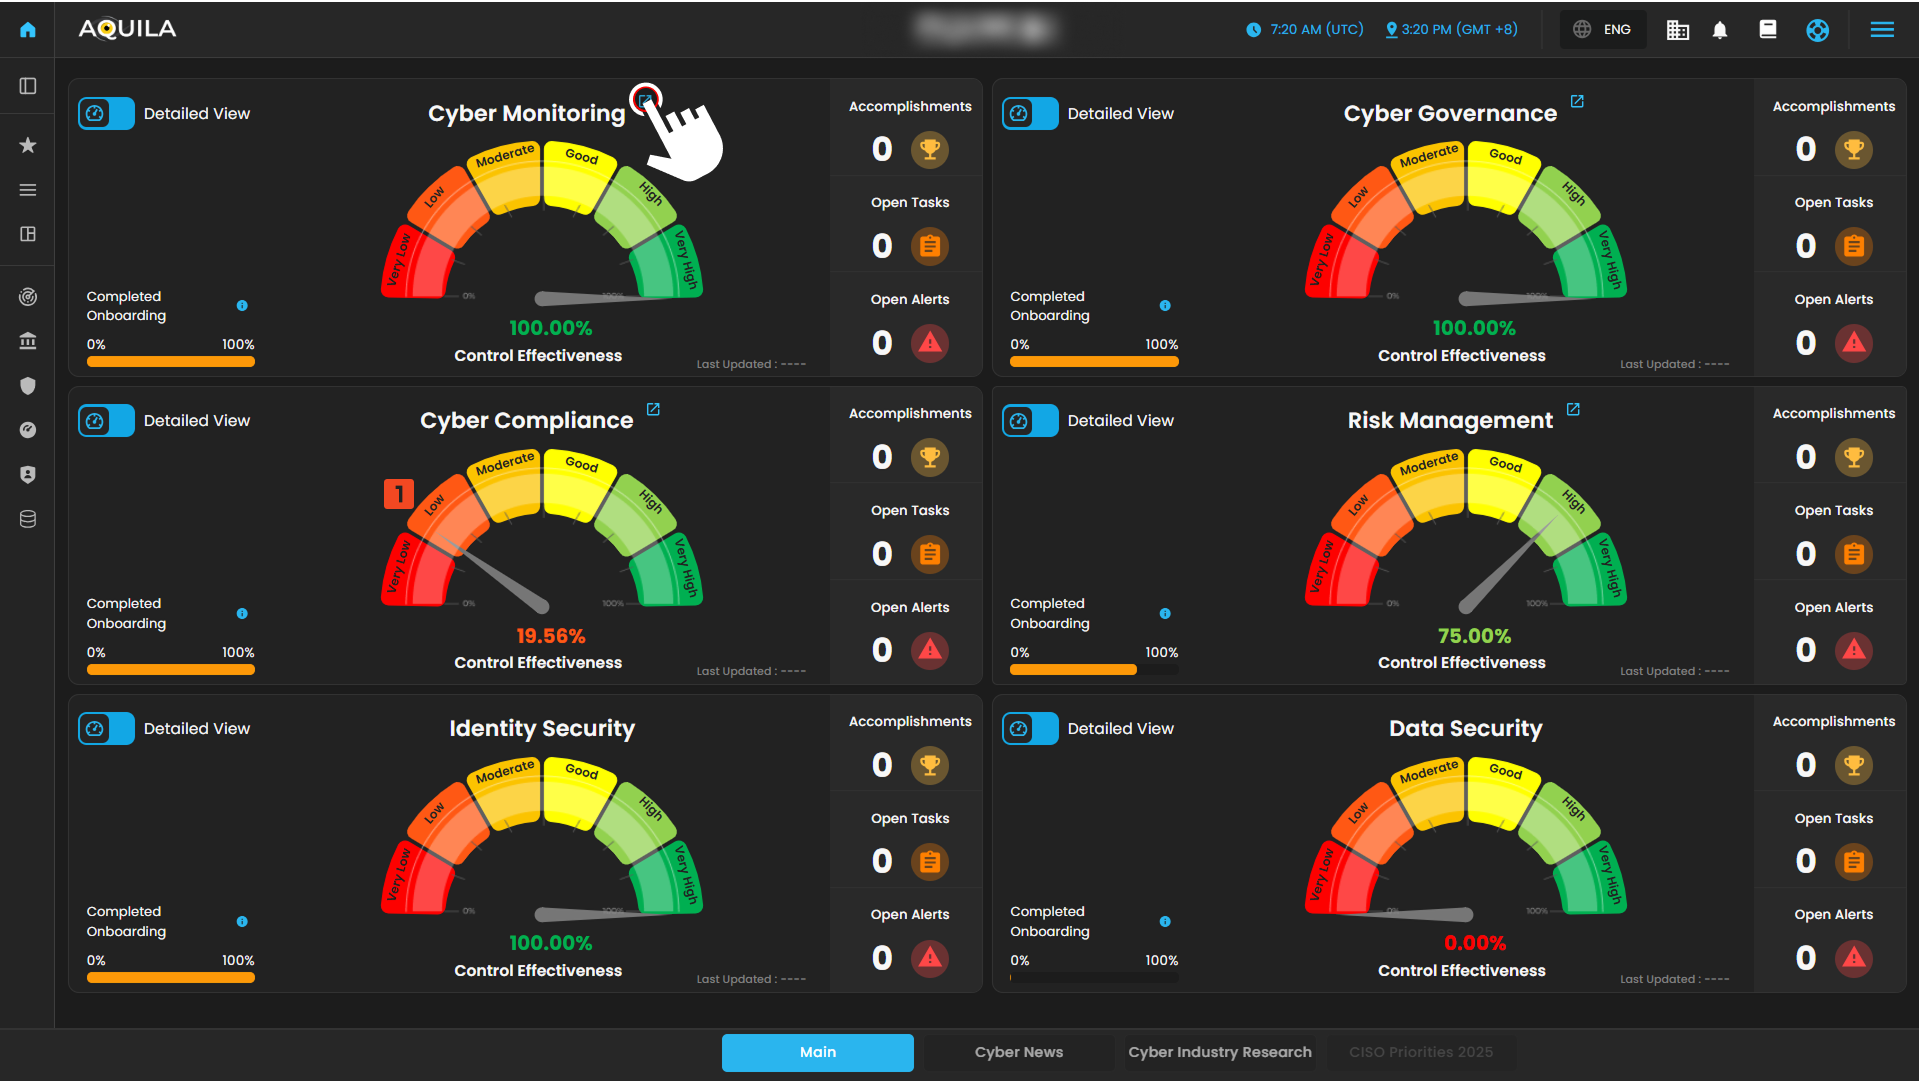
The SOAR module helps streamline and enhance security operations by automating responses to security alerts and orchestrating workflows across various tools and systems. It allows for faster incident detection, response, and resolution, ensuring your security team can effectively handle a wide range of incidents without manual intervention.
Key Features:
-
Mean Time to Detect: Displays the average time taken to detect security incidents. Monitoring this metric helps evaluate the efficiency of the system in identifying potential threats.
-
Mean Time to Respond: Tracks the average time required to respond to an incident after it has been detected. This metric ensures that your team is responding quickly to mitigate risks.
-
False Positive Rate: Measures the percentage of alerts that are determined to be false positives. Monitoring this helps reduce unnecessary responses and fine-tune detection rules.
-
Total Number of Open Alerts: Shows the current number of active alerts. This data is crucial for understanding the workload of the security team and prioritizing incident handling.
-
Alerts Resolved: Indicates the total number of alerts that have been resolved, helping track the effectiveness of your response efforts and overall security performance.
-
Incident Type by Status: Provides a breakdown of incidents by their current status (open, in-progress, pending, or closed). This helps track the progress of ongoing investigations and responses.
-
Open Alerts Table: Displays a list of open alerts with detailed information such as alert ID, timestamp, rule name, risk score, and severity. This table allows security teams to prioritize alerts and manage responses efficiently.
Pre-requisites
- Access to CyTech - AQUILA
-
Only users assigned the "Owner" or "Admin" role can access the Control Panel page within this module.
-
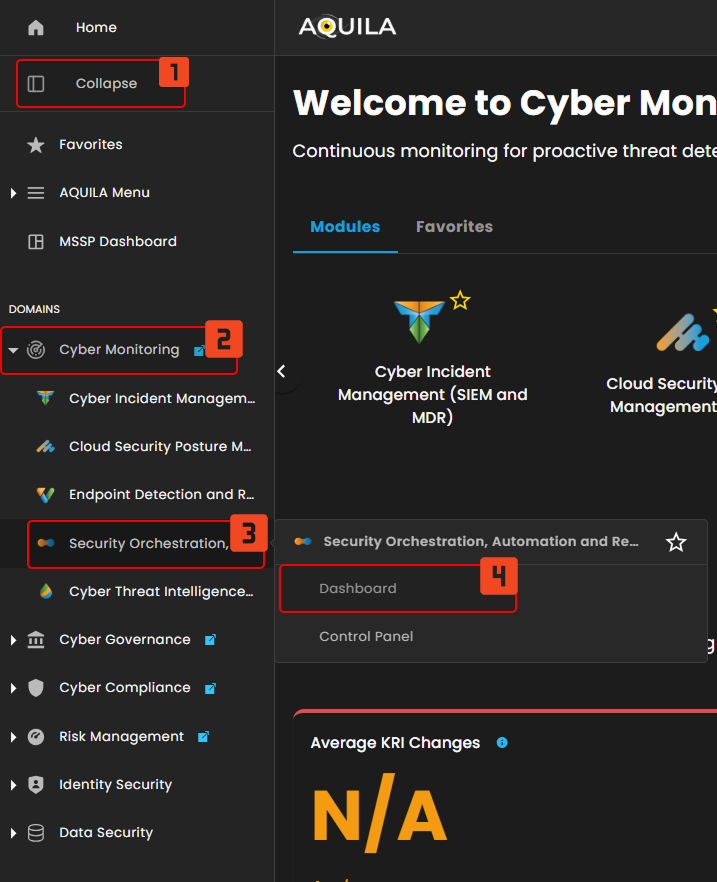
Step 3: Choose Security Orchestration, Automation and Response (SOAR).
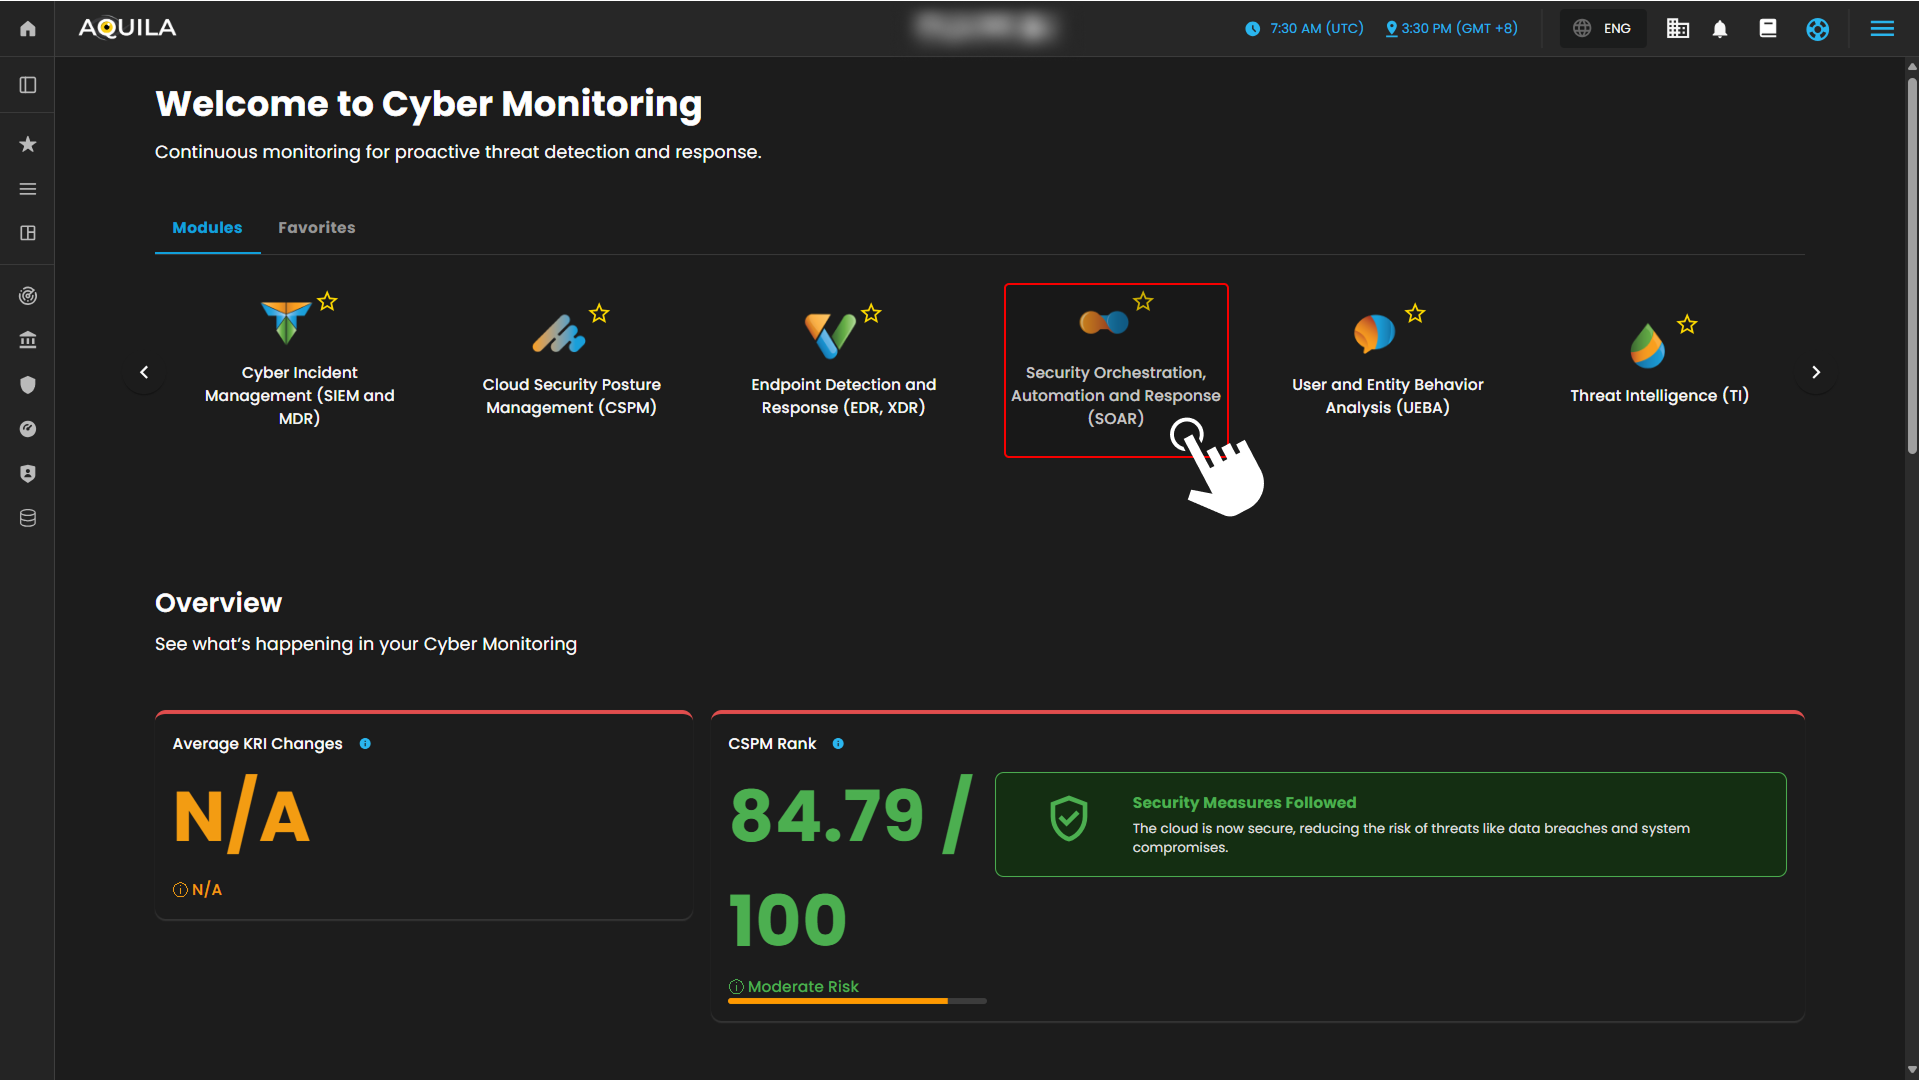
Step 4: Hover into leftmost panel to view all the SOAR sections. This Process is applicable in all navigating into a Module.
Dashboard
The SOAR Dashboard allows you to monitor and manage security incidents in real time. It provides key metrics like Incident Status, Automated Playbooks, Response Actions, and Case Prioritization, helping you quickly assess and respond to security events while streamlining workflows.
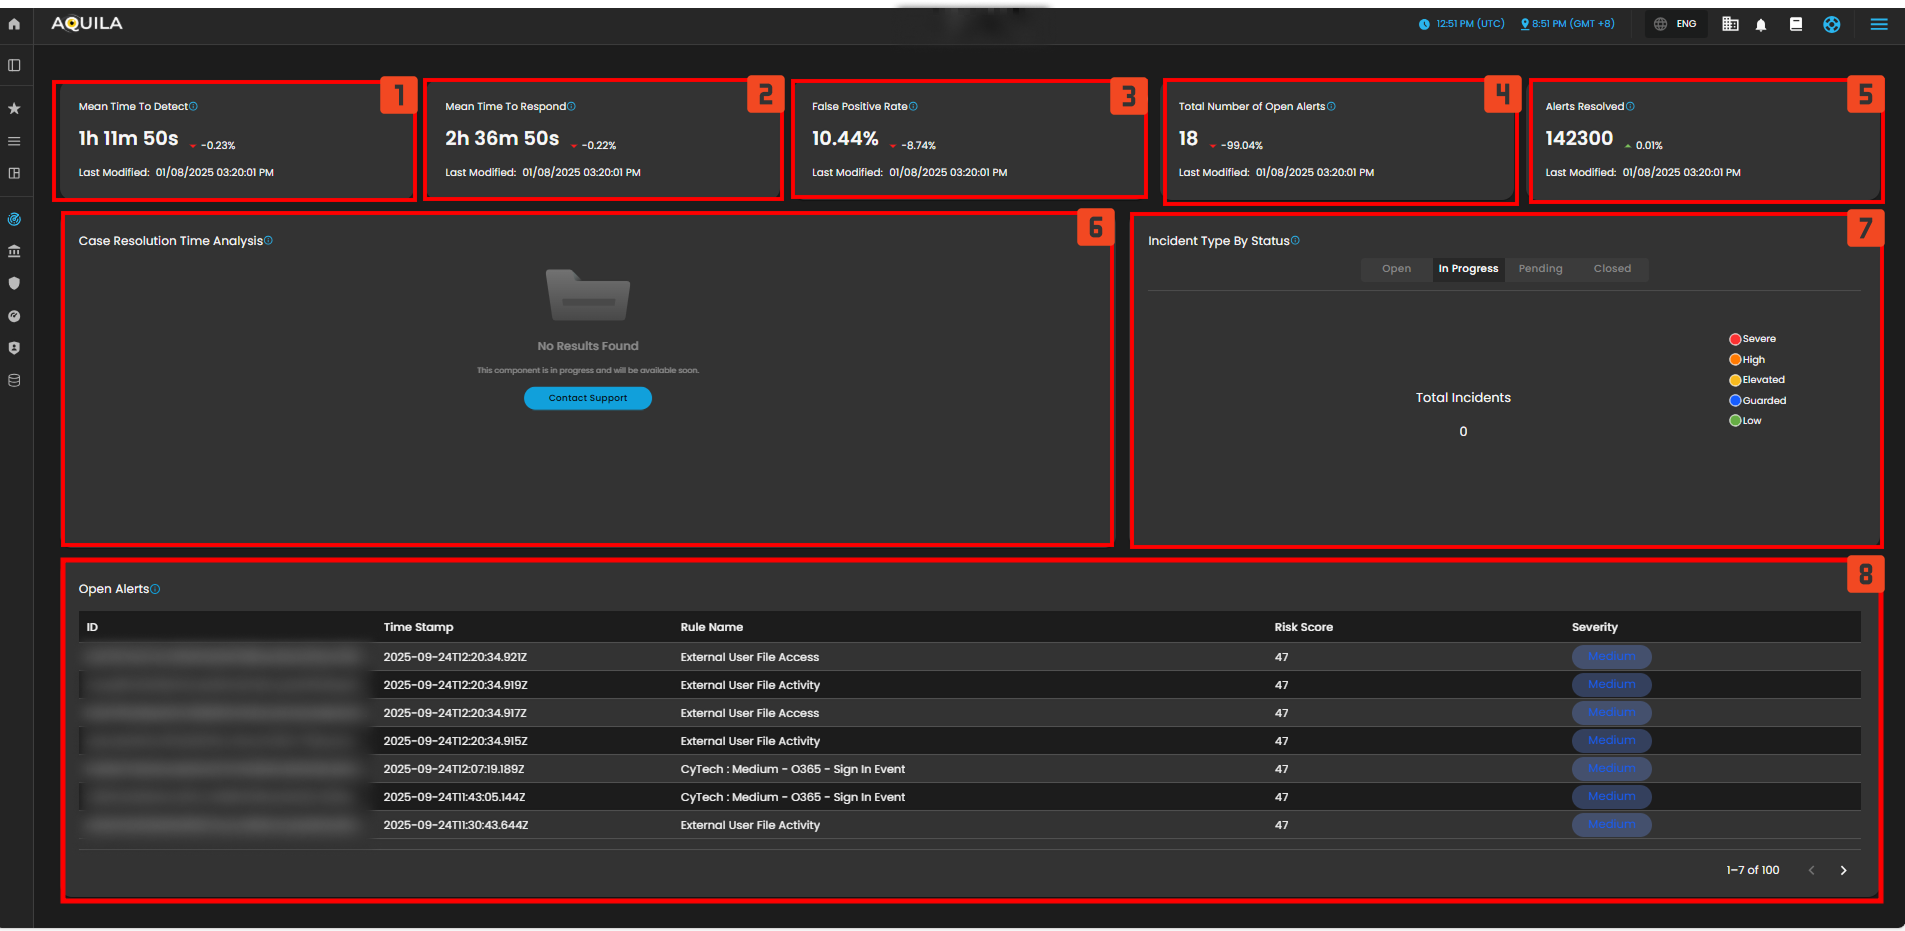
- Mean Time to Detect:
- This widget shows the average time it takes to detect security threats on the endpoints. Currently, the "Mean Time to Detect" is 1 hour, 11 minutes, and 50 seconds, indicating the time it takes for the system to identify potential security risks. The metric shows a slight decrease of -0.23%, which suggests a minor improvement in detection time.
- Mean Time to Respond:
- This widget indicates the average time it takes to respond to detected security incidents. At present, the "Mean Time to Respond" is 2 hours, 36 minutes, and 50 seconds. This metric shows a small decrease of -0.22%, suggesting that the response times are gradually improving.
- False Positive Rate:
- The "False Positive Rate" widget shows the percentage of detected alerts that turned out to be false positives. The current rate is 10.44%, with a significant decrease of -8.74%, indicating an improvement in the accuracy of the alerts being raised by the system.
- Total Number of Open Alerts:
- This widget displays the total number of active alerts that require attention from the security team. Currently, there are 18 open alerts, showing a decrease of -99.04%. This indicates that most alerts have either been addressed or resolved, and only a few remain pending or in progress.
- Alerts Resolved:
- The "Alerts Resolved" widget shows the total number of alerts that have been successfully resolved. With 142,300 alerts resolved, this number reflects the effectiveness and efficiency of the security team's response to incidents. The metric shows a minimal increase of +0.01%, suggesting that the resolution rate remains stable.
- Incident Type by Status:
- This widget breaks down the incidents by their current status: "Open," "In Progress," "Pending," and "Closed." In the provided data, there are no incidents listed, with "Total Incidents" showing as 0, meaning there are no incidents requiring immediate action at the moment.
- Open Alerts Table:
- The Open Alerts Table lists all the currently open alerts, showing detailed information for each one. The table includes the alert ID, timestamp, rule name, risk score, and severity of the incident. For example, it shows multiple entries related to External User File Access with a risk score of 47 and a severity level marked as "Medium." These entries help the security team assess the potential threats and prioritize actions.
- Severity Breakdown of Alerts:
- This widget displays a breakdown of the severity levels of the ongoing incidents. The severity levels are categorized by color codes, such as Severe, High, Elevated, Guarded, and Low. The widget helps track the urgency of incidents and prioritize response efforts accordingly.
Control Panel
The Control Panel is the hub for managing alerts, rules, and tools. It lets users configure settings for Alert Tagging, Alert Rules, and External Tools, offering an organized way to control how security alerts and responses are handled.
Alert Tagging
The Alert Tagging section in the Control Panel allows you to organize and prioritize your alerts using custom tags. This feature helps users manage their alerts more effectively. Currently, there are no tags set, and the section shows an empty state.
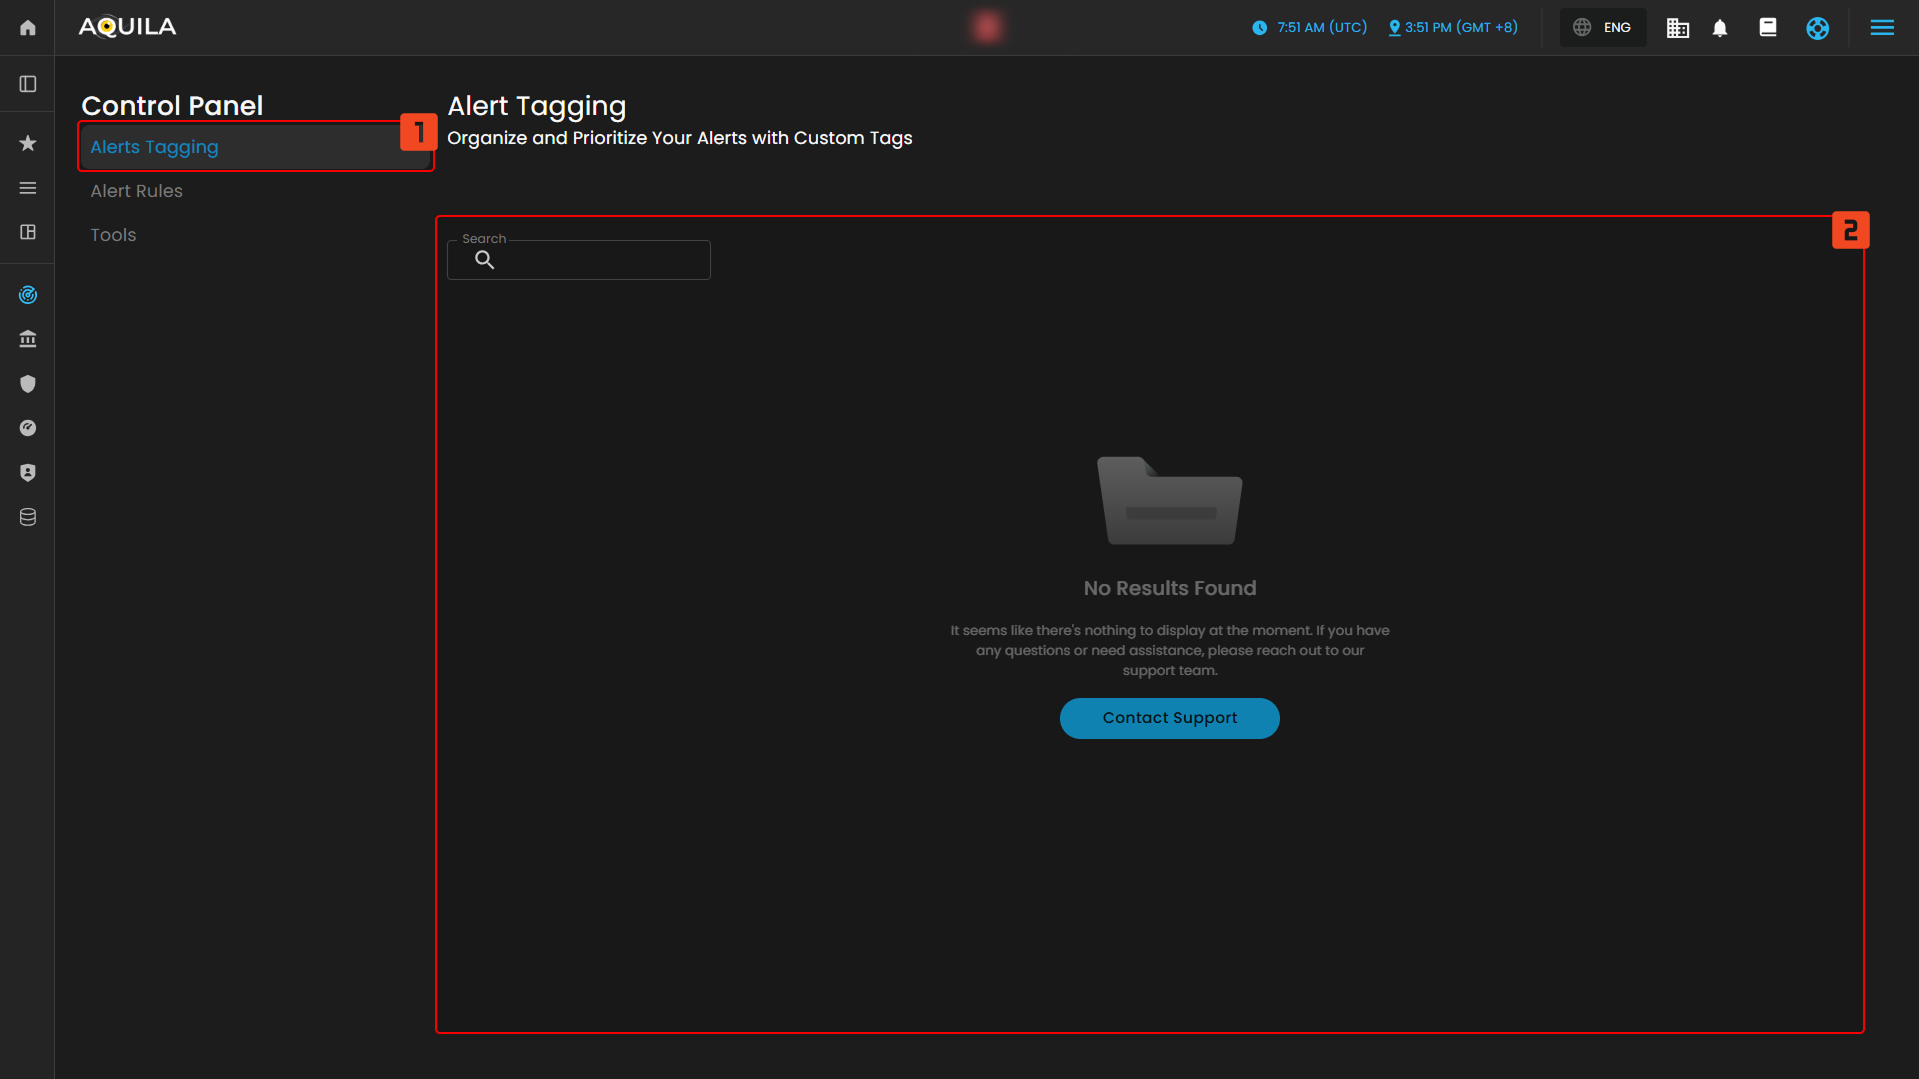
- Search
- The search bar in the middle of the page allows you to filter and search for specific alerts or tags. However, as of now, no results are displayed, suggesting that no specific search criteria have been applied or that there are no available alerts to display.
- No Results Found
- This message indicates that there are no alerts or tags currently available or set. The prompt informs the user that there is nothing to display at the moment. If further assistance is needed, the user can click on the “Contact Support” button for help.
Alert Rules
The Alert Rules section in the Control Panel provides a comprehensive list of active detection rules. Each rule is associated with a specific alert or action that the system monitors. The table lists key details, such as the rule name, risk score, severity, and the status of the rule’s last response. This section also indicates whether the rule is currently enabled or disabled, with the option to toggle its status.
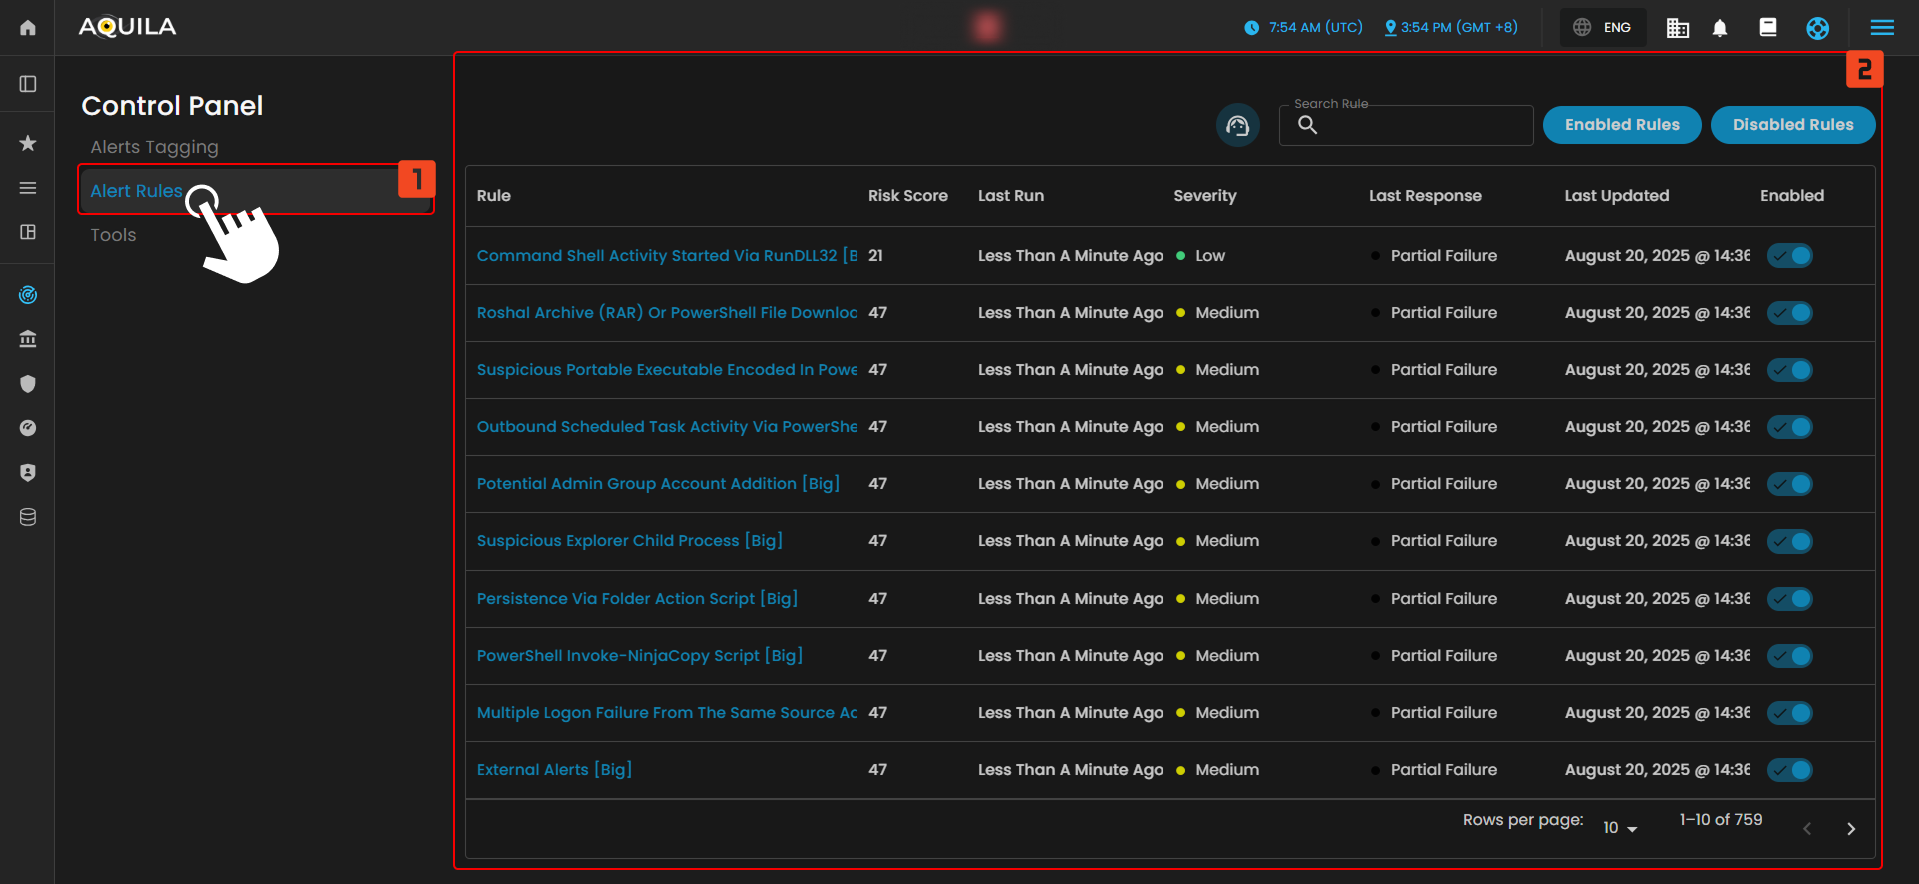
- Search Rule
- At the top of the table, there is a search bar that allows users to filter and search for specific alert rules. This feature helps users quickly locate a particular rule based on its name or other criteria.
- Enabled/Disabled Rules
- There are two buttons above the list: Enabled Rules and Disabled Rules. These buttons allow users to toggle between viewing only enabled or disabled rules, providing a more streamlined way to manage and review the status of detection rules.
-
Rule Overview
-
Each row in the table presents details of an individual alert rule, such as:
-
Rule: The name of the rule and associated system or operation.
-
Risk Score: The assigned risk score for the rule, which helps indicate the potential severity of the detected activity.
-
Severity: A color-coded indicator representing the severity level of the rule, ranging from low to high.
-
Last Run: The most recent execution time of the rule.
-
Last Response: The outcome of the rule's most recent execution, which can be "Succeeded," "Failed," or "Partial Failure."
-
Last Updated: When the rule was last updated.
-
Enabled: Indicates whether the rule is currently active or disabled.
-
-
- This section helps system administrators monitor and manage active detection rules and respond to threats effectively.
Tools
The Tools section in the Control Panel allows users to manage and enhance their IP security using custom tools. This section displays a list of available tools, including their current state and the actions that can be taken with them. At the moment, no tools are displayed, indicating that there are no custom tools configured or available in the system.
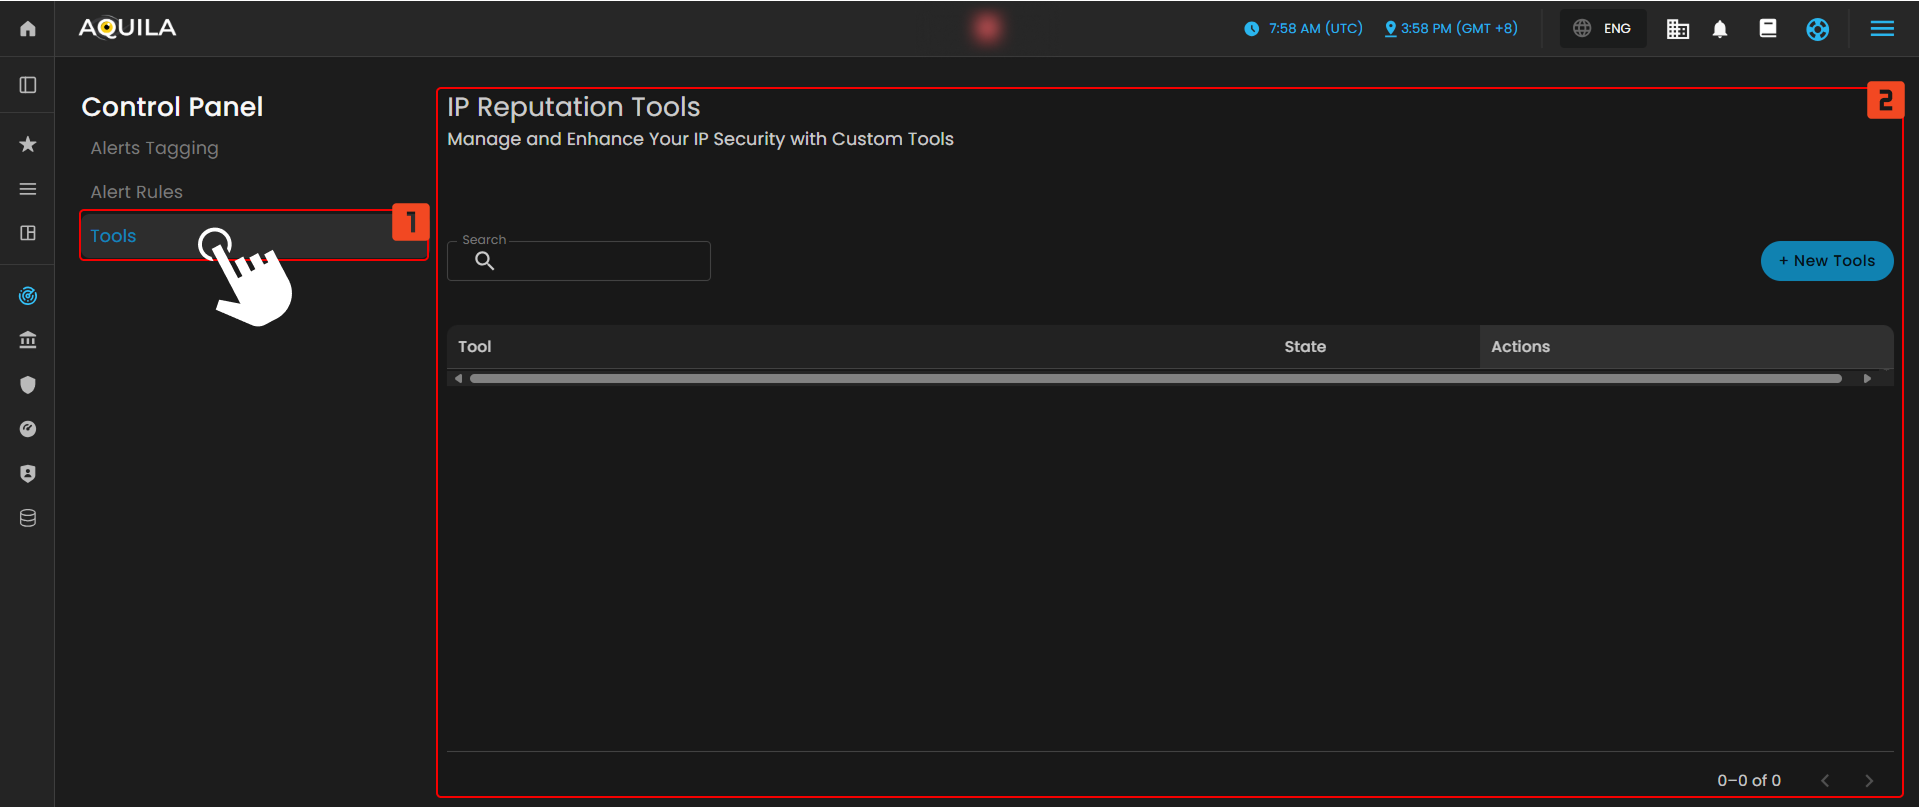
- Search
- A search bar is provided at the top of the section, allowing users to filter and find specific tools by name. This feature helps users quickly locate a particular tool if many tools are available.
- State and Actions
- Each tool entry would typically display its current State (e.g., active, inactive) and available Actions (such as edit, enable/disable, or delete). However, since no tools are listed at the moment, this section appears empty.
- New Tools
- New Tools button is available in the upper-right corner, allowing users to add new custom tools to the system. This provides an easy way to enhance IP security by integrating new tools.
- The IP Reputation Tool section allows users to add a new tool for managing and enhancing their IP security. To do so, users are prompted to enter the name and URL of the tool.
- After completing these fields, users can submit the information, adding the tool to the system for improved IP reputation management. This functionality enables users to customize their security tools and optimize how IP reputation data is handled within their system.
If you need further assistance, kindly contact support@cytechint.com for prompt assistance and guidance.
No comments to display
No comments to display