Endpoint Detection and Response (EDR)
Overview:
AQUILA EDR provides organizations with prevention, detection, and response capabilities with deep visibility for EPP, EDR, SIEM, and Security Analytics use cases across Windows, macOS, and Linux operating systems running on both traditional endpoints and public cloud environments.
🔒 Core Capabilities
-
Prevent complex attacks - Prevent malware (Windows, macOS, Linux) and ransomware (Windows) from executing, and stop advanced threats with malicious behavior (Windows, macOS, Linux), memory threat (Windows, macOS, Linux), and credential hardening (Windows) protections.
-
Alert in high fidelity - Bolster team efficacy by detecting threats centrally and minimizing false positives via extensive corroboration.
-
Detect threats in high fidelity - facilitates deep visibility by instrumenting the process, file, and network data in your environments with minimal data collection overhead.
-
Triage and respond rapidly - Quickly analyze detailed data from across your hosts. Examine host-based activity with interactive visualizations. Invoke remote response actions across distributed endpoints. Extend investigation capabilities even further with the Osquery integration, fully integrated into Security workflows.
-
Secure your cloud workloads - Stop threats targeting cloud workloads and cloud-native applications. Gain real-time visibility and control with a lightweight user-space agent, powered by eBPF. Automate the identification of cloud threats with detection rules and machine learning (ML). Achieve rapid time-to-value with MITRE ATT&CK-aligned detections.
-
View terminal sessions - Give your security team a unique and powerful investigative tool for digital forensics and incident response (DFIR), reducing the mean time to respond (MTTR). Session view provides a time-ordered series of process executions in your Linux workloads in the form of a terminal shell, as well as the ability to replay the terminal session.
🛡️ Protections Matrix
|
Protection Type |
OS Support |
Detect |
Prevent |
Description |
|
Malware |
Windows, macOS, Linux |
|
✅ |
Blocks known malicious executables and scripts at runtime. |
|
Ransomware |
Windows |
|
✅ |
Detects rapid file changes and unauthorized encryption activity. |
|
Memory Threats |
Windows, macOS, Linux |
|
✅ |
Prevents memory-based attacks like process injection or ROP chains. |
|
Malicious Behavior |
Windows, macOS, Linux |
|
✅ |
Stops suspicious techniques such as abnormal child processes or LOLBins. |
|
Credential Hardening |
Windows |
|
Enabled |
Protects credentials by preventing unauthorized LSASS access. |
📊 Event Collection
|
Event Type |
Windows |
macOS |
Linux |
Description |
|
API |
✅ |
– |
– |
Logs sensitive API calls that may indicate injection or system tampering. |
|
DLL & Driver Load |
✅ |
– |
– |
Captures DLL/driver loading to detect unsigned or malicious code injection. |
|
DNS |
✅ |
– |
– |
Records DNS queries/responses to spot C2, tunneling, or data exfiltration. |
|
File |
✅ |
✅ |
✅ |
Monitors file creation, deletion, and modification to detect malware or ransomware. |
|
Network |
✅ |
✅ |
✅ |
Logs connections, ports, and protocols to uncover C2 traffic or lateral movement. |
|
Process |
✅ |
✅ |
✅ |
Tracks process execution, parent/child relationships, and suspicious spawns. |
|
Registry |
✅ |
– |
– |
Detects persistence or tampering with critical Windows registry keys. |
|
Security |
✅ |
– |
– |
Captures login attempts, privilege changes, and policy modifications. |
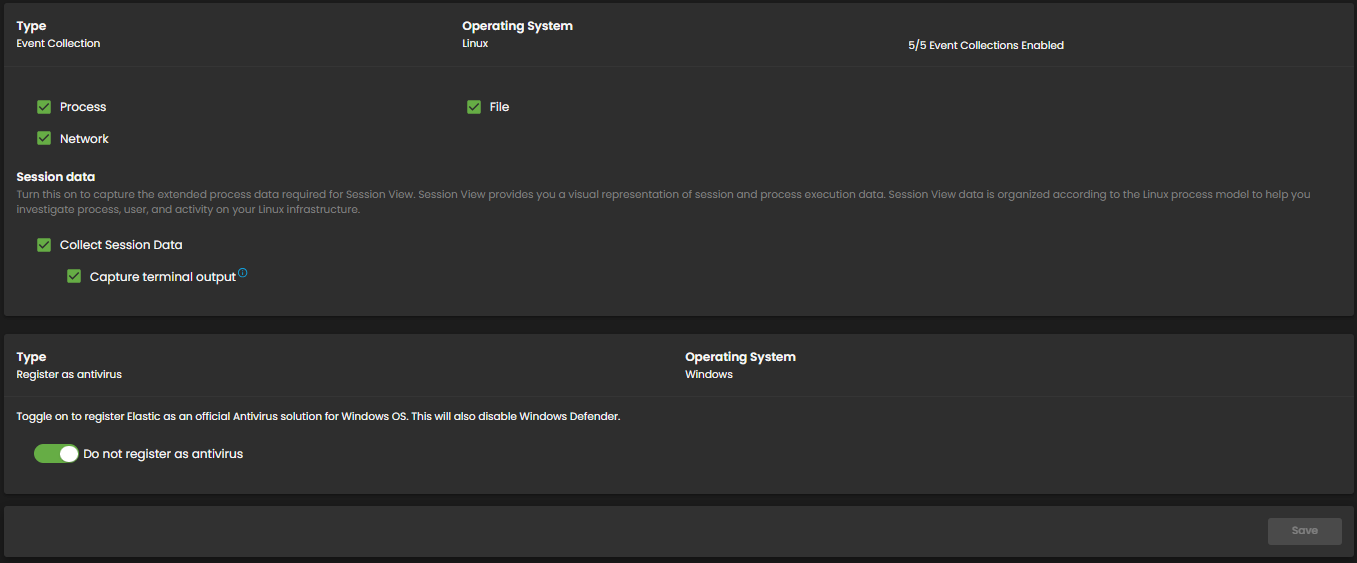
⚙️ Windows Antivirus Registration
-
AQUILA EDR can register as the primary antivirus through Windows Security Center.
-
Not supported on Windows Server (no Security Center available).
-
Enabled to register AQUILA EDR as an official Antivirus solution for Windows OS. This will also disable Windows Defender.
-
Current configuration: Sync with malware protection level. ✅
Event Categories – Detailed Reference
|
Event Type |
Description |
Use Case |
Example |
|
API Events |
Capture system-level API calls made by processes. These events show how applications interact with the OS, libraries, and security-sensitive functions. |
Detect process injection, privilege escalation, exploitation attempts, or use of unusual APIs by non-standard processes. |
A Microsoft Office process (WINWORD.EXE) invokes VirtualAllocEx and WriteProcessMemory to inject code into another process. |
|
|
|
|
|
|
DLL & Driver Load Events |
Record the loading of DLLs into user processes and drivers into the OS kernel. Includes path, signature status, and process context. |
Detect unsigned or suspicious DLLs/drivers, DLL search order hijacking, and kernel-level rootkits. |
An unsigned driver is loaded during system boot, or a legitimate app loads a DLL from a non-standard directory. |
|
|
|
|
|
|
DNS Events |
Log all DNS lookups and responses, showing which domains are queried and by which process. |
Detect C2 callbacks, malware beaconing, DNS tunneling, and suspicious domain resolution. |
A process repeatedly queries random subdomains of example[.]com, suggesting DGA (Domain Generation Algorithm) use. |
|
|
|
|
|
|
File Events |
Monitor file activity: creation, modification, deletion, renaming, and read access. Includes metadata like file path, hash, and process context. |
Detect ransomware encryption, malware staging (dropping executables), tampering with sensitive files, or unauthorized access. |
A process writes multiple .encrypted files in rapid succession in a user’s documents folder. |
|
|
|
|
|
|
Network Events |
Capture TCP/UDP connections, ports, IPs, protocols, and process responsible. |
Detect outbound connections to malicious infrastructure, lateral movement inside a network, or data exfiltration attempts. |
PowerShell initiates a connection to a known malicious IP over port 443 with unusual payload size. |
|
|
|
|
|
|
Process Events |
Record process lifecycle: creation, termination, parent-child relationships, command-line arguments, and integrity info. |
Detect abnormal parent-child chains, privilege escalation, process hollowing/injection, and script-based attacks. |
explorer.exe launches powershell.exe with a Base64-encoded command to download a payload. |
|
|
|
|
|
|
Registry Events |
Log modifications to Windows Registry, including key creation, deletion, and value changes. |
Detect persistence mechanisms, system tampering, and security feature bypasses. |
Malware creates HKCU\Software\Microsoft\Windows\CurrentVersion\Run\malware.exe for auto-start persistence. |
|
|
|
|
|
|
Security Events |
Record security-related activity: authentication attempts, user/group changes, privilege assignments, and policy alterations. |
Detect brute force attacks, privilege abuse, unauthorized access, and security control disabling. |
Multiple failed login attempts followed by a successful login with a privileged account. |
Pre-requisites
- Access to CyTech - AQUILA
-
Only users assigned the "Owner" or "Admin" role can access the Control Panel page within this module.
-
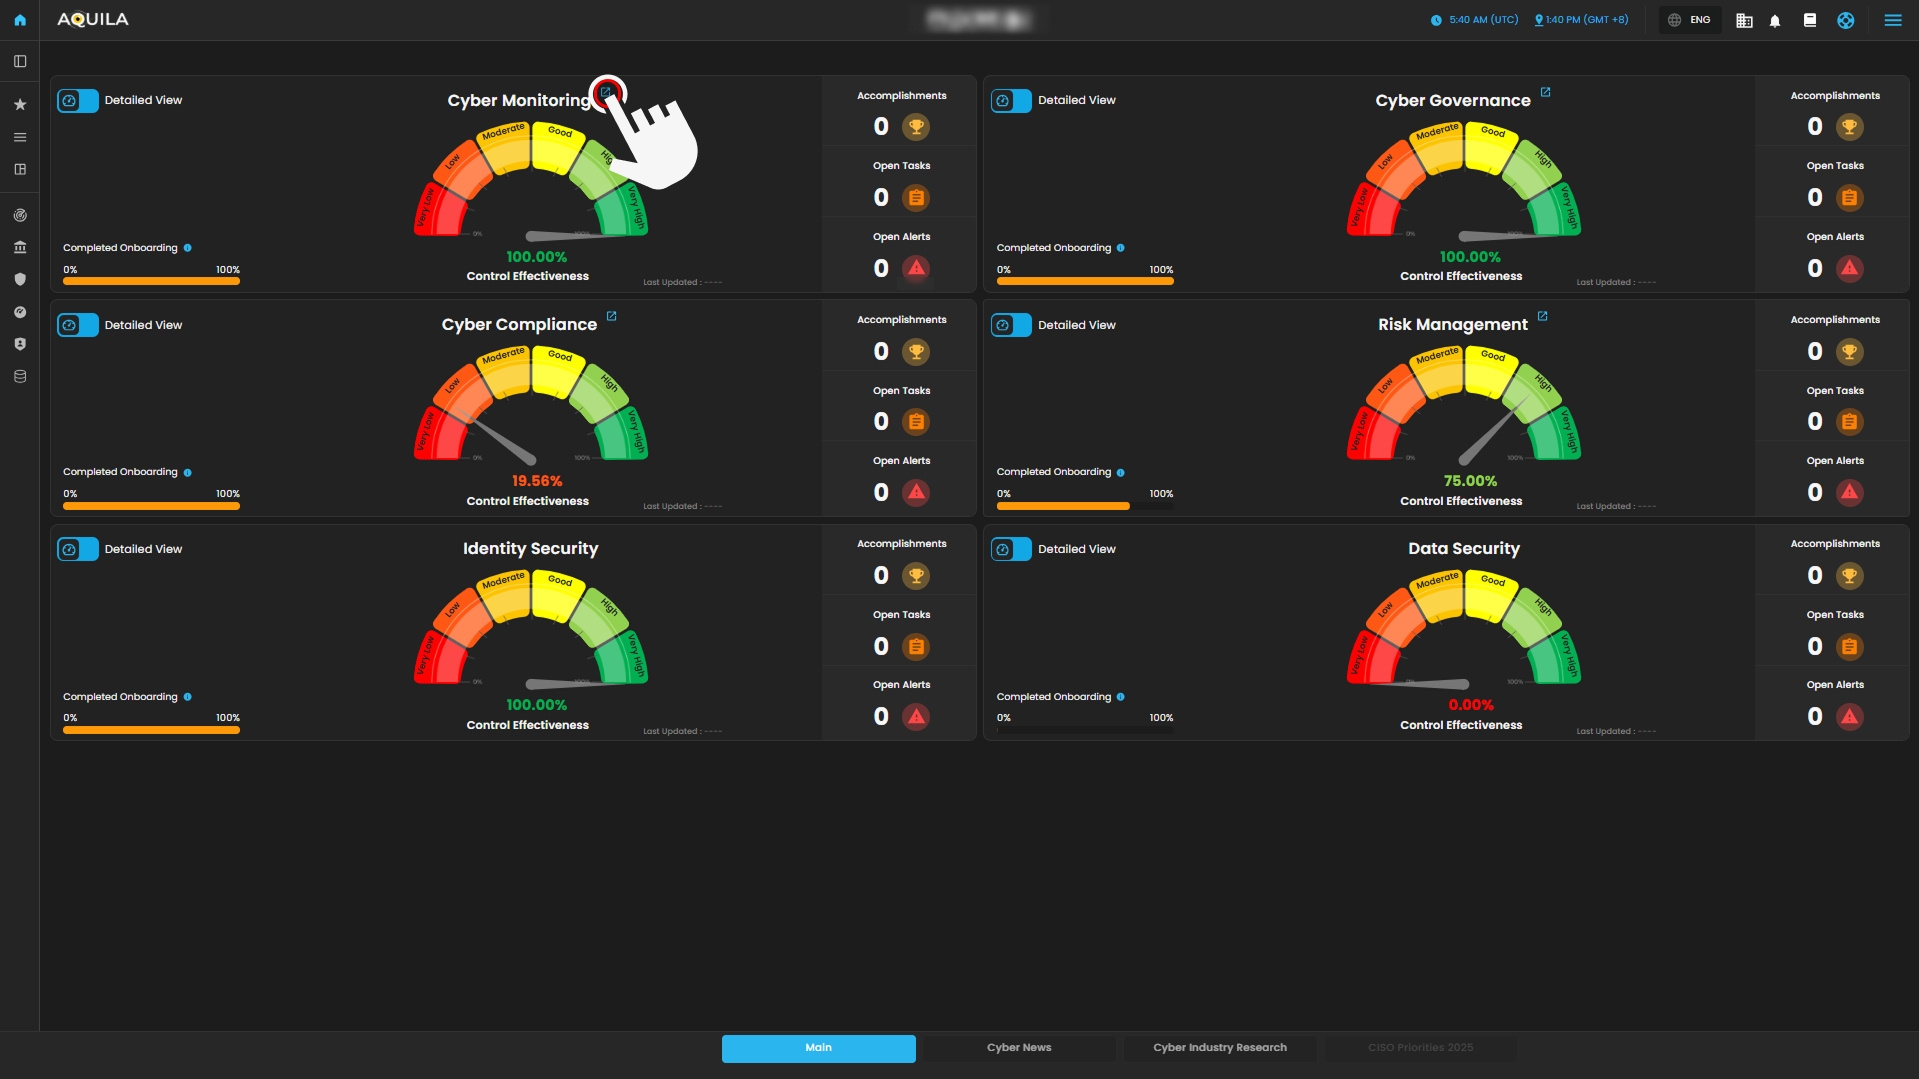
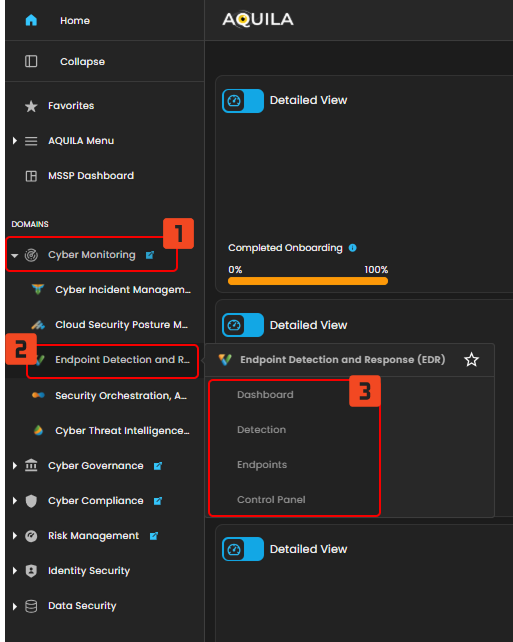
Step 3: Choose Endpoint Detection and Response (EDR).
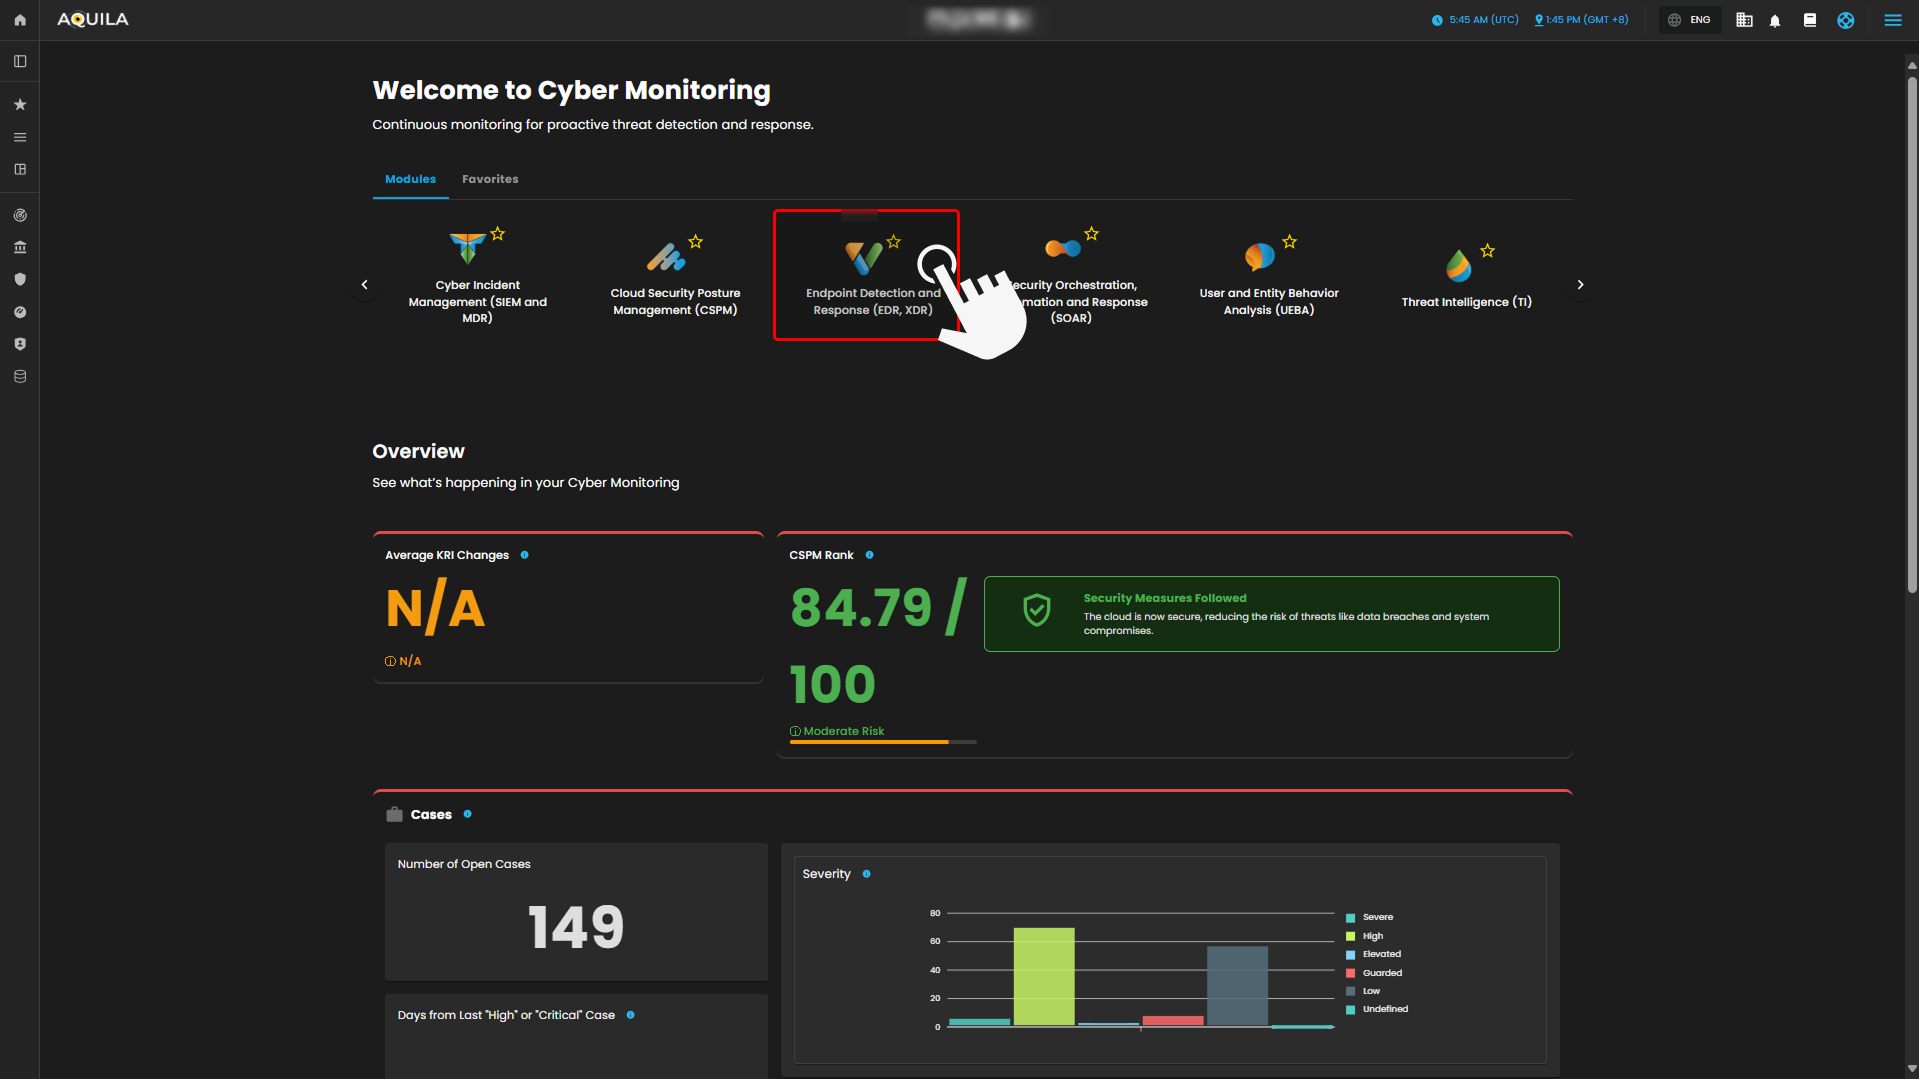
Step 4: Hover into leftmost panel to view all the EDR sections. This Process is applicable in all navigating into a Module.
Dashboard
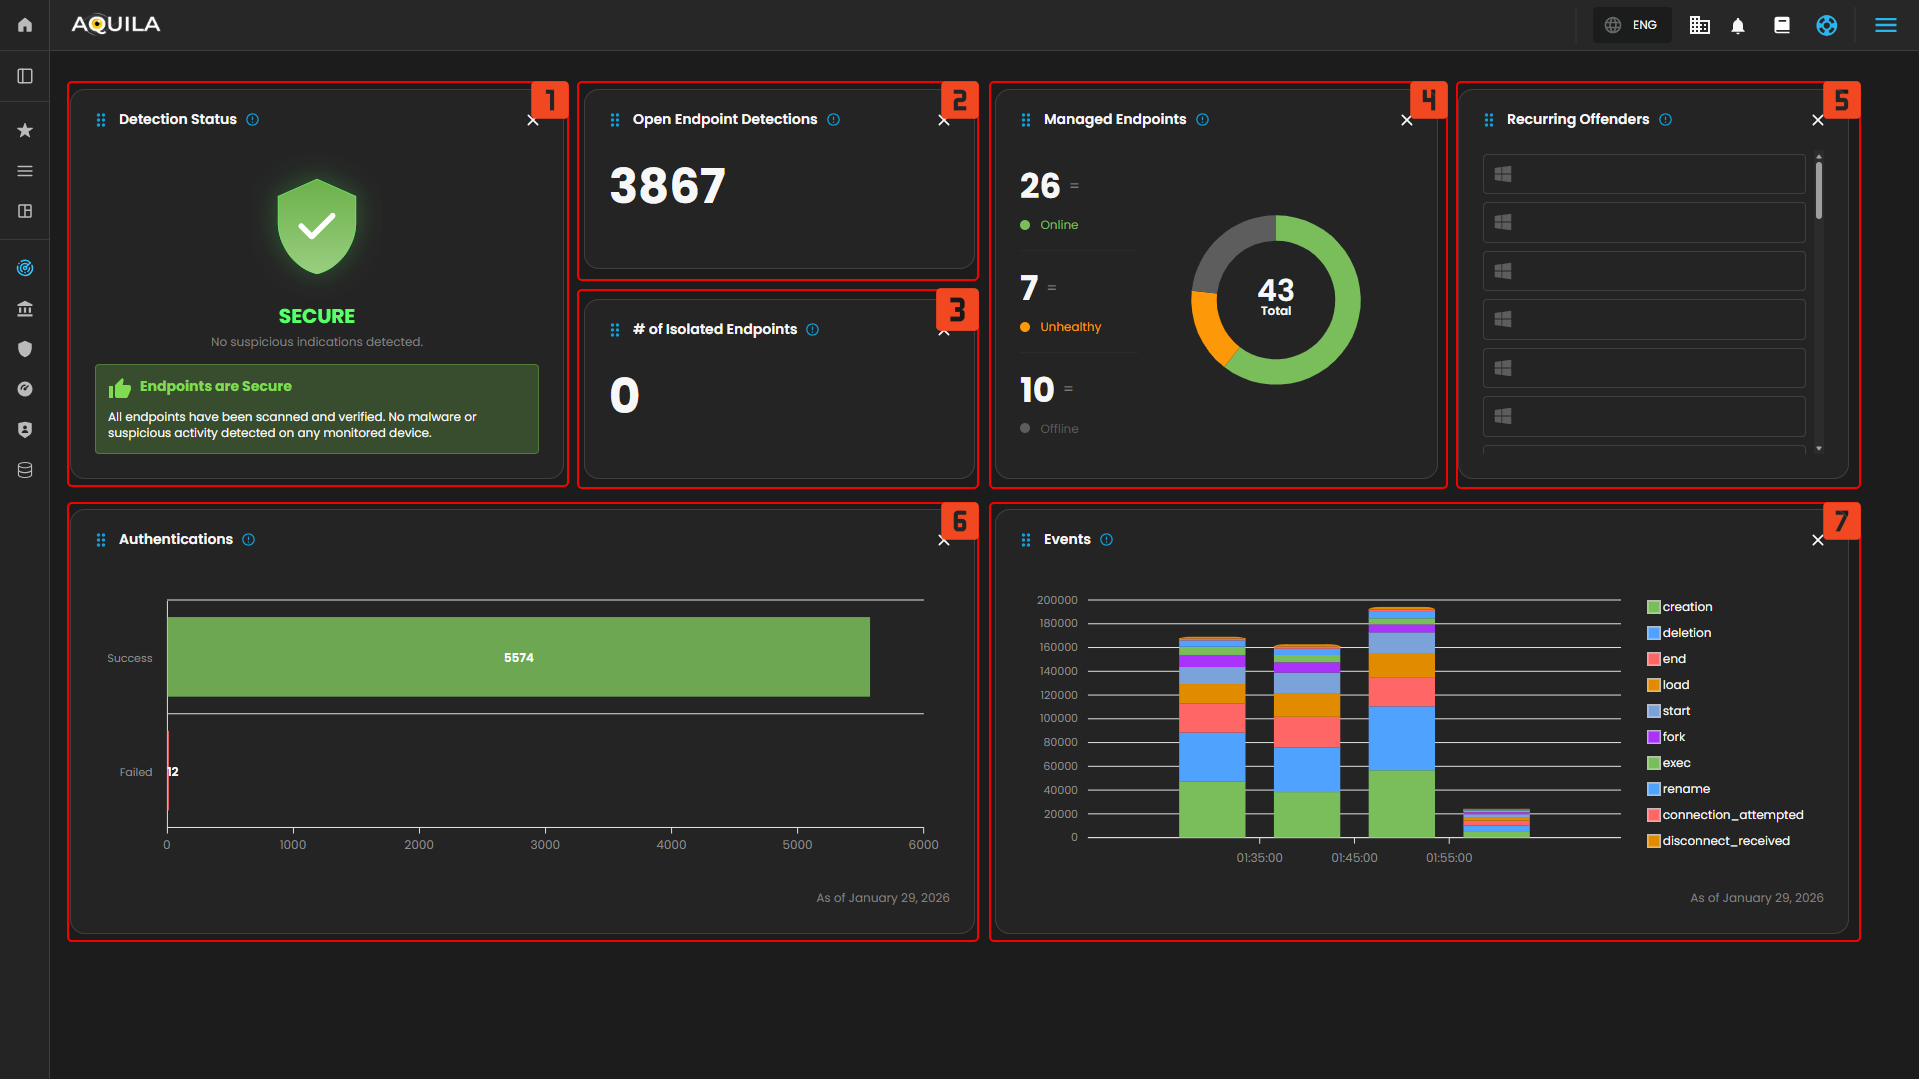
In the EDR Module Dashboard, you can monitor the security status of endpoints at a glance. This includes Detection Status, Endpoint Health, Authentication Attempts, Event Activity, and Recurring Offenders.
-
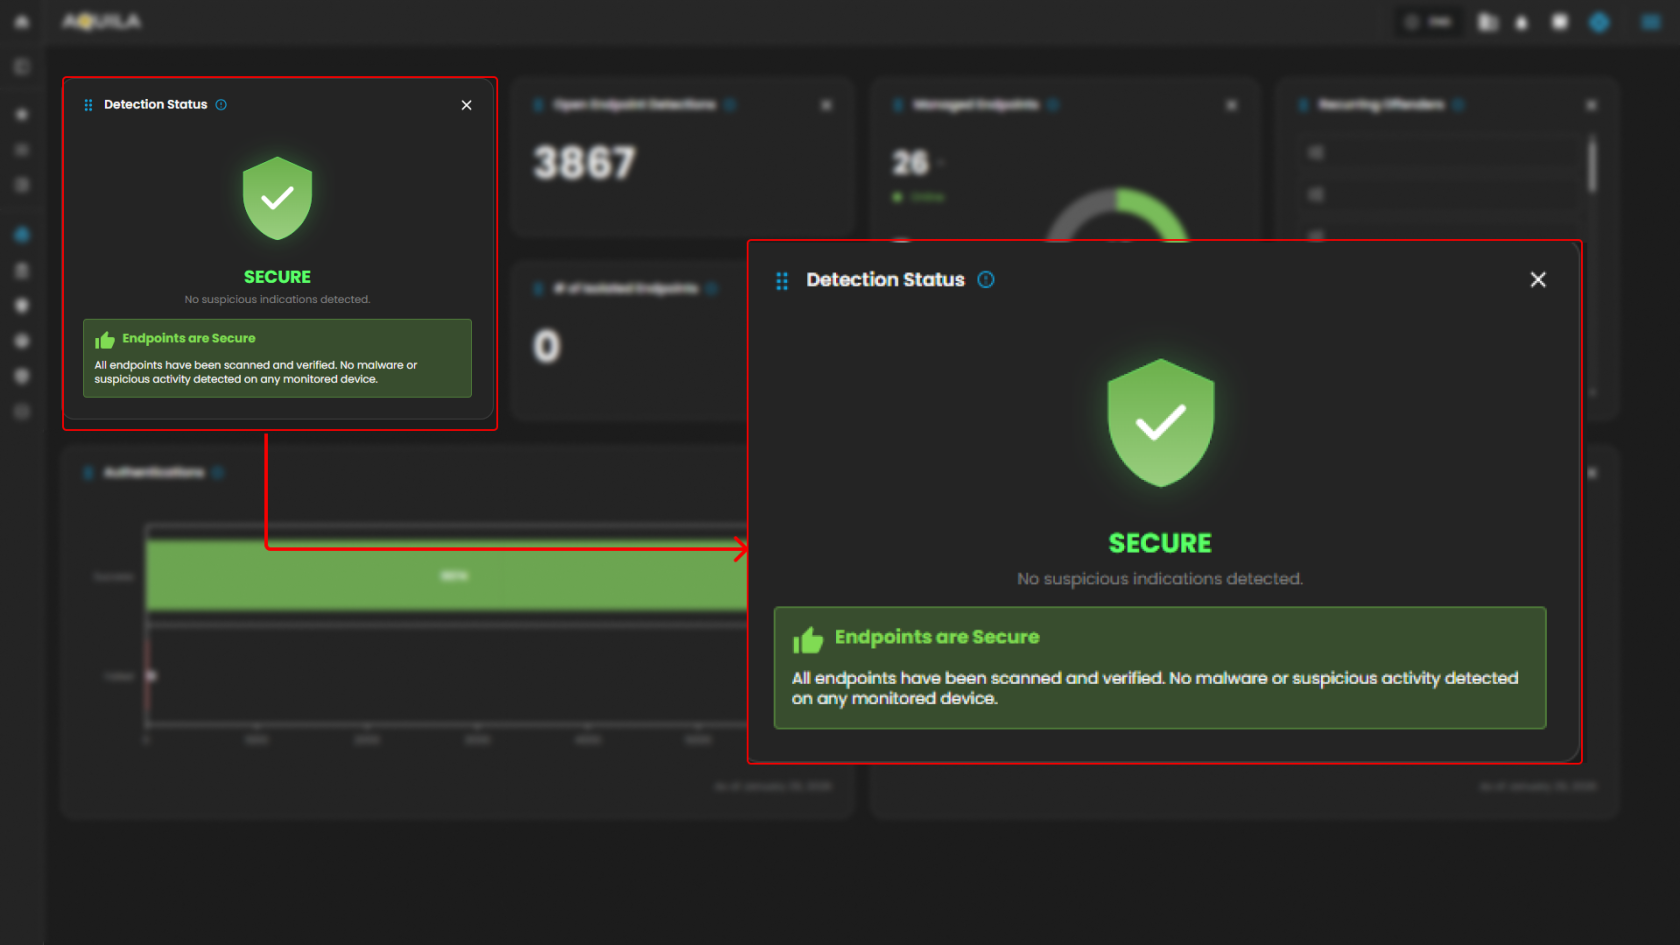
Detection Status:
-
This widget shows the overall security status of the monitored endpoints. It indicates that there are no suspicious activities or malware detected. The green "SECURE" status confirms that the system is not facing any security issues at the moment.
-
-
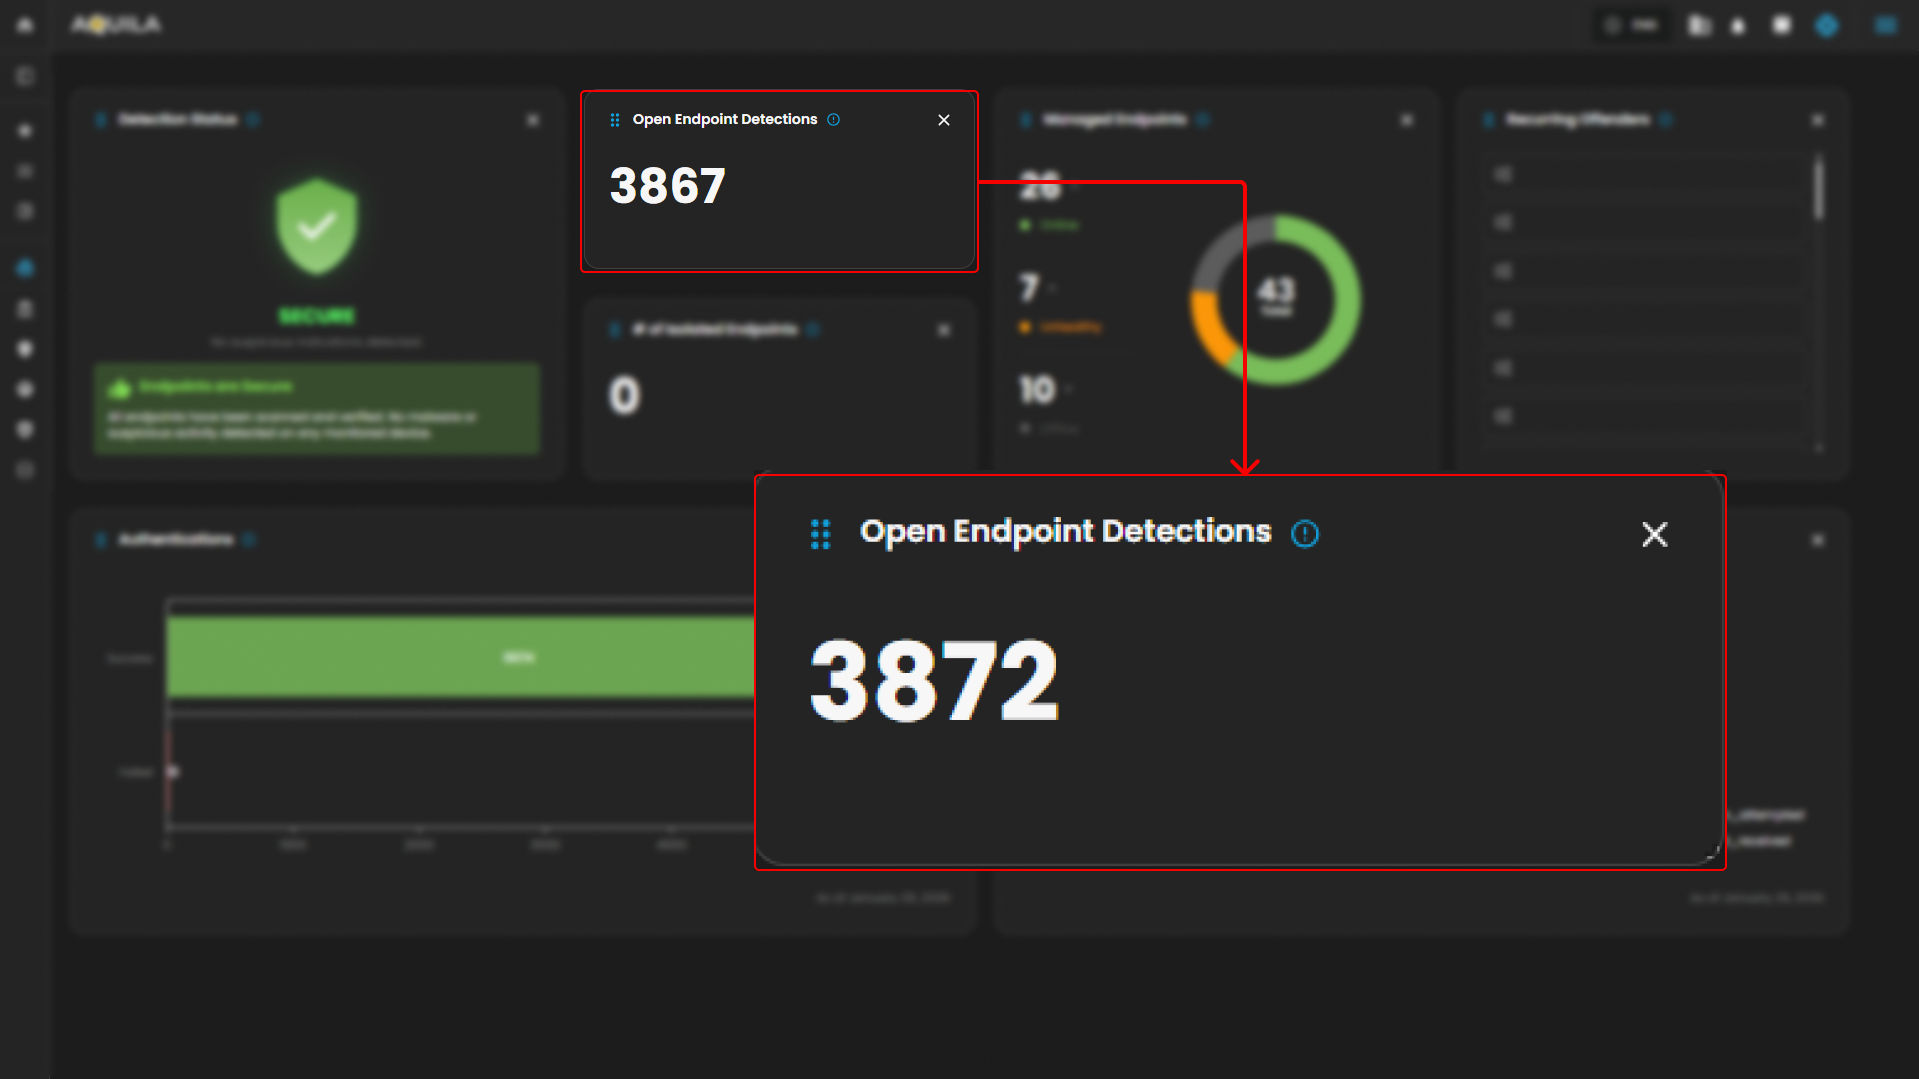
Open Endpoint Detections:
-
Displays the number of currently active endpoint detections.

-
-
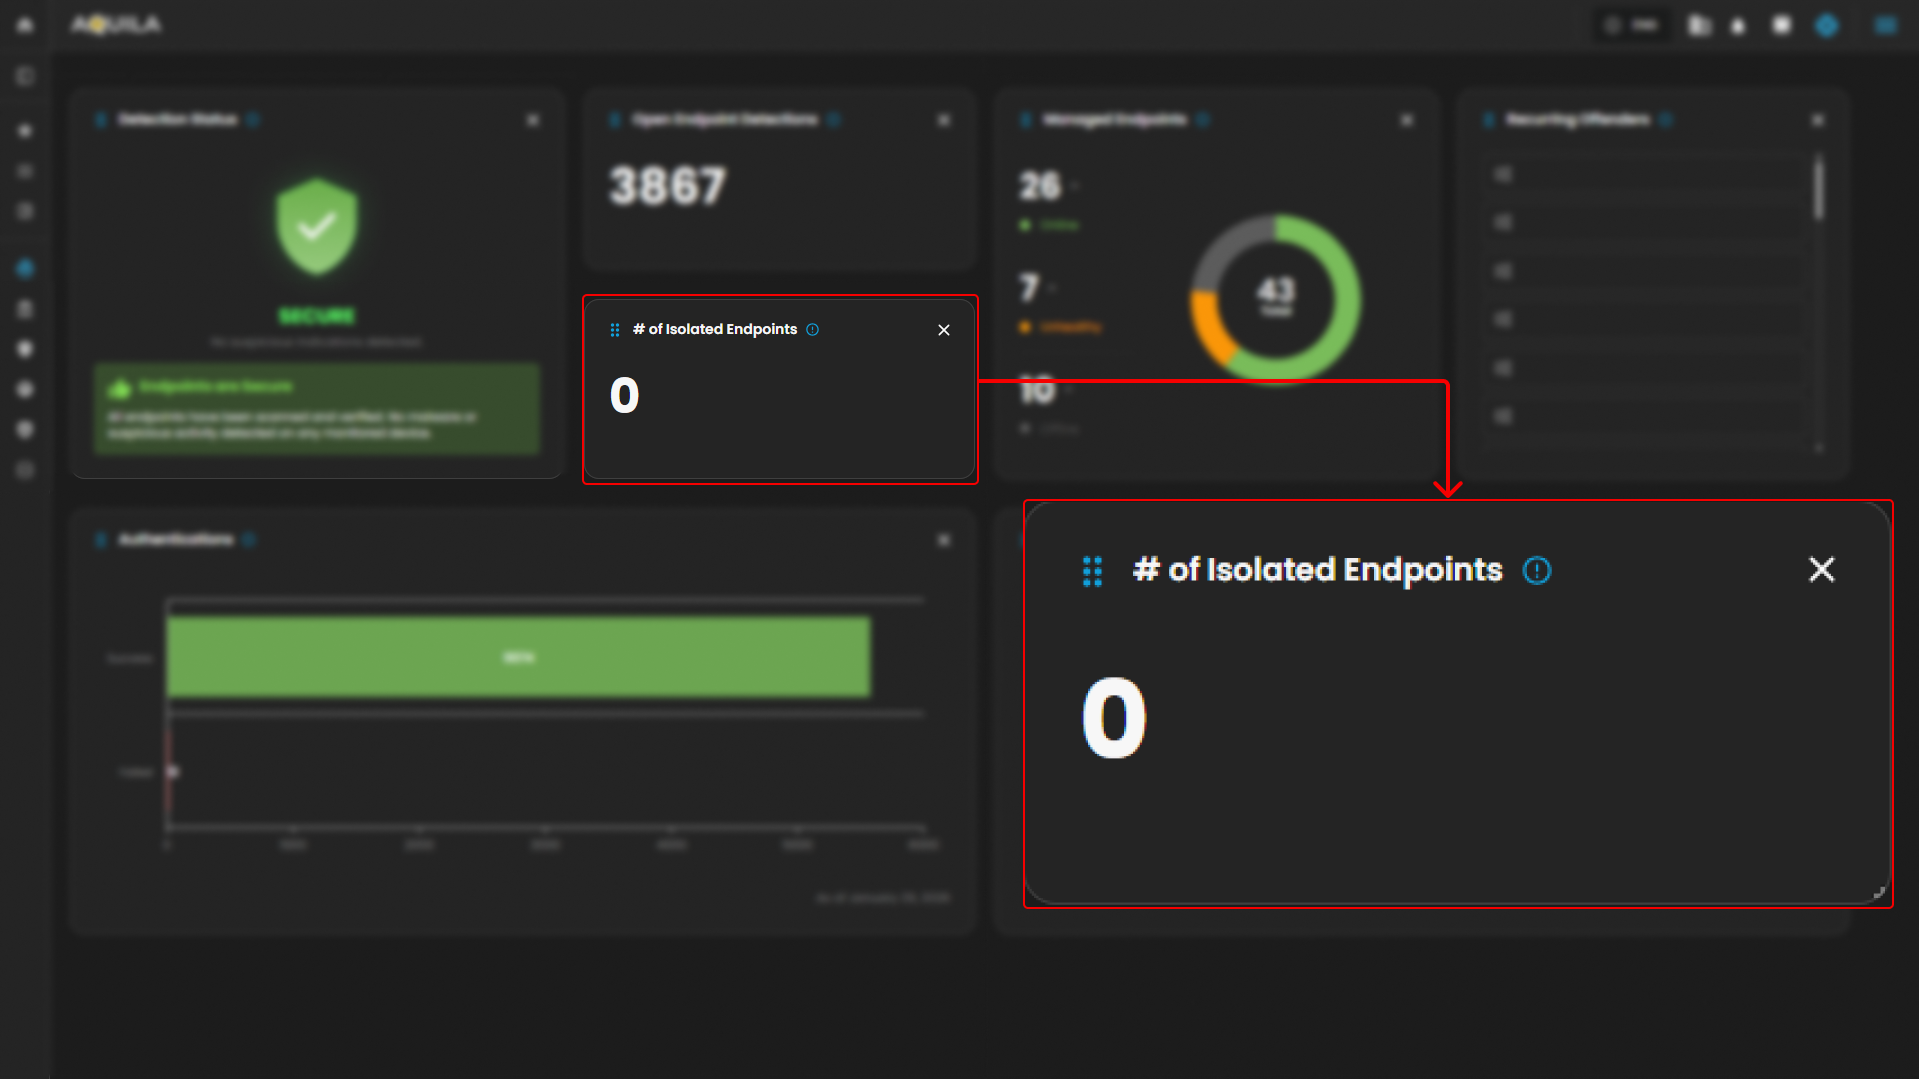
Number of Isolated Endpoints:
-
Displays the number of endpoints that have been isolated due to detected threats or suspicious activities. The value is 0, indicating that no endpoints have been isolated.

-
-
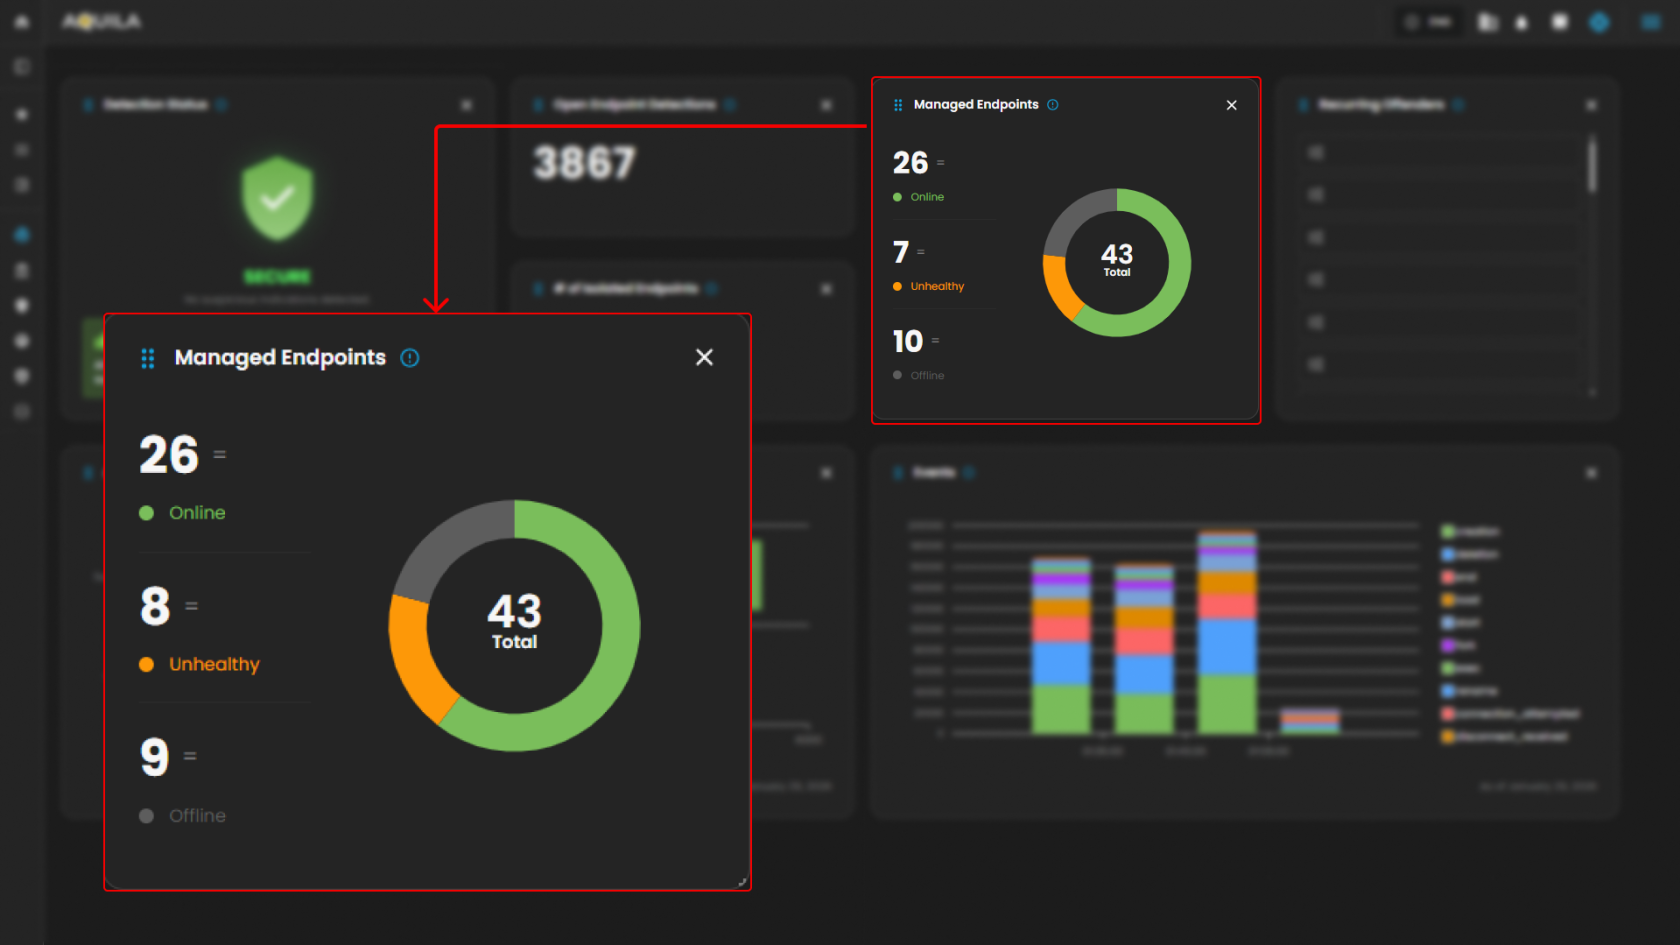
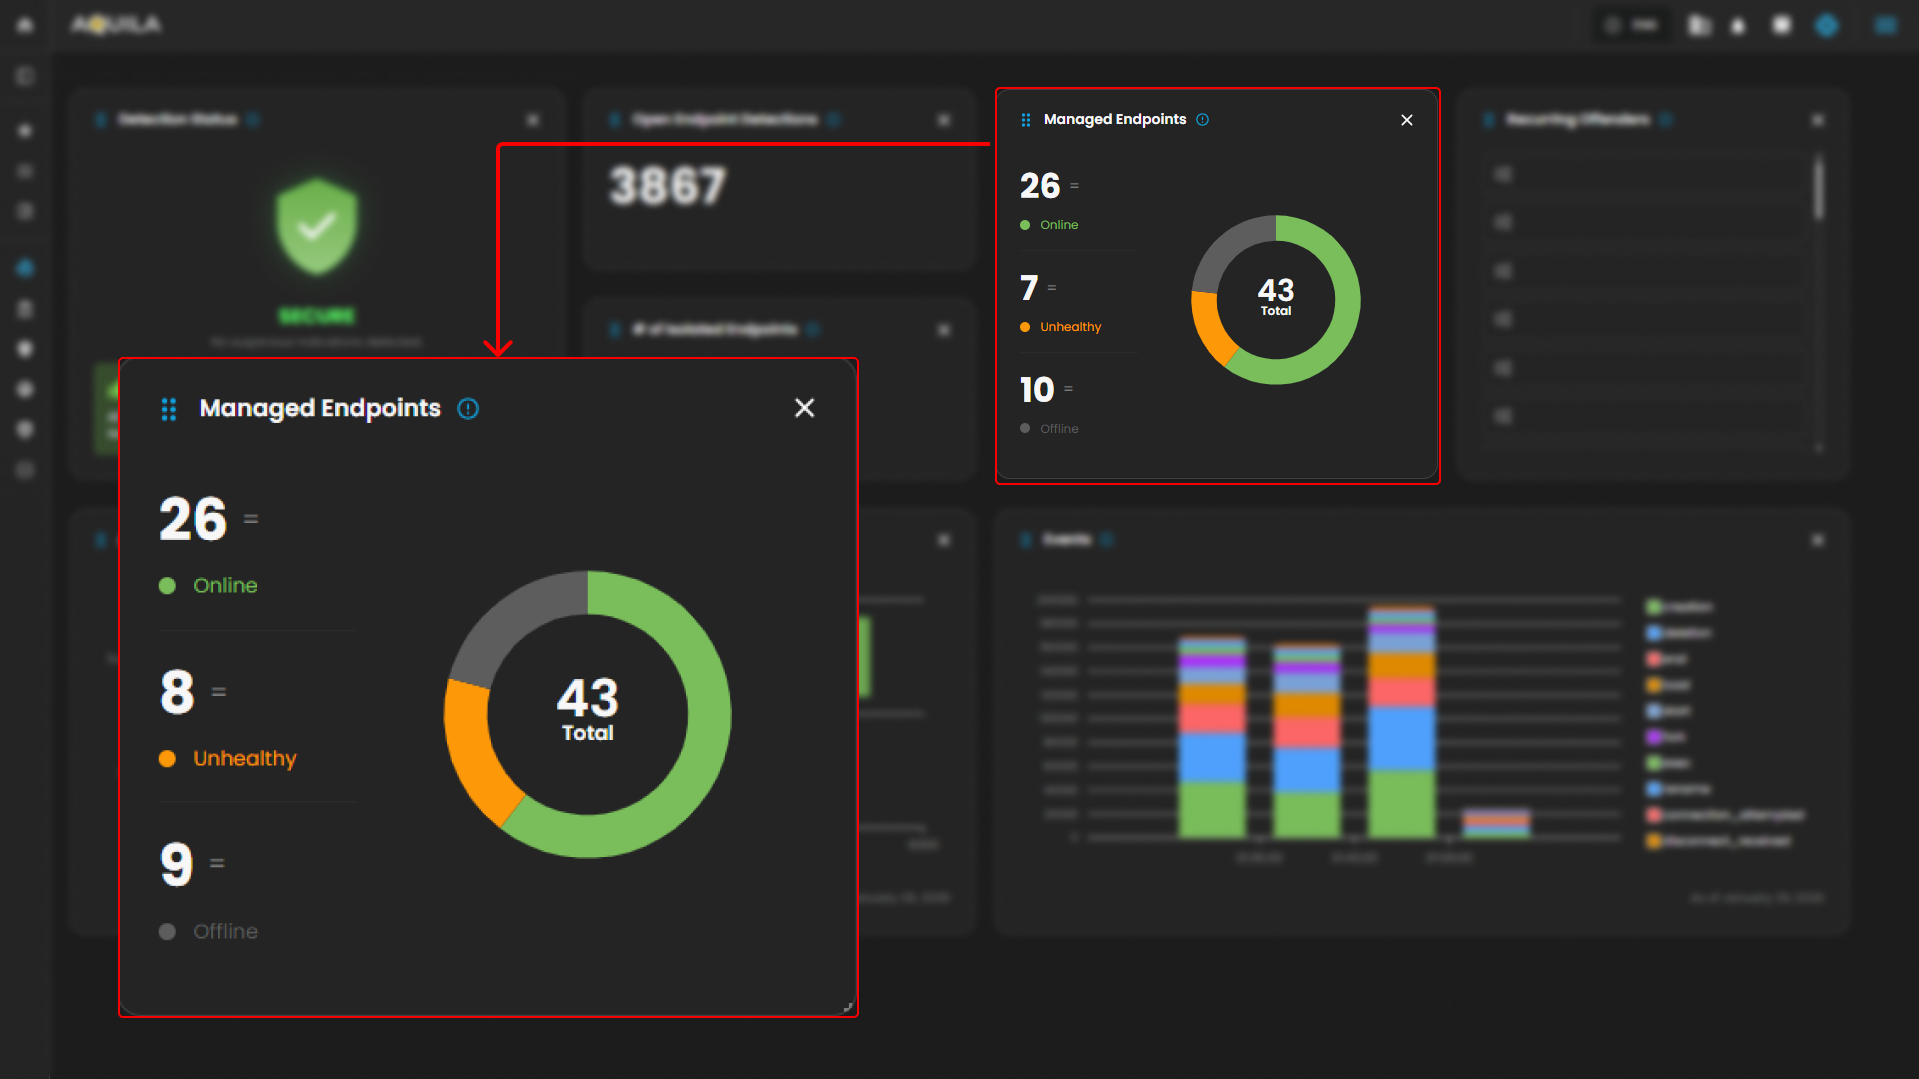
Managed Endpoints:
-
Shows a breakdown of the endpoints under management. There is one endpoint marked as "Online" (green), and one is "Offline" (gray). The "Unhealthy" count is 0, which suggests no issues with endpoint health.
-
-
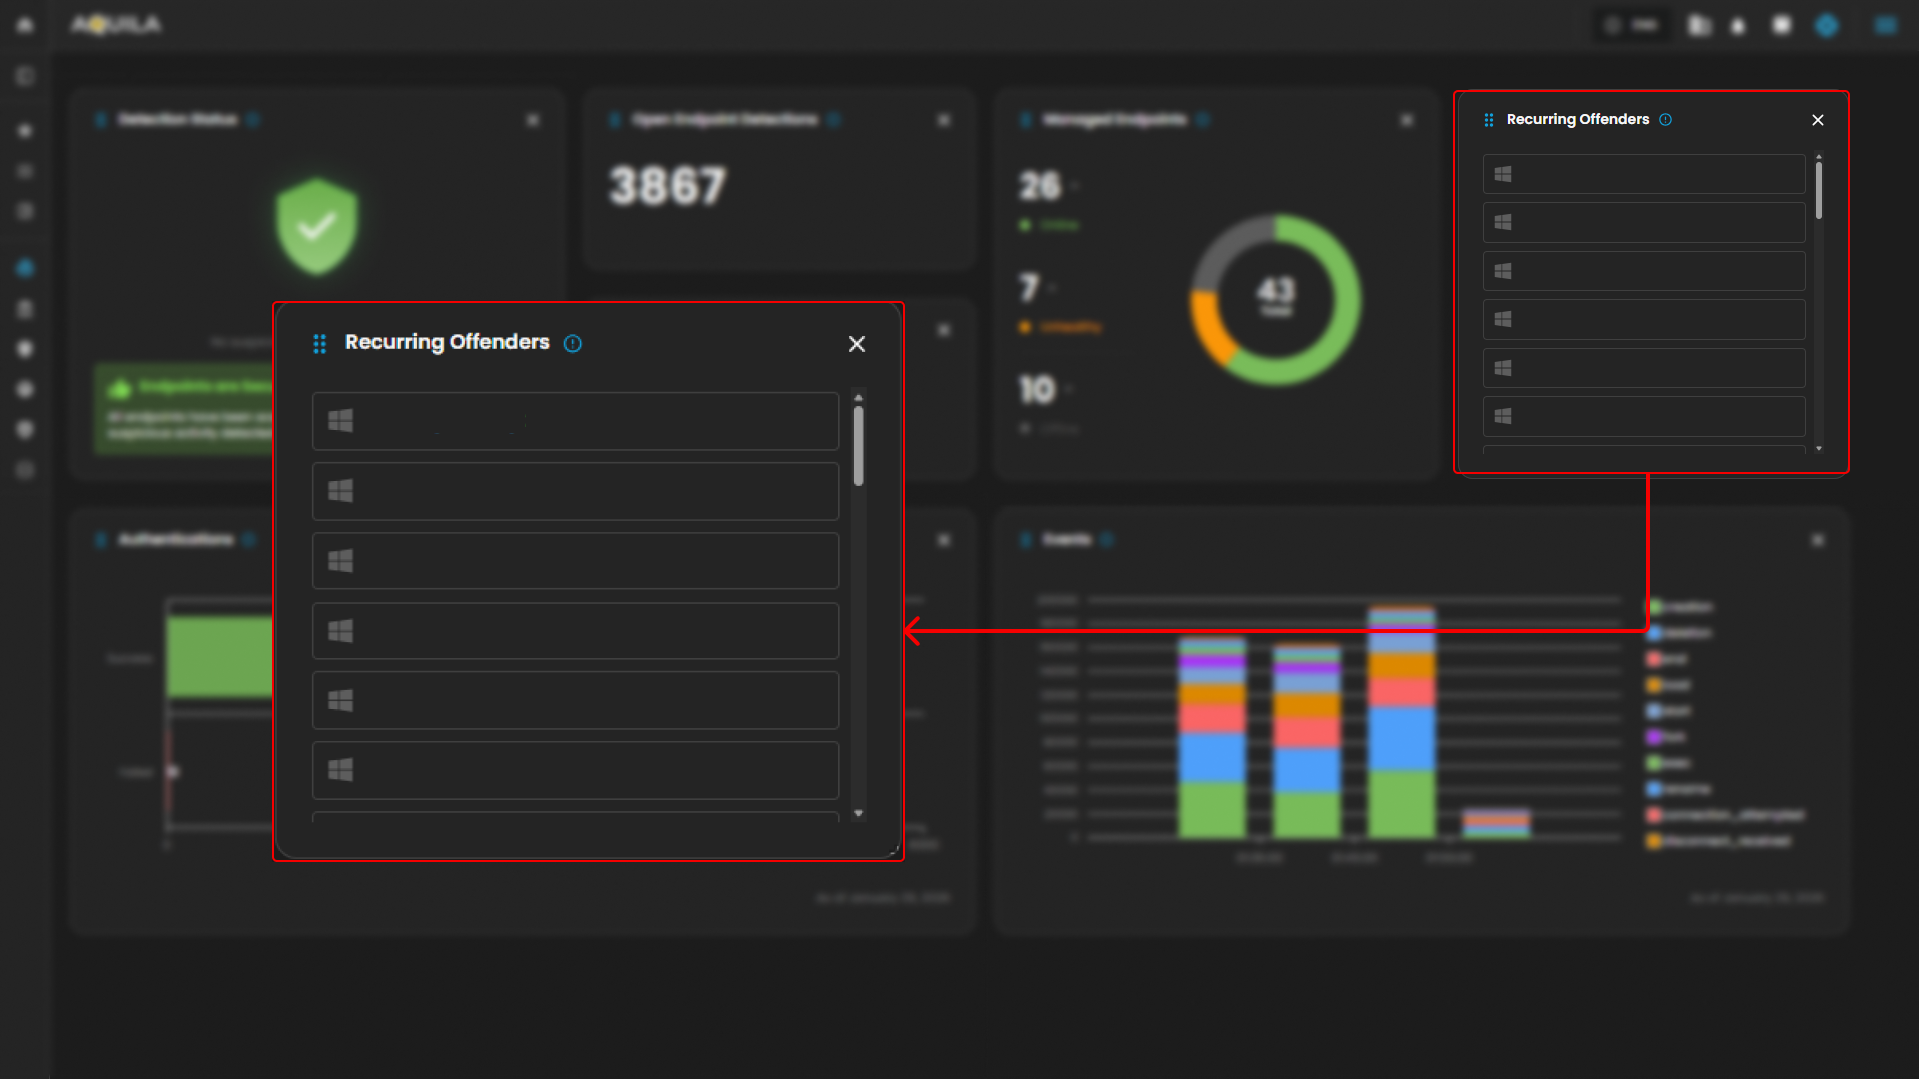
Recurring Offenders:
-
This widget lists any repeated offenders or recurring threats detected across the endpoints. It shows "No Results Found," meaning there are no repeated malicious activities detected at the moment.

-
-
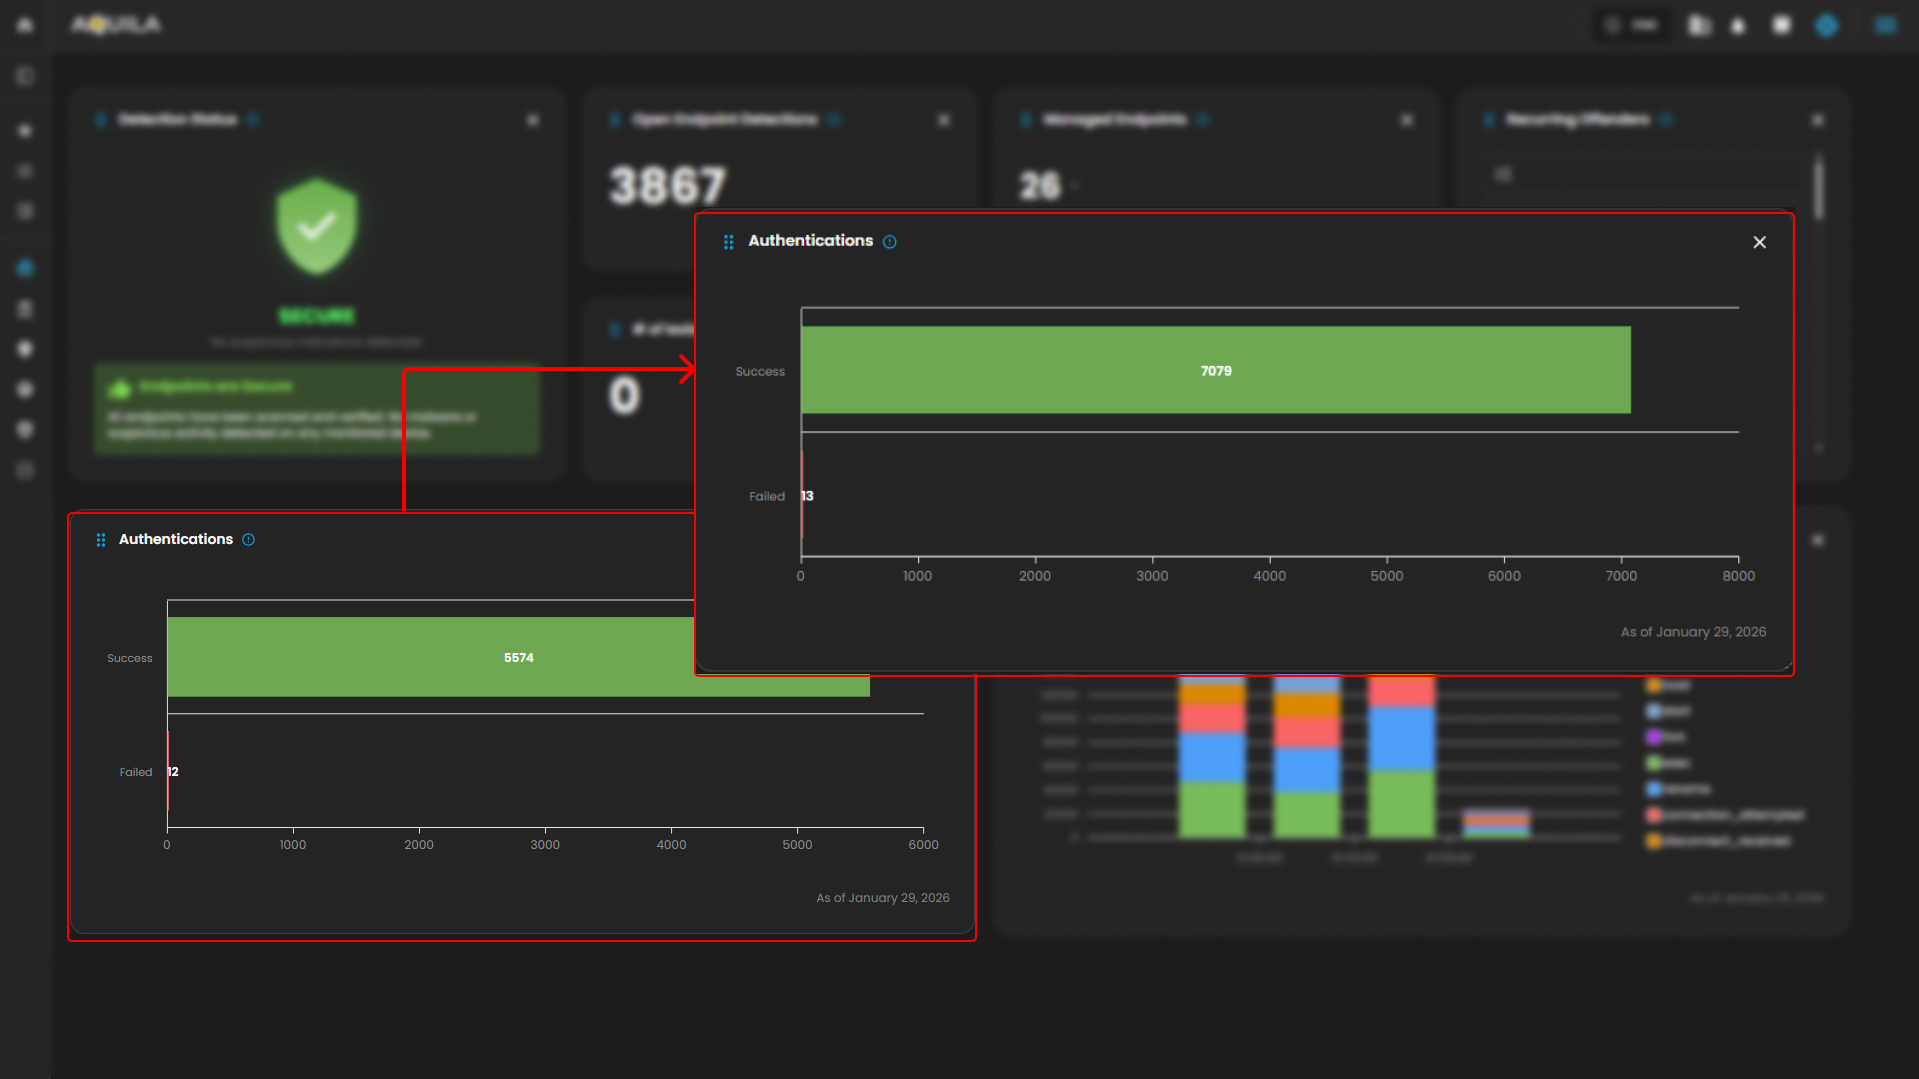
Authentication:
-
Provides a graph showing the number of successful versus failed authentications. As of the latest data, there have been 397 successful authentications and 0 failed attempts, suggesting no authentication issues.

-
-
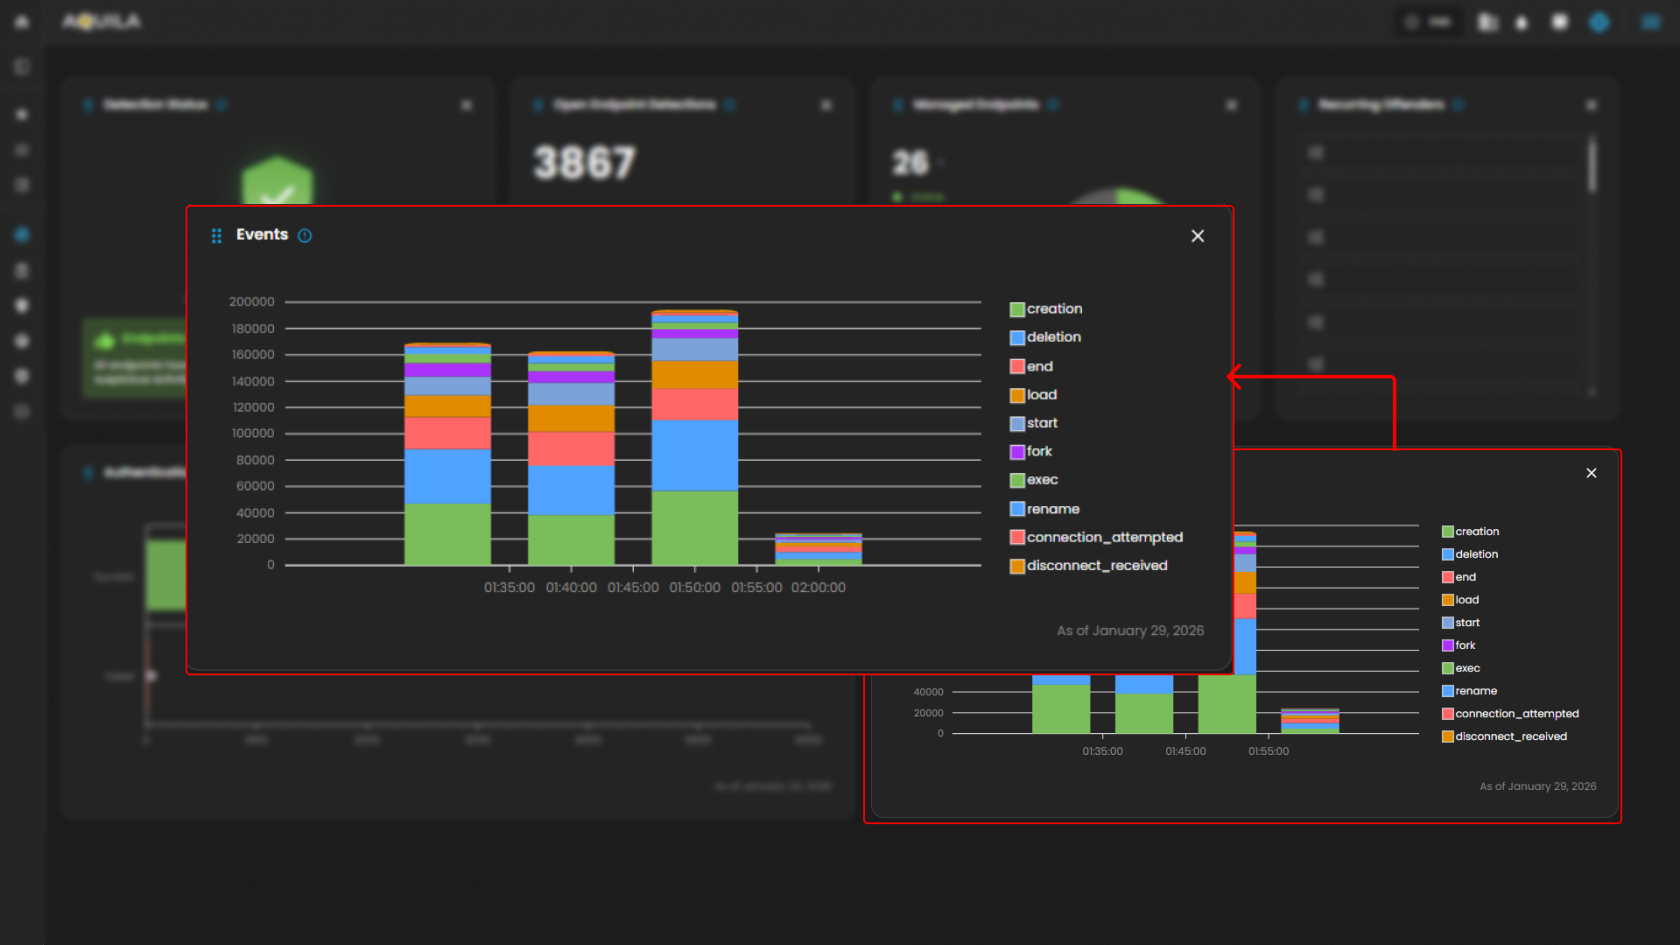
Events:
-
Displays the graphical representation of various system events over time. The chart breaks down different types of events (e.g., "end", "fork", "exec", etc.) that occurred between 08:35 and 09:00. The graph shows how these events fluctuate over time, with certain actions peaking during specific periods.
-


Detections
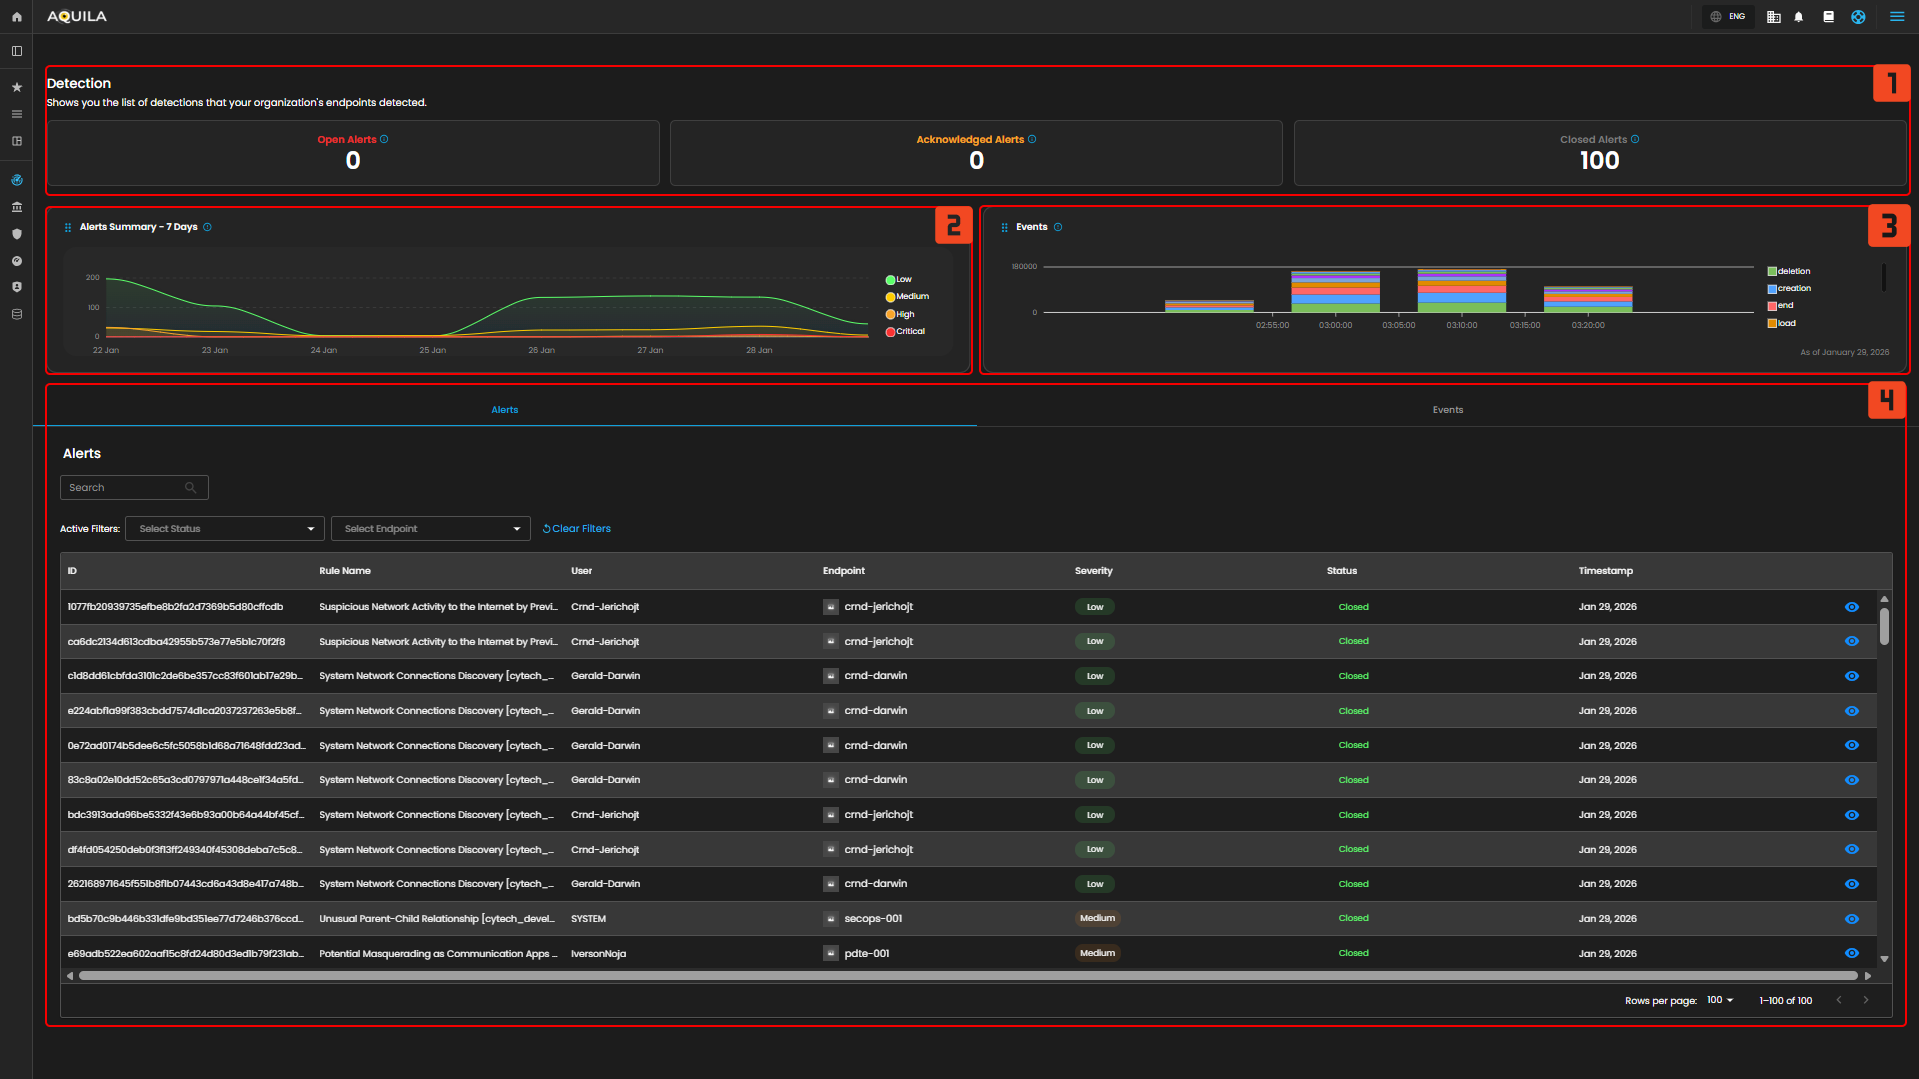
In the Detections, you can manage and analyze all detection and alert data. It includes an overview of open, closed, and acknowledged alerts, event activity trends, and detailed alerts with filtering capabilities.
-
Detections
-
Open Alerts and Acknowledged Alerts give you a quick overview of the current alerts that are either unresolved or acknowledged by users. As of now, there are no open or acknowledged alerts.
-
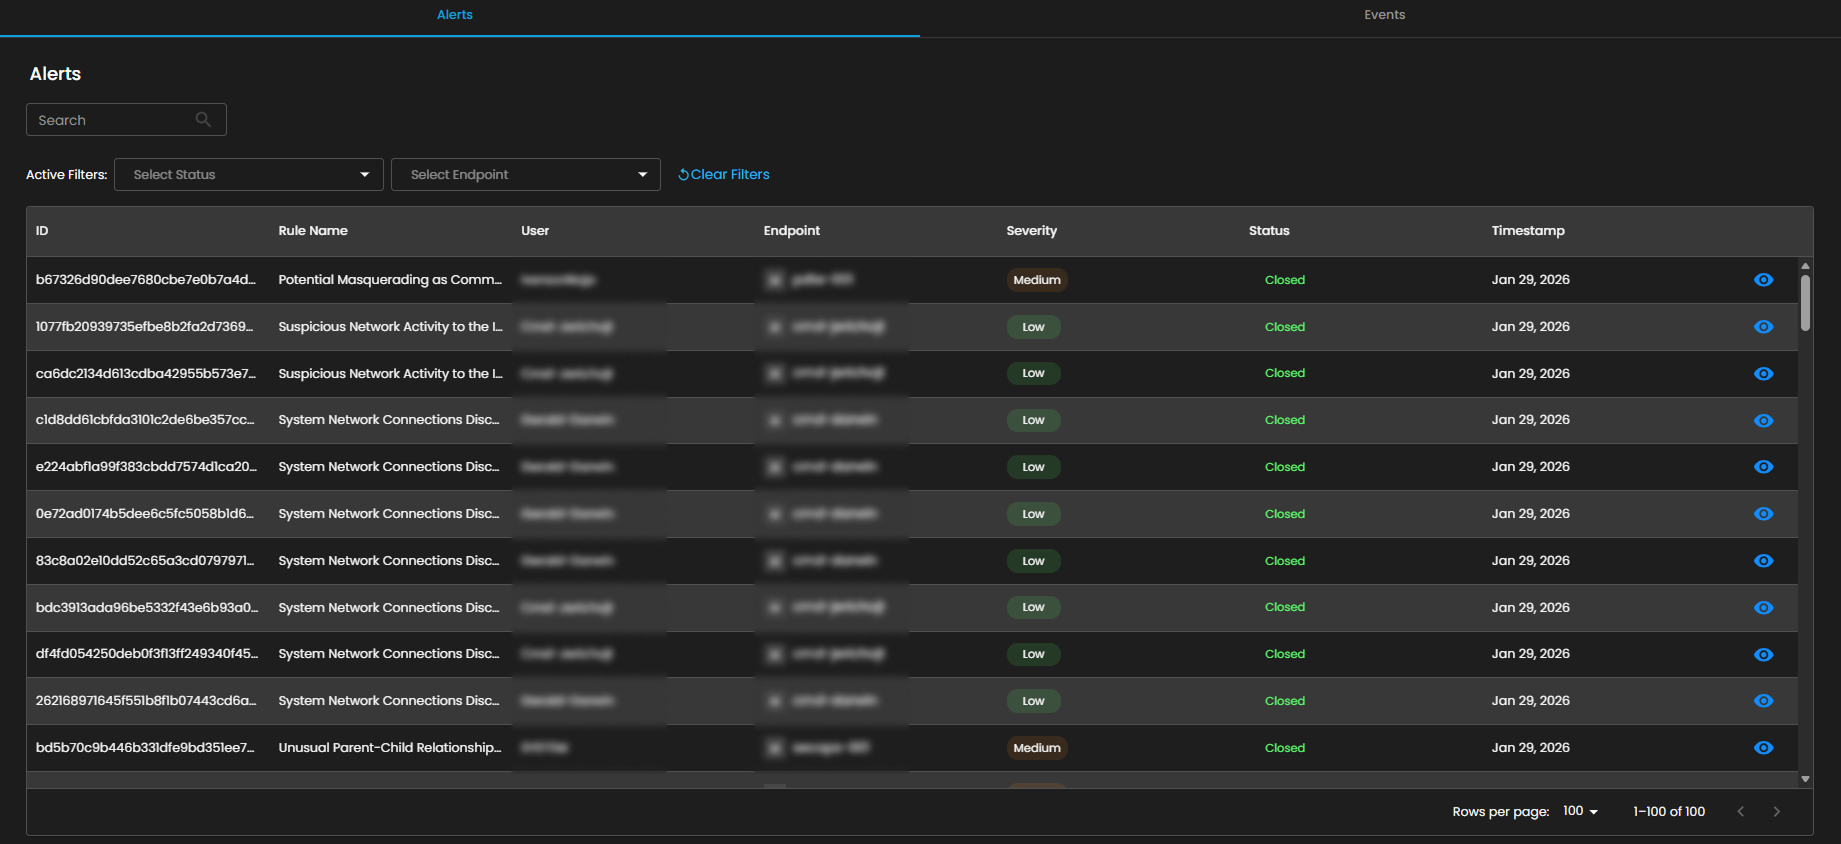
- Alert Summary
-
The Alerts Summary - 7 Days section shows a historical overview of detections from the past week. At the moment, it shows no results, indicating no major alerts have been triggered recently.

-
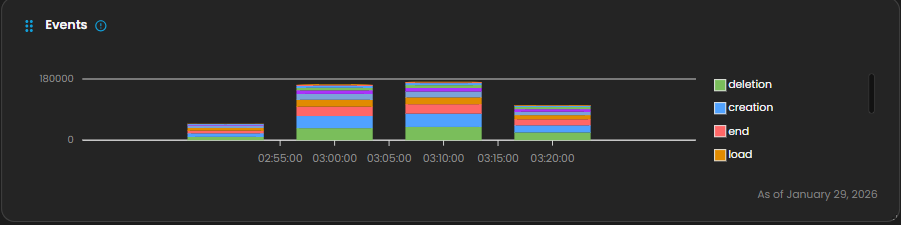
- Events Graph
-
The Events graph visualizes system activity, with each color representing different types of events like “end,” “fork,” “exec,” and “creation.” This graph provides insights into endpoint activity over time, showing fluctuations between 09:00 and 09:45 AM. For example, we can see spikes in events at certain times, allowing you to quickly identify periods of increased activity.

-
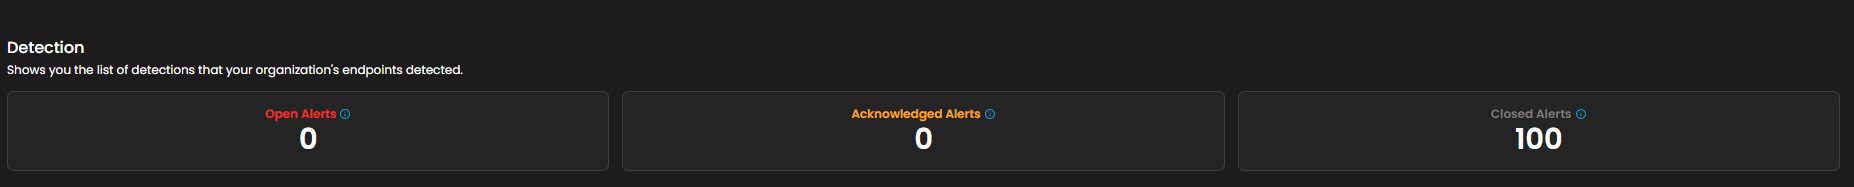
- Alerts Tab
-
The Alerts section allows you to search for specific alerts using the search bar. This feature helps you quickly locate an alert by its ID, user, or rule name.
-
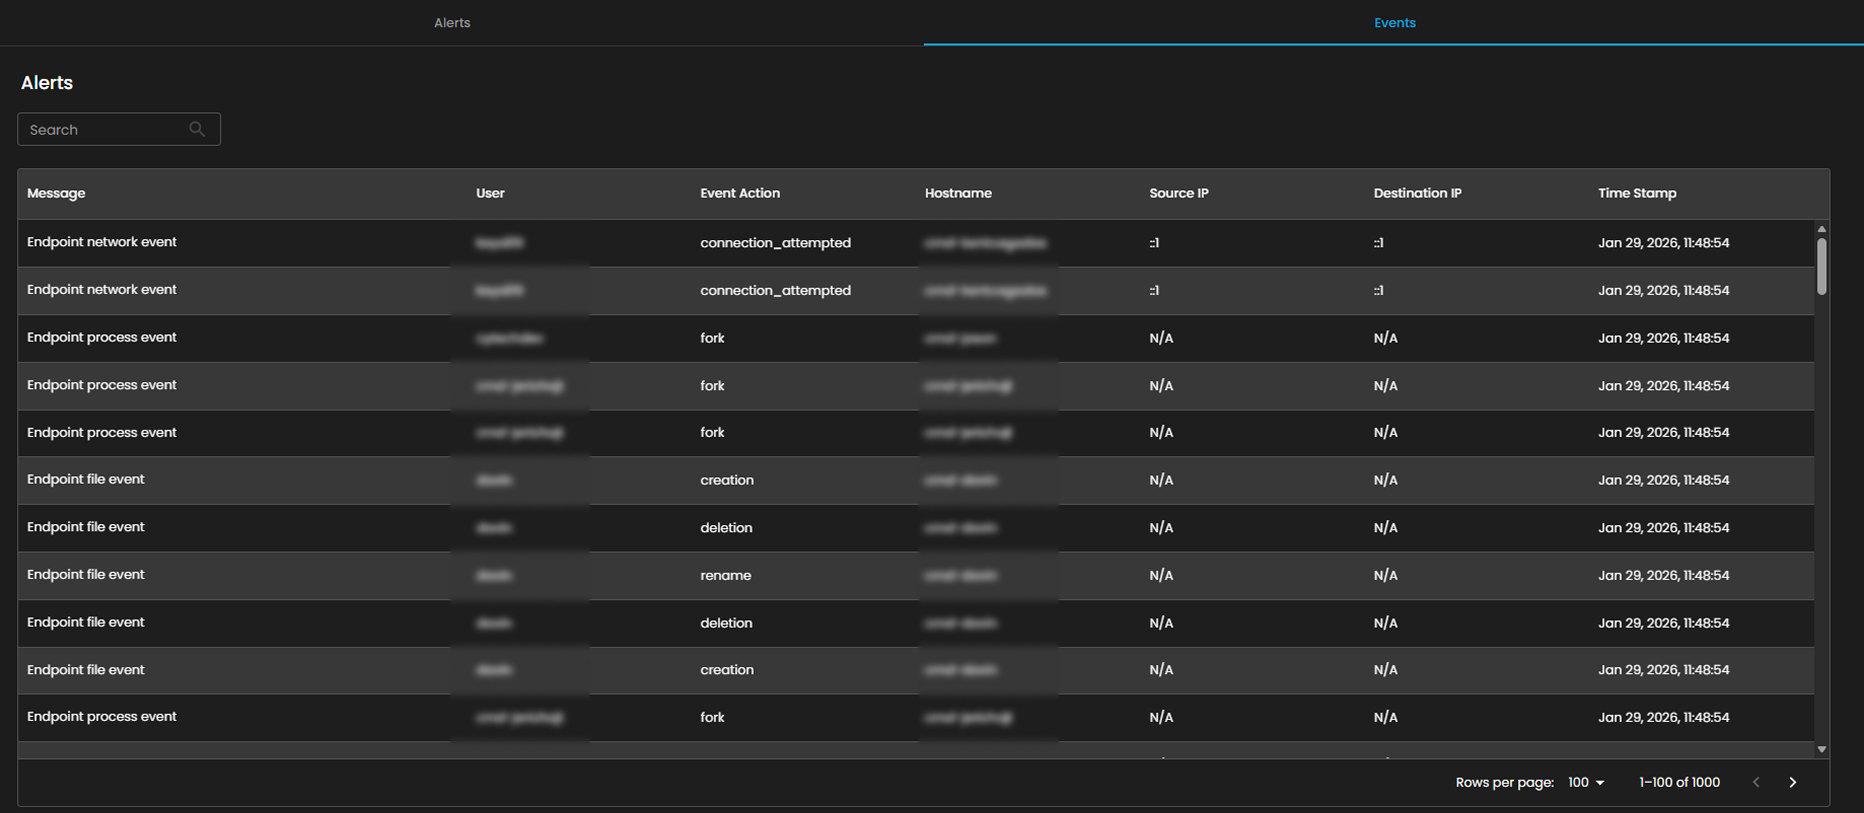
- Events Tab
-
The Events tab contains detailed logs of endpoint process events, including the user, event action, hostname, source and destination IPs, and timestamps. This tab enables you to investigate and track specific activities and behaviors occurring on endpoints.

-
- Activity Filter
- The Active Filters allow you to filter the alerts by status (e.g., open, acknowledged, or closed) and endpoint. You can clear any applied filters with the “Clear Filters” button.

- The Active Filters allow you to filter the alerts by status (e.g., open, acknowledged, or closed) and endpoint. You can clear any applied filters with the “Clear Filters” button.


Endpoints
In the Endpoints Page, you can view a general summary of organization’s endpoint security status. This includes metrics such as secured, infected, and isolated endpoints. As of now, there are no infected or isolated endpoints in the system.
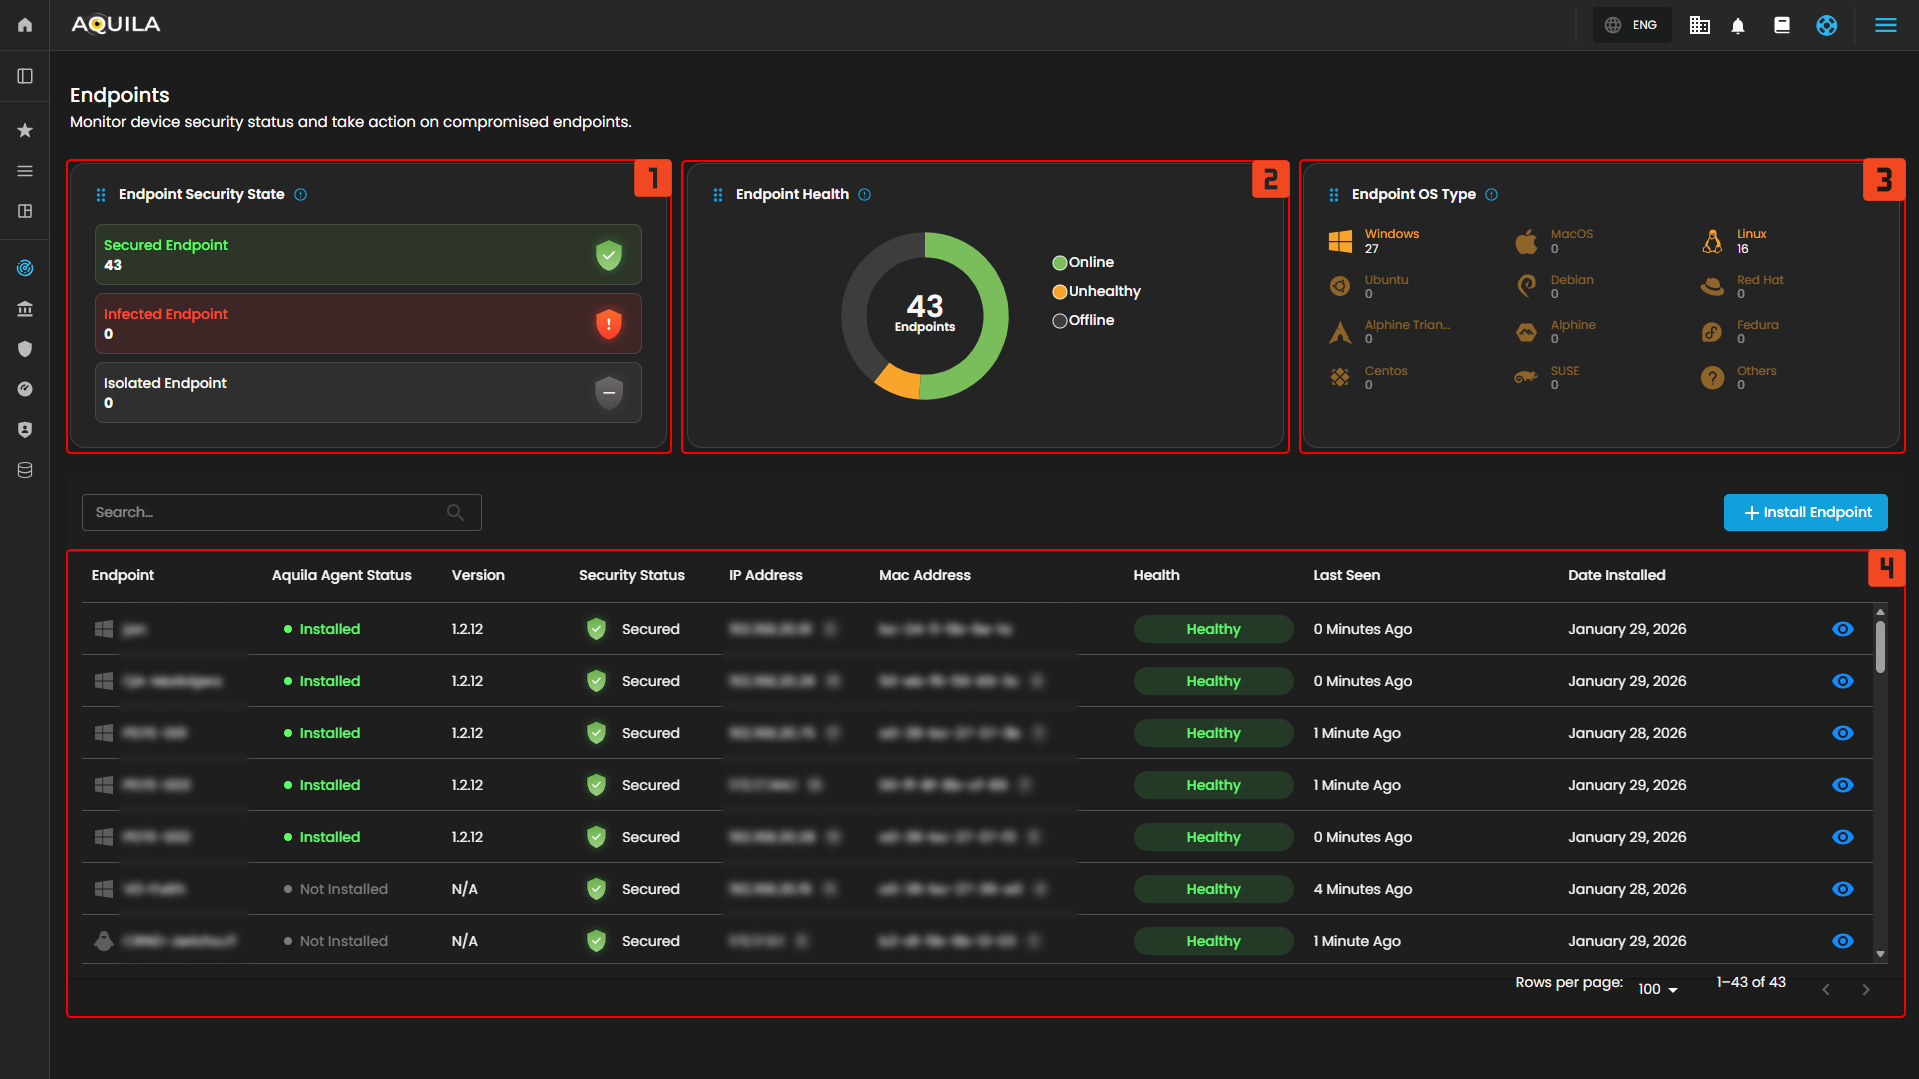
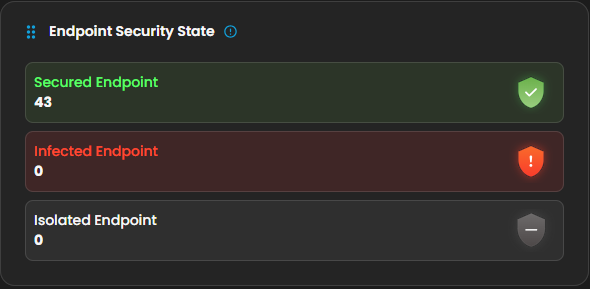
- Endpoint Security State
- This section provides a summary of the security state of endpoints. It displays the count of endpoints that are secured, infected, and isolated. At the moment, there are 2 secured endpoints, with no infected or isolated endpoints.

- This section provides a summary of the security state of endpoints. It displays the count of endpoints that are secured, infected, and isolated. At the moment, there are 2 secured endpoints, with no infected or isolated endpoints.
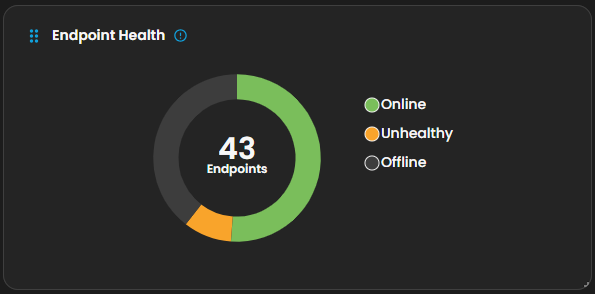
- Endpoint Health Overview
- The Endpoint Health section gives a snapshot of the health status of organization’s endpoints. It shows whether an endpoint is healthy, unhealthy, or offline. Currently, 2 endpoints are listed, with 1 healthy and 1 offline.
- The Endpoint Health section gives a snapshot of the health status of organization’s endpoints. It shows whether an endpoint is healthy, unhealthy, or offline. Currently, 2 endpoints are listed, with 1 healthy and 1 offline.
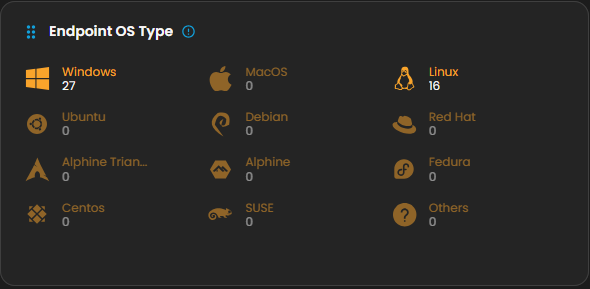
- Endpoint OS Type Distribution
- This section breaks down the operating system types of the endpoints across the network. It helps identify the diversity of operating systems in organization. For instance, 1 endpoint is running Windows, and another is using Linux.

- This section breaks down the operating system types of the endpoints across the network. It helps identify the diversity of operating systems in organization. For instance, 1 endpoint is running Windows, and another is using Linux.
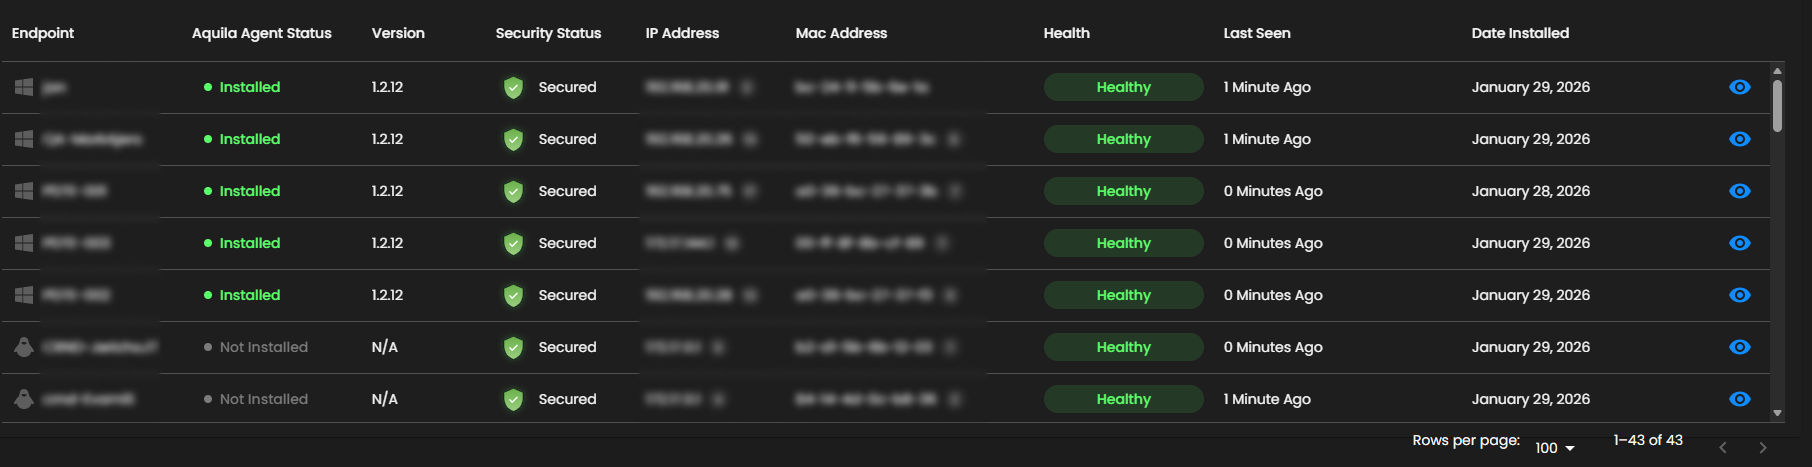
- Endpoint List
- The Endpoint List section shows detailed information about each endpoint within a network. This includes the endpoint name, security status, IP address, MAC address, version, health status, and when it was last seen. At the moment, there are no alerts for compromised or unhealthy endpoints.

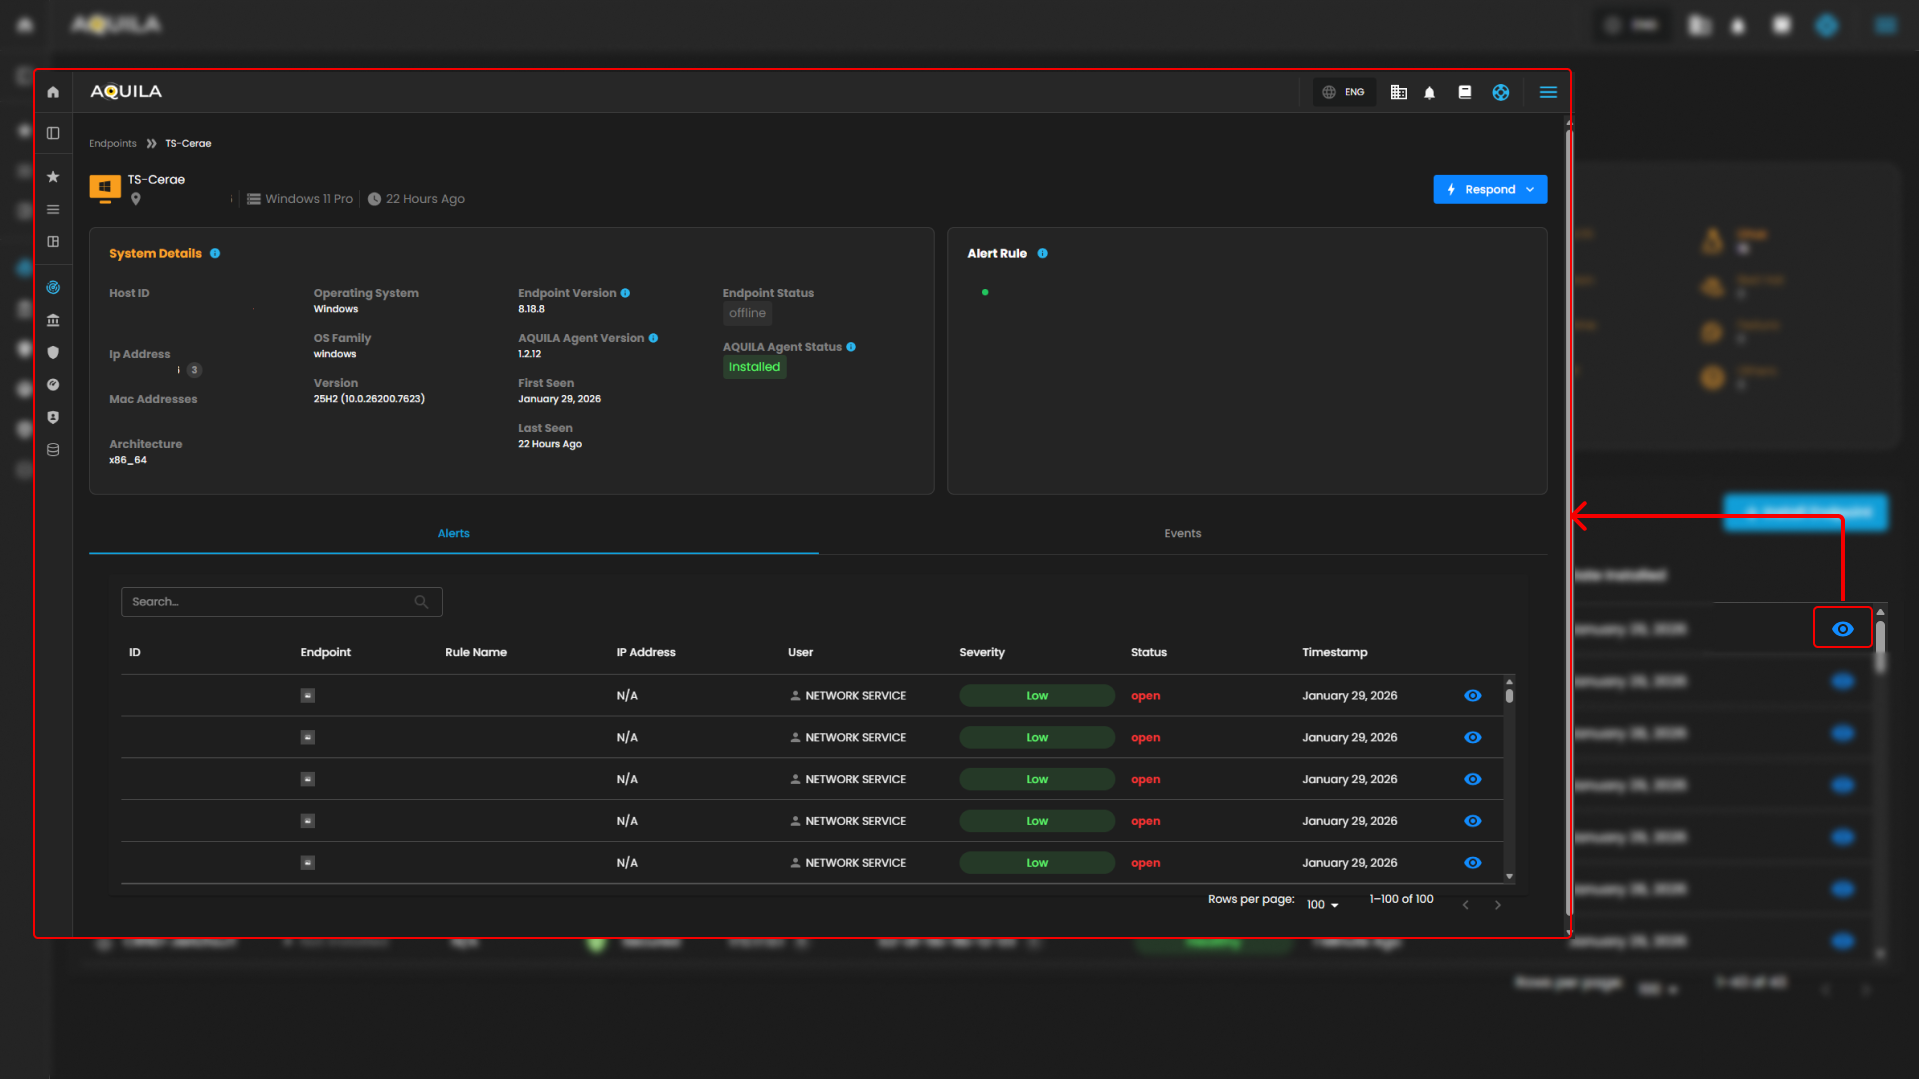
The client can also access further information if they press the eye icon, which is located at the right side of a specific endpoint on the list.
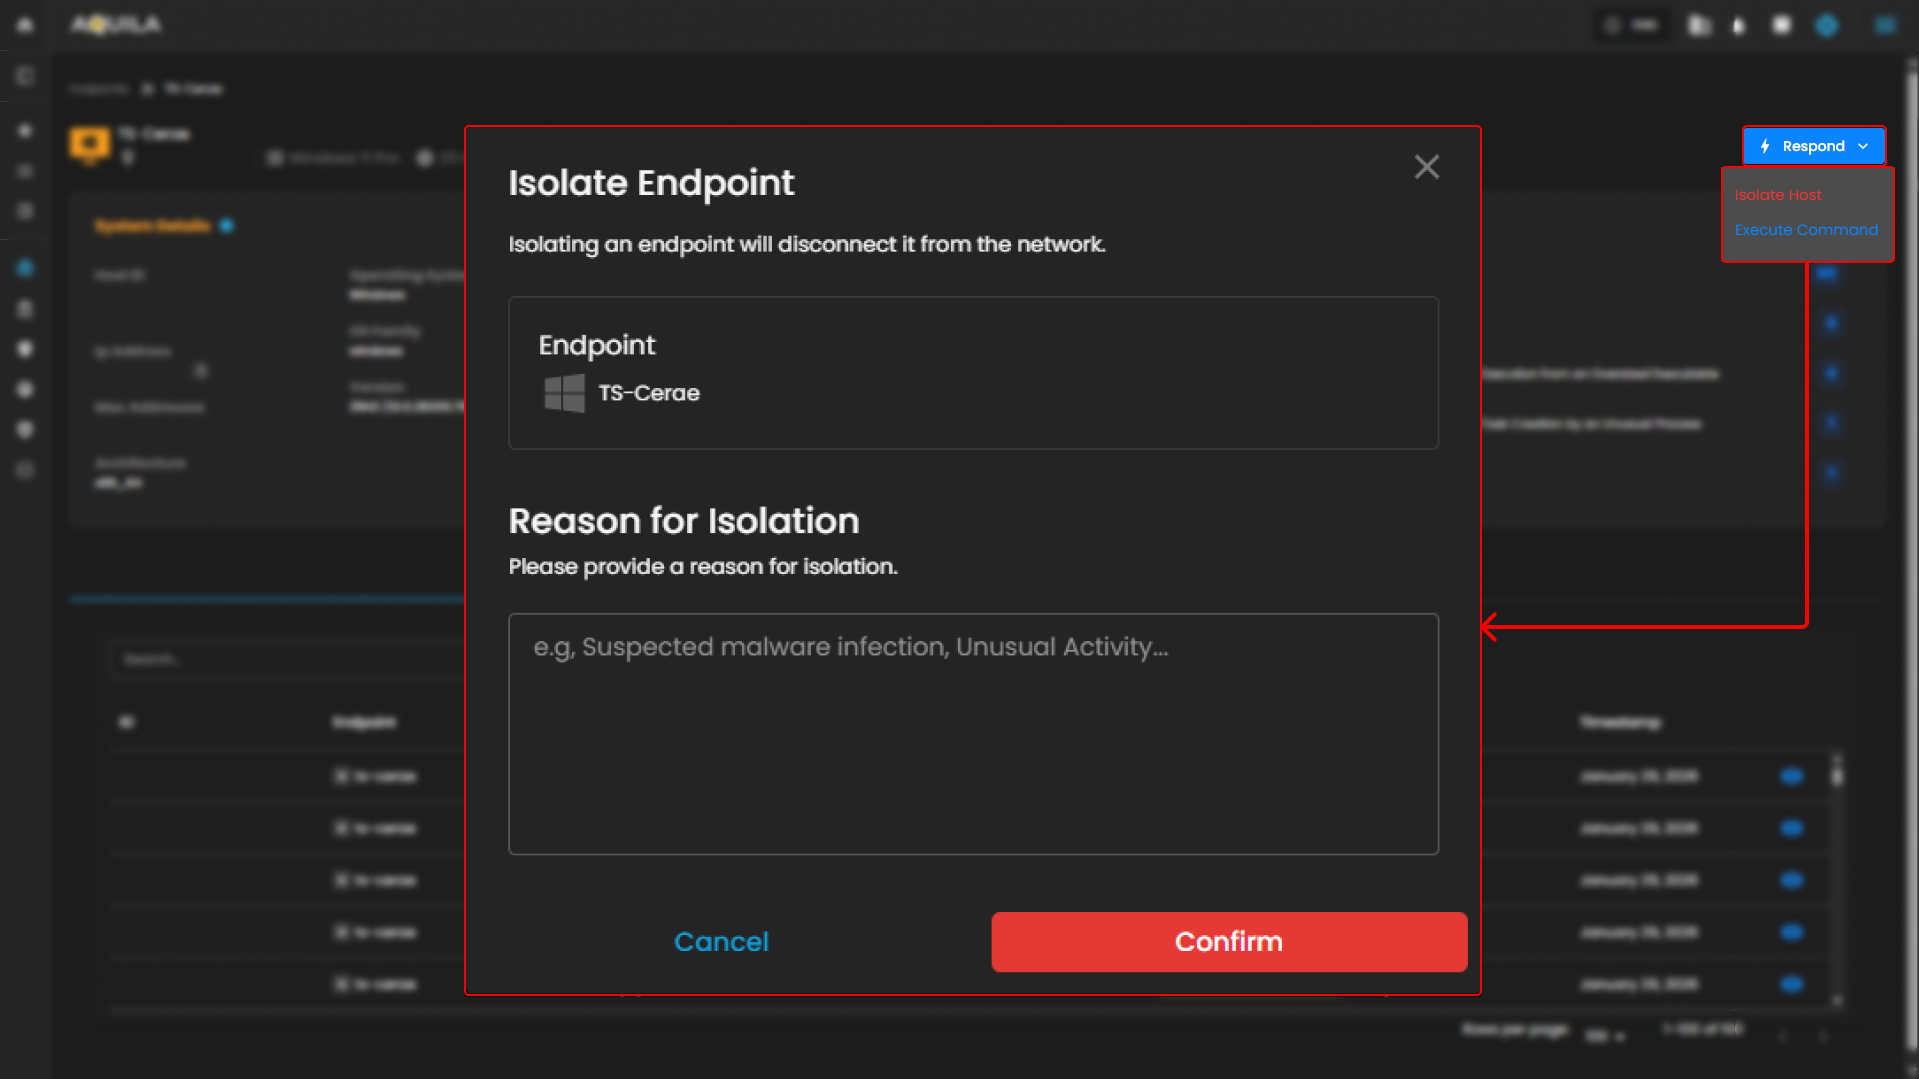
The client can select Respond button to isolate the host or initiate a command prompt. In this section when pressing the Isolate Host, a window will pop up asking for a Reason for Isolation.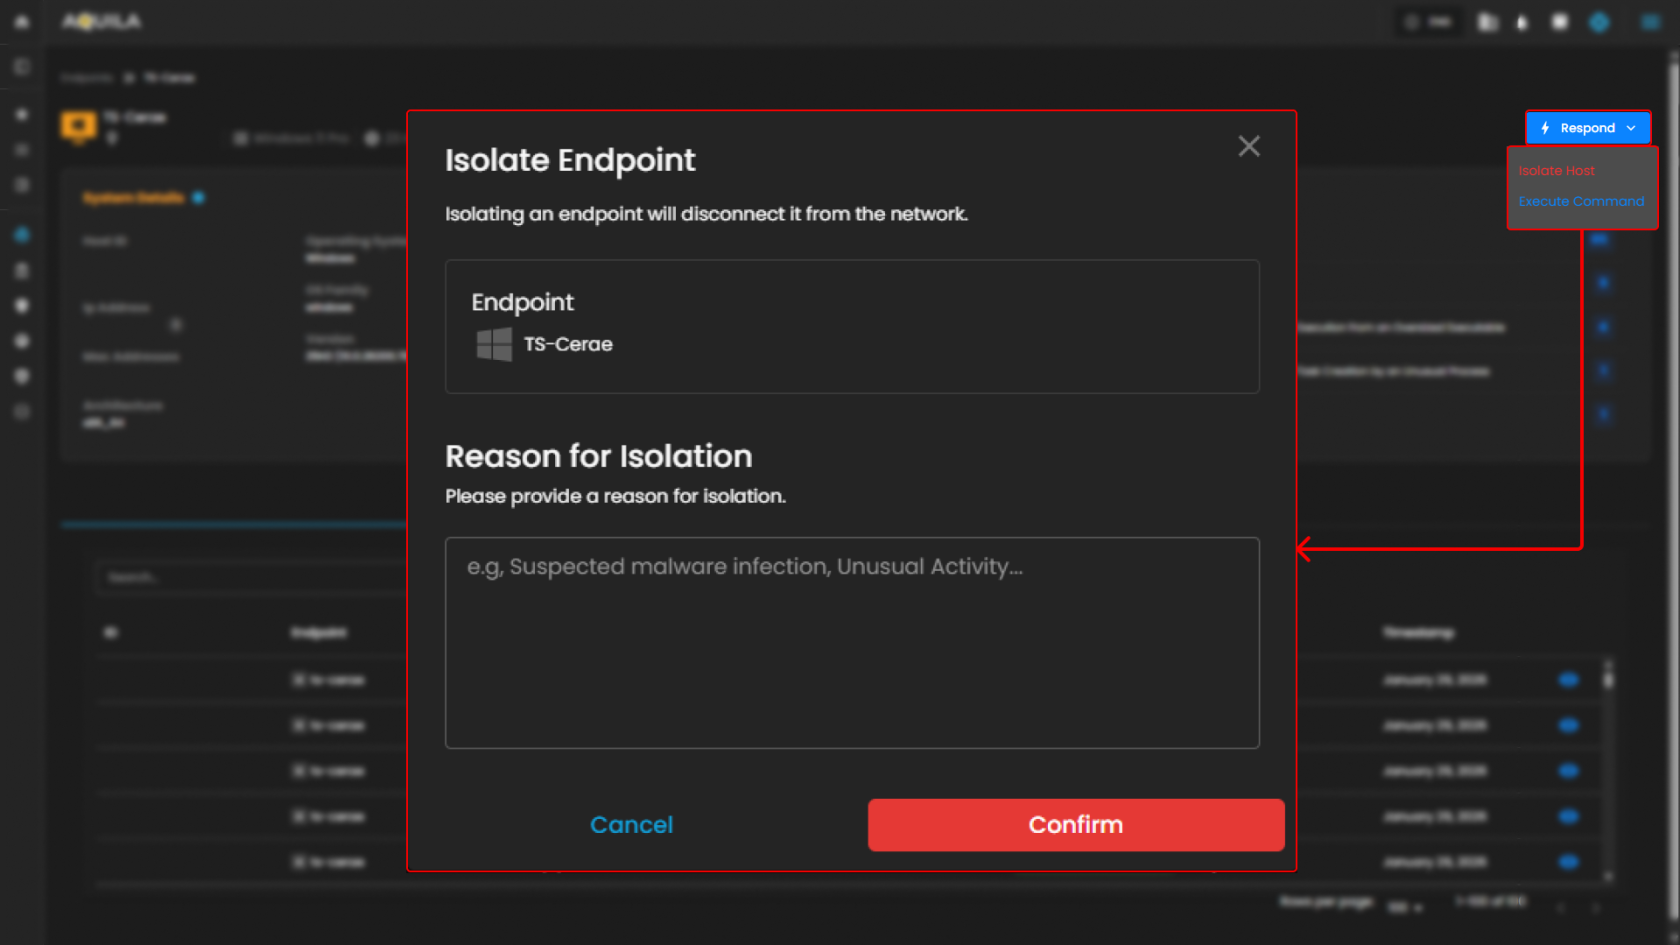
In this section, the Administrator can execute a command. The main commands are Kill Process, Suspend Process, Running Process, Get File, Upload File, Scan.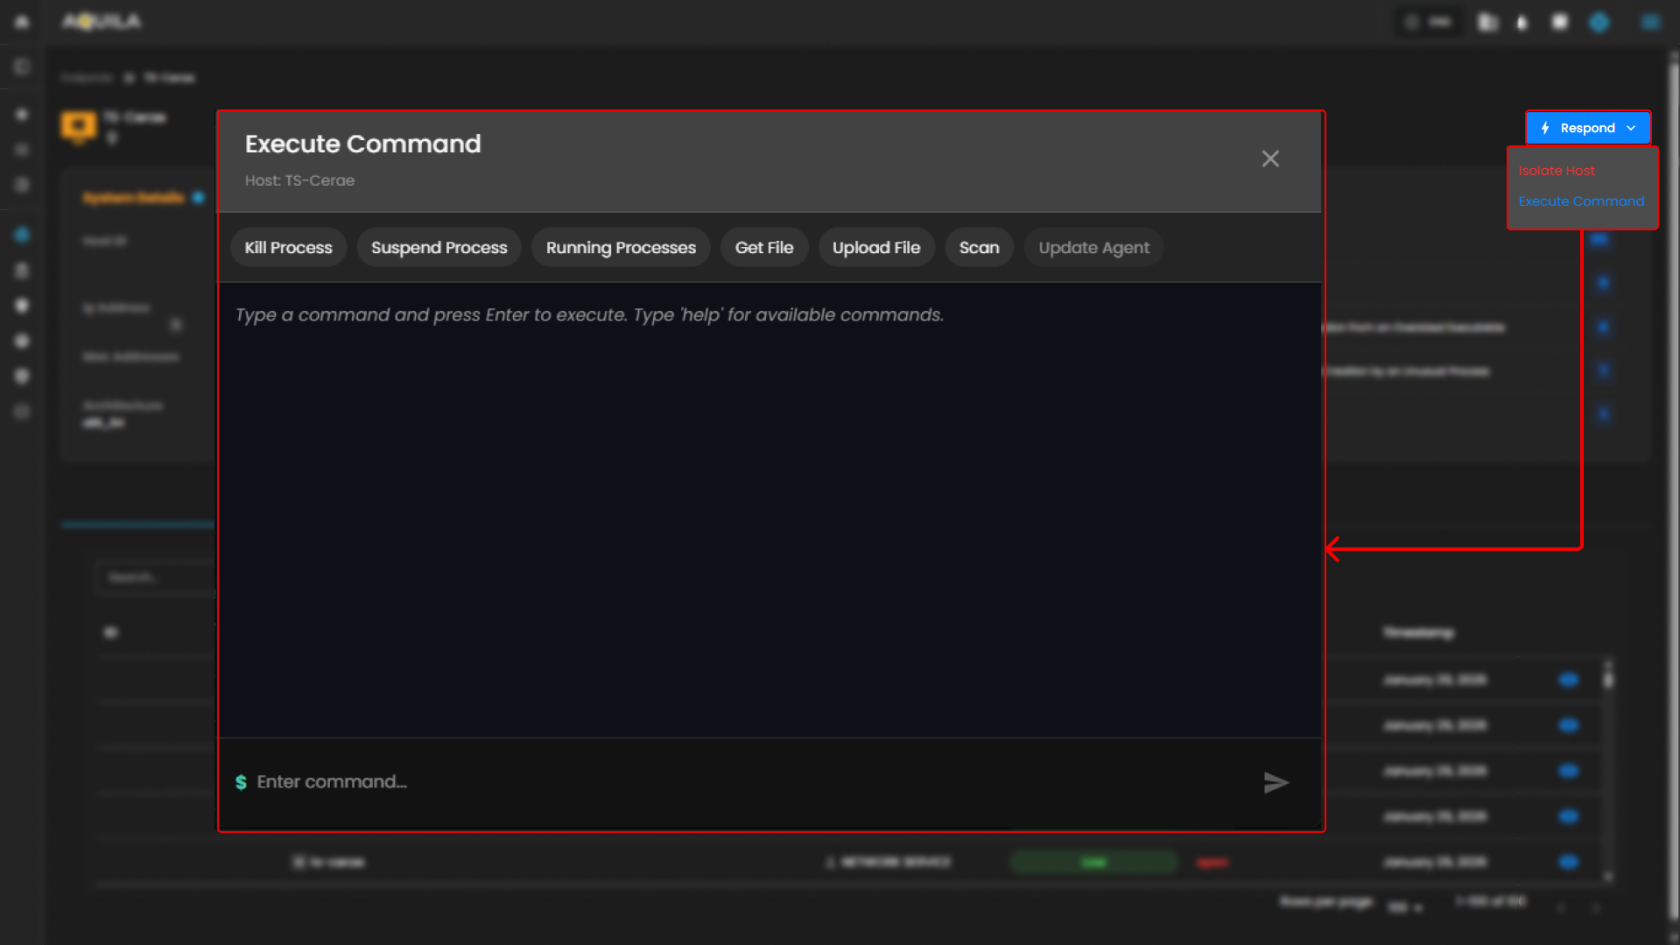
To learn more about Execute Commands, Please Refer to this Link: AQUILA EDR - Execute C... | AQUILA Documentations
- The Endpoint List section shows detailed information about each endpoint within a network. This includes the endpoint name, security status, IP address, MAC address, version, health status, and when it was last seen. At the moment, there are no alerts for compromised or unhealthy endpoints.
- Search Bar
- The Search Bar provides an easy way to quickly search for a specific endpoint by its name, IP address, security status, or health. This helps streamline navigation, especially when dealing with a large number of endpoints.

- The Search Bar provides an easy way to quickly search for a specific endpoint by its name, IP address, security status, or health. This helps streamline navigation, especially when dealing with a large number of endpoints.
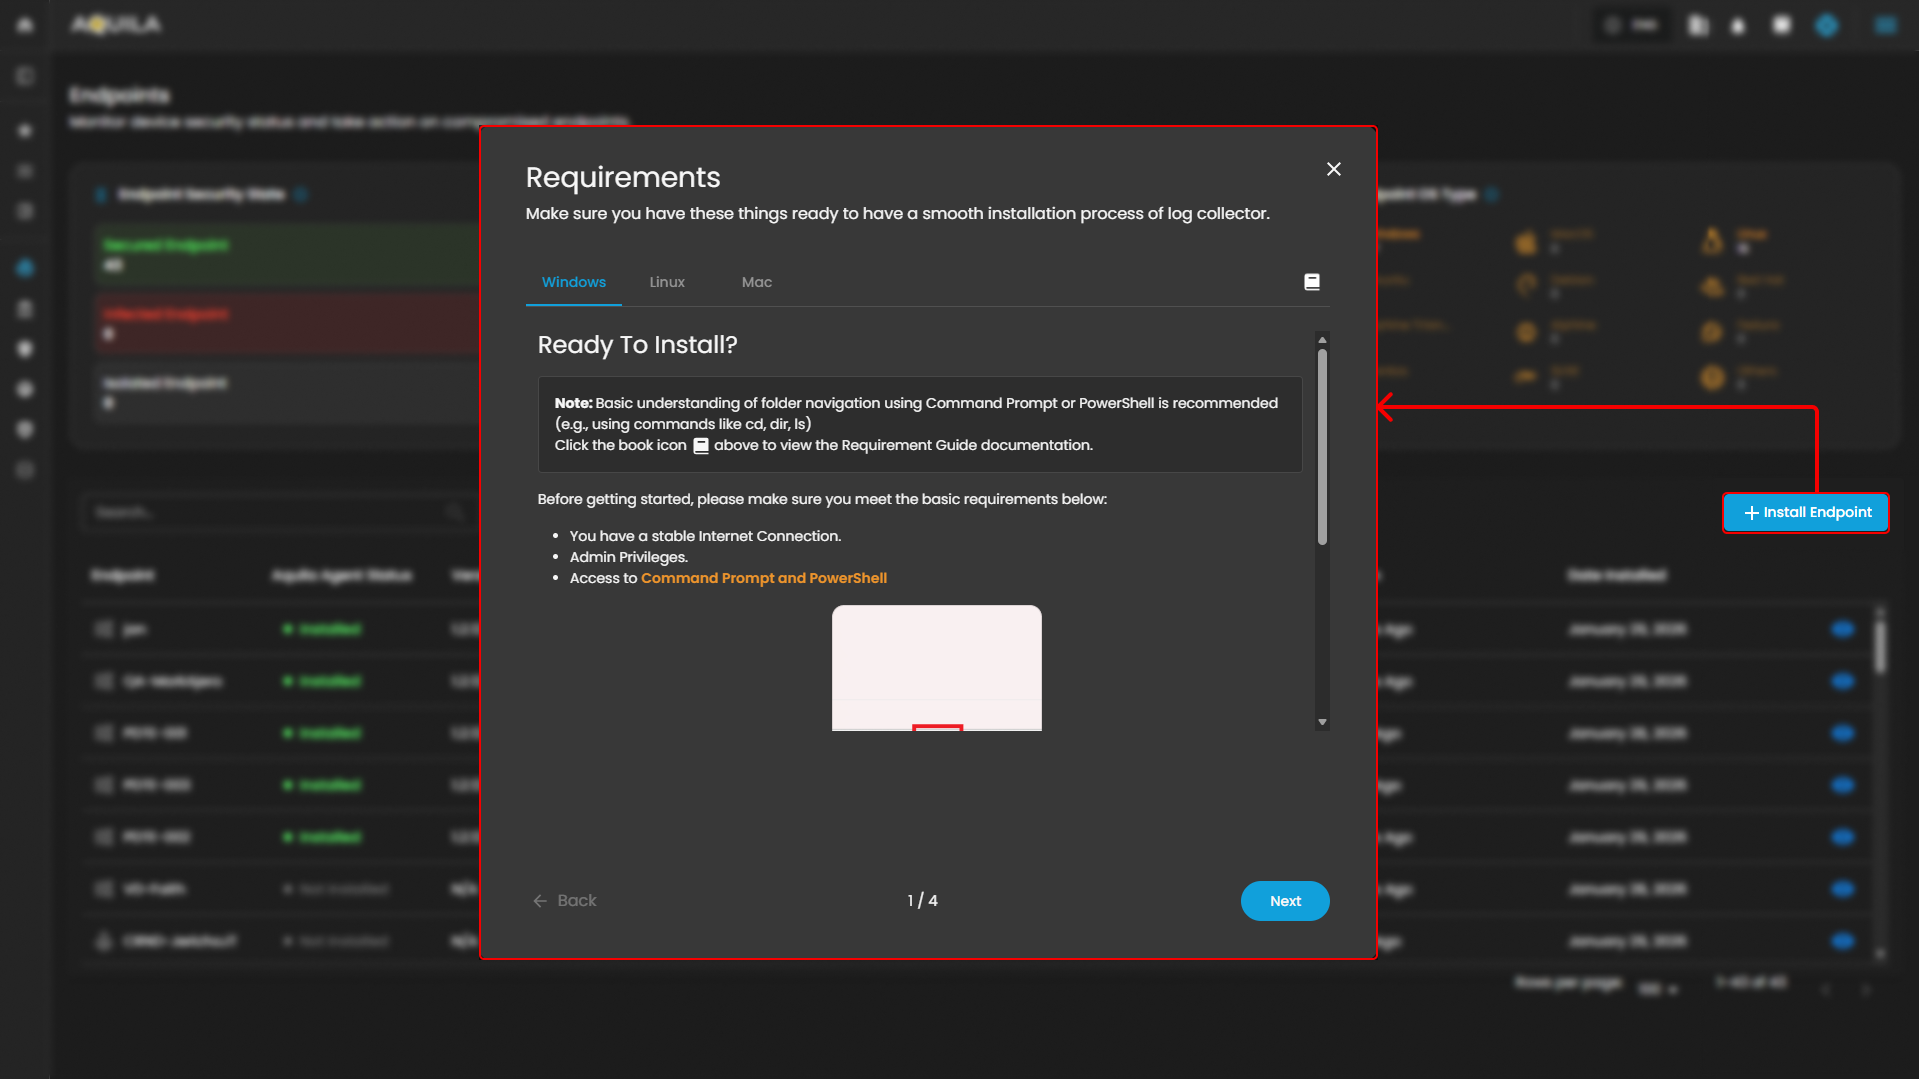
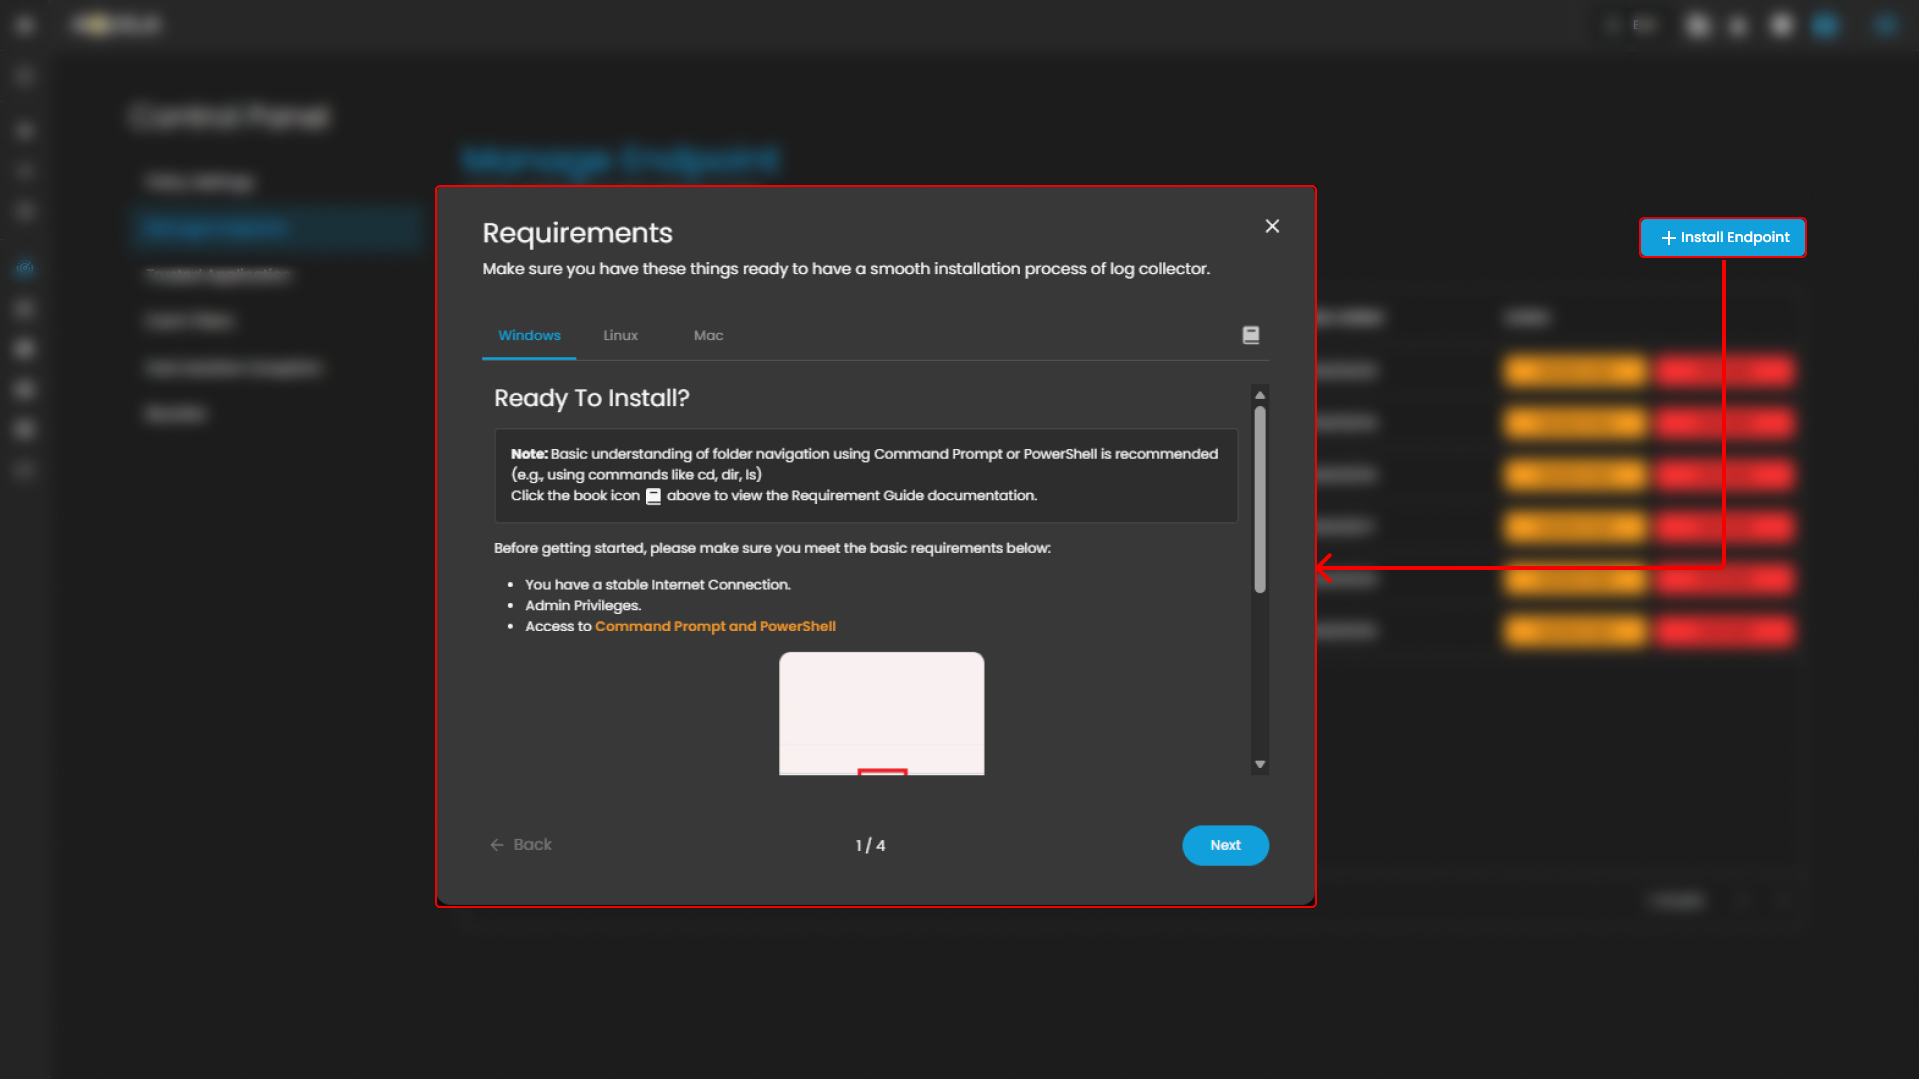
- Install Endpoint
- To add new endpoints to the system, click the Install Endpoint button. This will start the process of onboarding new devices into a network, allowing them to be tracked and secured like the existing endpoints.
- To add new endpoints to the system, click the Install Endpoint button. This will start the process of onboarding new devices into a network, allowing them to be tracked and secured like the existing endpoints.


Control Panel
In the Control Panel, you can manage various security settings and configurations for your organization’s endpoints. This section gives you access to several tools for managing Policies, Manage Endpoints, Trusted Applications, Event Filters, Host Isolation Exception and Blocklist. The control panel helps streamline the process of securing and monitoring endpoints, providing easy access to the most critical settings.
Policy Settings
In the Policy Settings Page, you can view and manage organization’s security policies. This includes configuring protection levels for various types of threats, such as malware, ransomware, memory threats, and malicious behavior. Currently, all protection policies are enabled with options to either detect or prevent these security risks across supported operating systems (Windows, Mac, Linux).
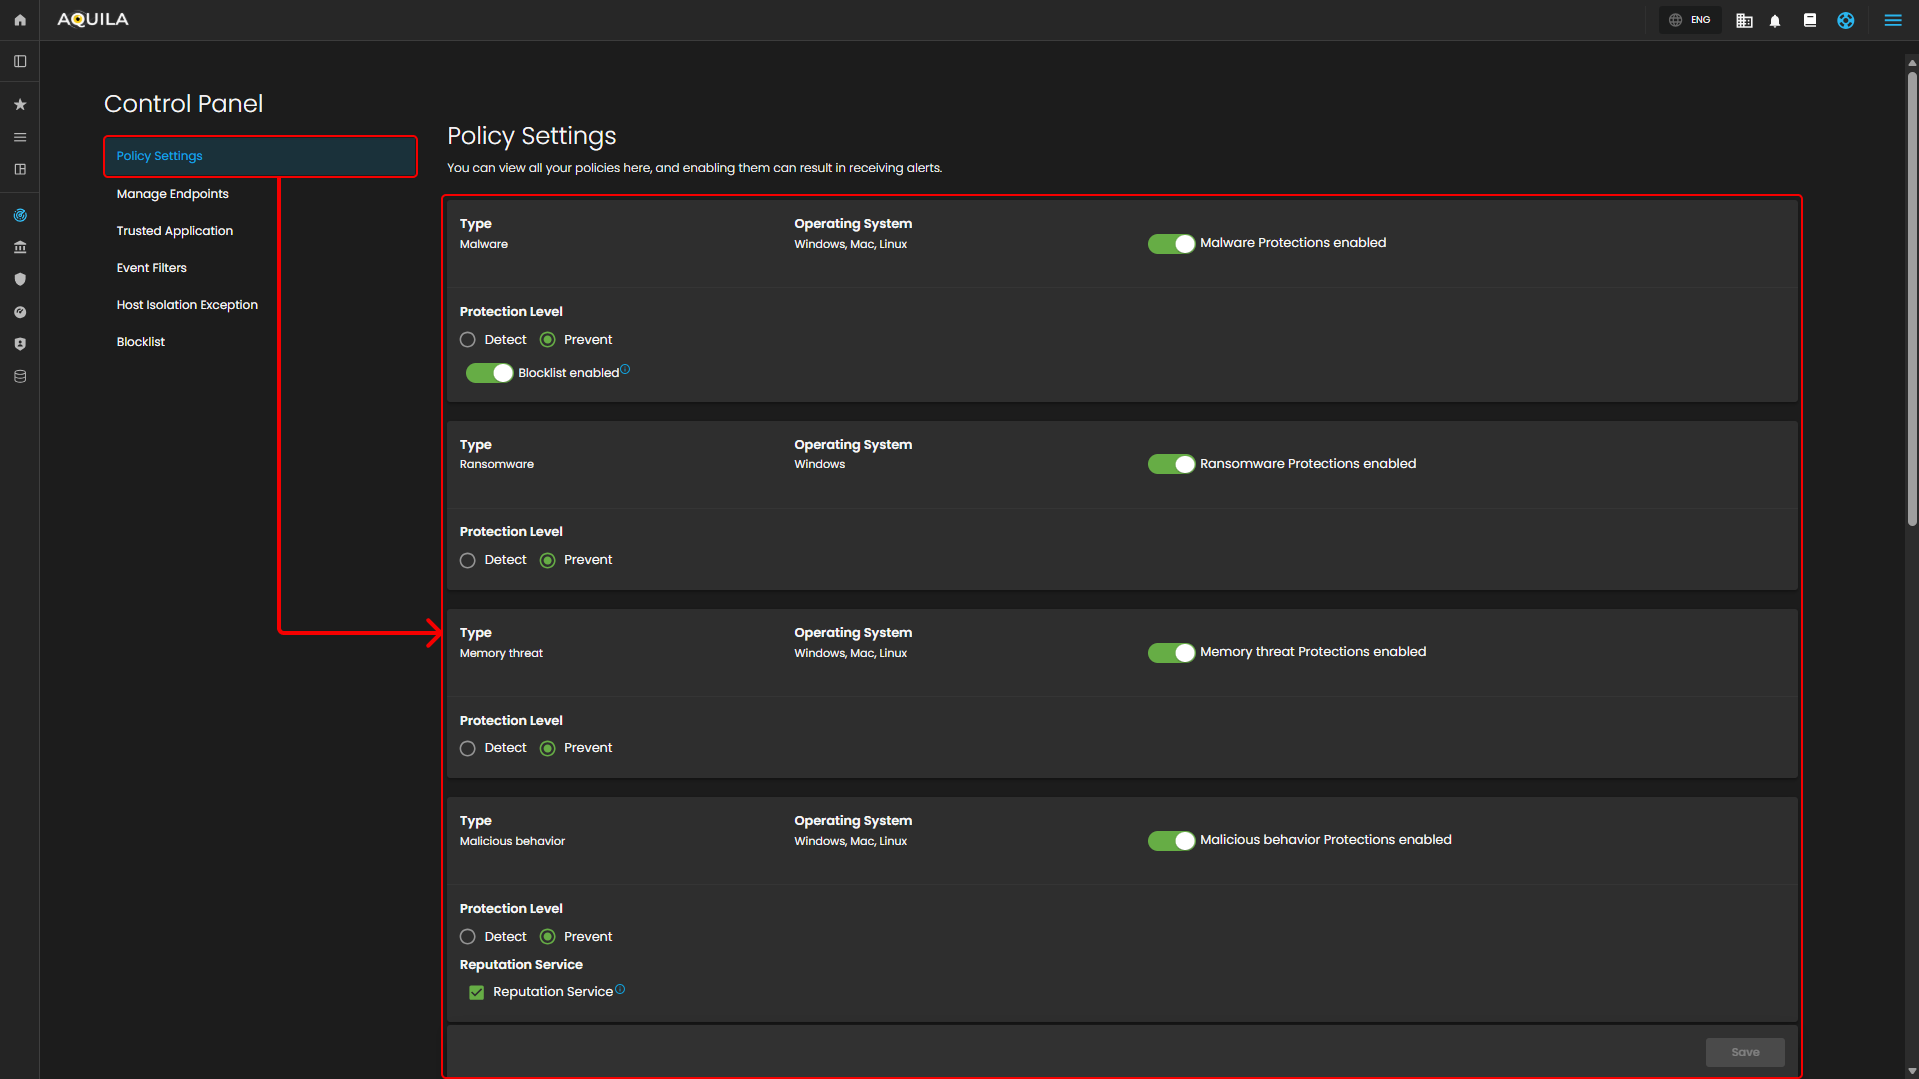
- Policy Settings Overview
- In the Policy Settings section, you can manage and view all the security policies set for your organization's endpoints. This section allows you to control and configure various protection levels for different types of security threats. Policies can be applied to endpoints based on their operating system (Windows, Mac, Linux), and enabling these policies can trigger alerts for the respective security events.
- In the Policy Settings section, you can manage and view all the security policies set for your organization's endpoints. This section allows you to control and configure various protection levels for different types of security threats. Policies can be applied to endpoints based on their operating system (Windows, Mac, Linux), and enabling these policies can trigger alerts for the respective security events.
- Policy Settings Panel
- The Policy Settings Panel displays the different types of protection policies in place for your endpoints. Each policy corresponds to a specific security threat, such as malware, ransomware, memory threats, or malicious behavior. You can configure the protection level for each policy by toggling between Detect and Prevent options. Additionally, a blocklist feature can be enabled or disabled to provide further protection against unwanted software or threats.
-
-
-
Malware Protection: Enabled with options to Detect or Prevent.
-
Ransomware Protection: Enabled for Windows endpoints with Detect or Prevent options.
-
Memory Threat Protection: Enabled for all operating systems (Windows, Mac, Linux) with Detect or Prevent options.
-
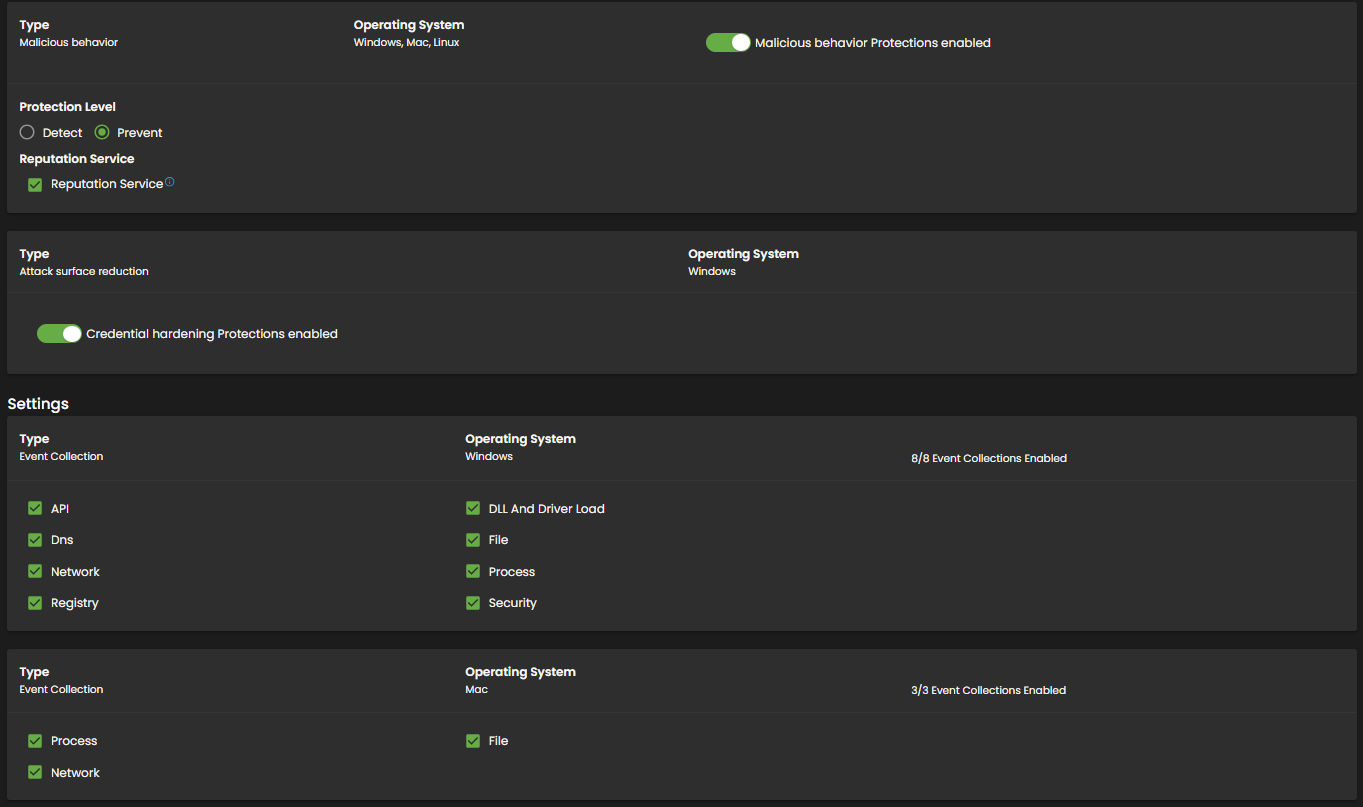
Malicious Behavior Protection: Enabled for all operating systems (Windows, Mac, Linux) with the same detection or prevention options.
-
-
- Each policy has a toggle switch to enable or disable protection for the corresponding threat, and these settings can be easily modified according to your needs.
Manage Endpoints
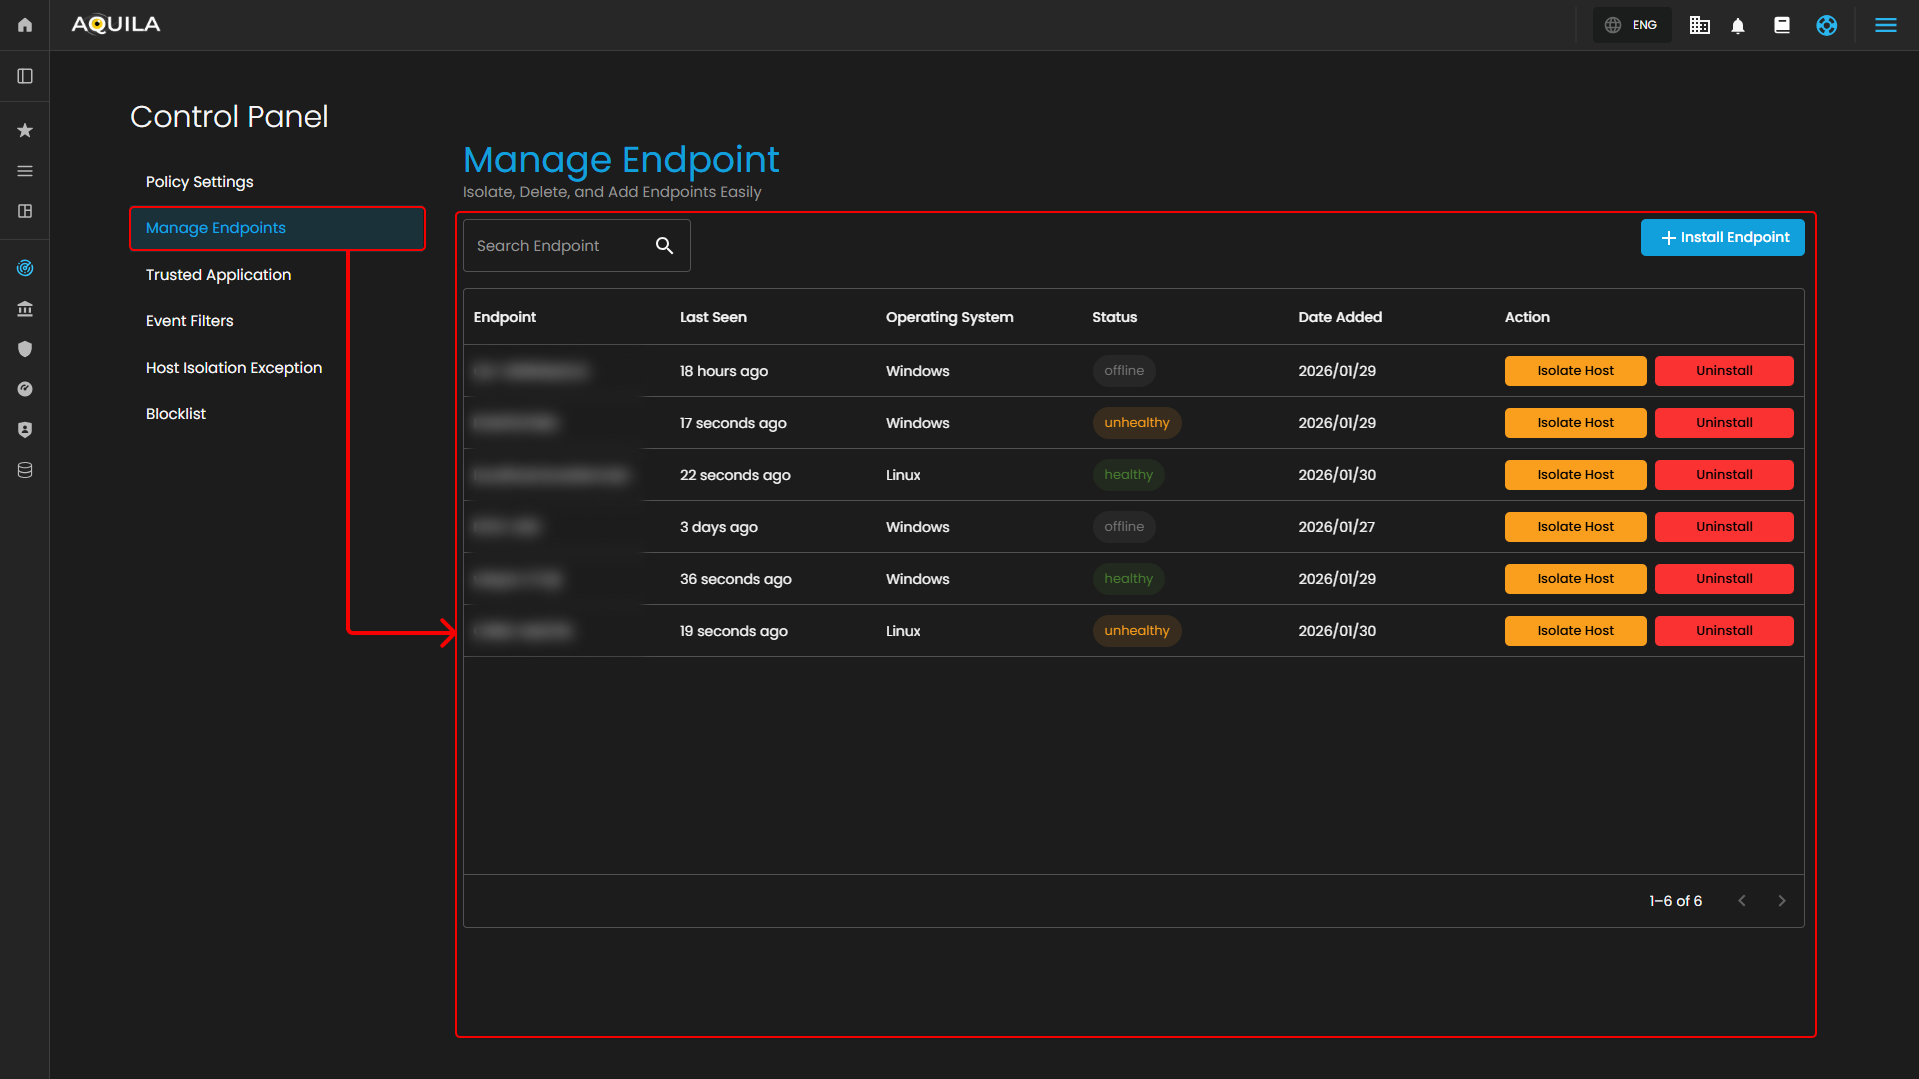
In the Manage Endpoints Page, you can easily isolate, delete, or add new endpoints to your system. This section provides a quick overview of all your endpoints, including details like the endpoint name, last seen time, operating system, and status. Currently, all protection policies are enabled with options to either detect or prevent security risks across the endpoints in your system.
- Manage Endpoints Overview
-
- In the Manage Endpoints Page, you can easily isolate, delete, or add new endpoints to your system. This section provides a quick overview of all your endpoints, including details like the endpoint name, last seen time, operating system, and status.
- In the Manage Endpoints Page, you can easily isolate, delete, or add new endpoints to your system. This section provides a quick overview of all your endpoints, including details like the endpoint name, last seen time, operating system, and status.
- Endpoint List and Actions
- This section displays a list of all endpoints currently in your network. Each endpoint entry shows the following details:
- Endpoint Name: Identifies the device in the system.
- Last Seen: Indicates when the endpoint was last connected to the network.
- Operating System: Displays the OS of the endpoint (e.g., Linux, Windows).
- Status: Shows whether the endpoint is currently online or offline.
- Each endpoint can be acted upon with available options, such as isolating the host (for security reasons) or uninstalling it from the system. Currently, all endpoints listed are marked as offline.
- This section displays a list of all endpoints currently in your network. Each endpoint entry shows the following details:
- Search Endpoint
- The Search Endpoint bar at the top allows you to quickly locate specific endpoints in your system by searching for their names or other attributes.

- The Search Endpoint bar at the top allows you to quickly locate specific endpoints in your system by searching for their names or other attributes.
- Install Endpoint
- To add new endpoints to your network, click the Install Endpoint button. This will allow you to initiate the process of registering new devices to be tracked and managed within your system.

- To add new endpoints to your network, click the Install Endpoint button. This will allow you to initiate the process of registering new devices to be tracked and managed within your system.

Trusted Application Page
In the Trusted Application Page, you can see an overview of your organization's trusted applications. This section includes the names of the applications, their descriptions, and the last updated time. Currently, there are several trusted applications listed, such as "AQUILA Agent Exception" and "test app2."
- The Trusted Application Overview
- This provides a list of the currently trusted applications along with their descriptions and the most recent updates. These applications are categorized by the name of the application and a brief description of their purpose.
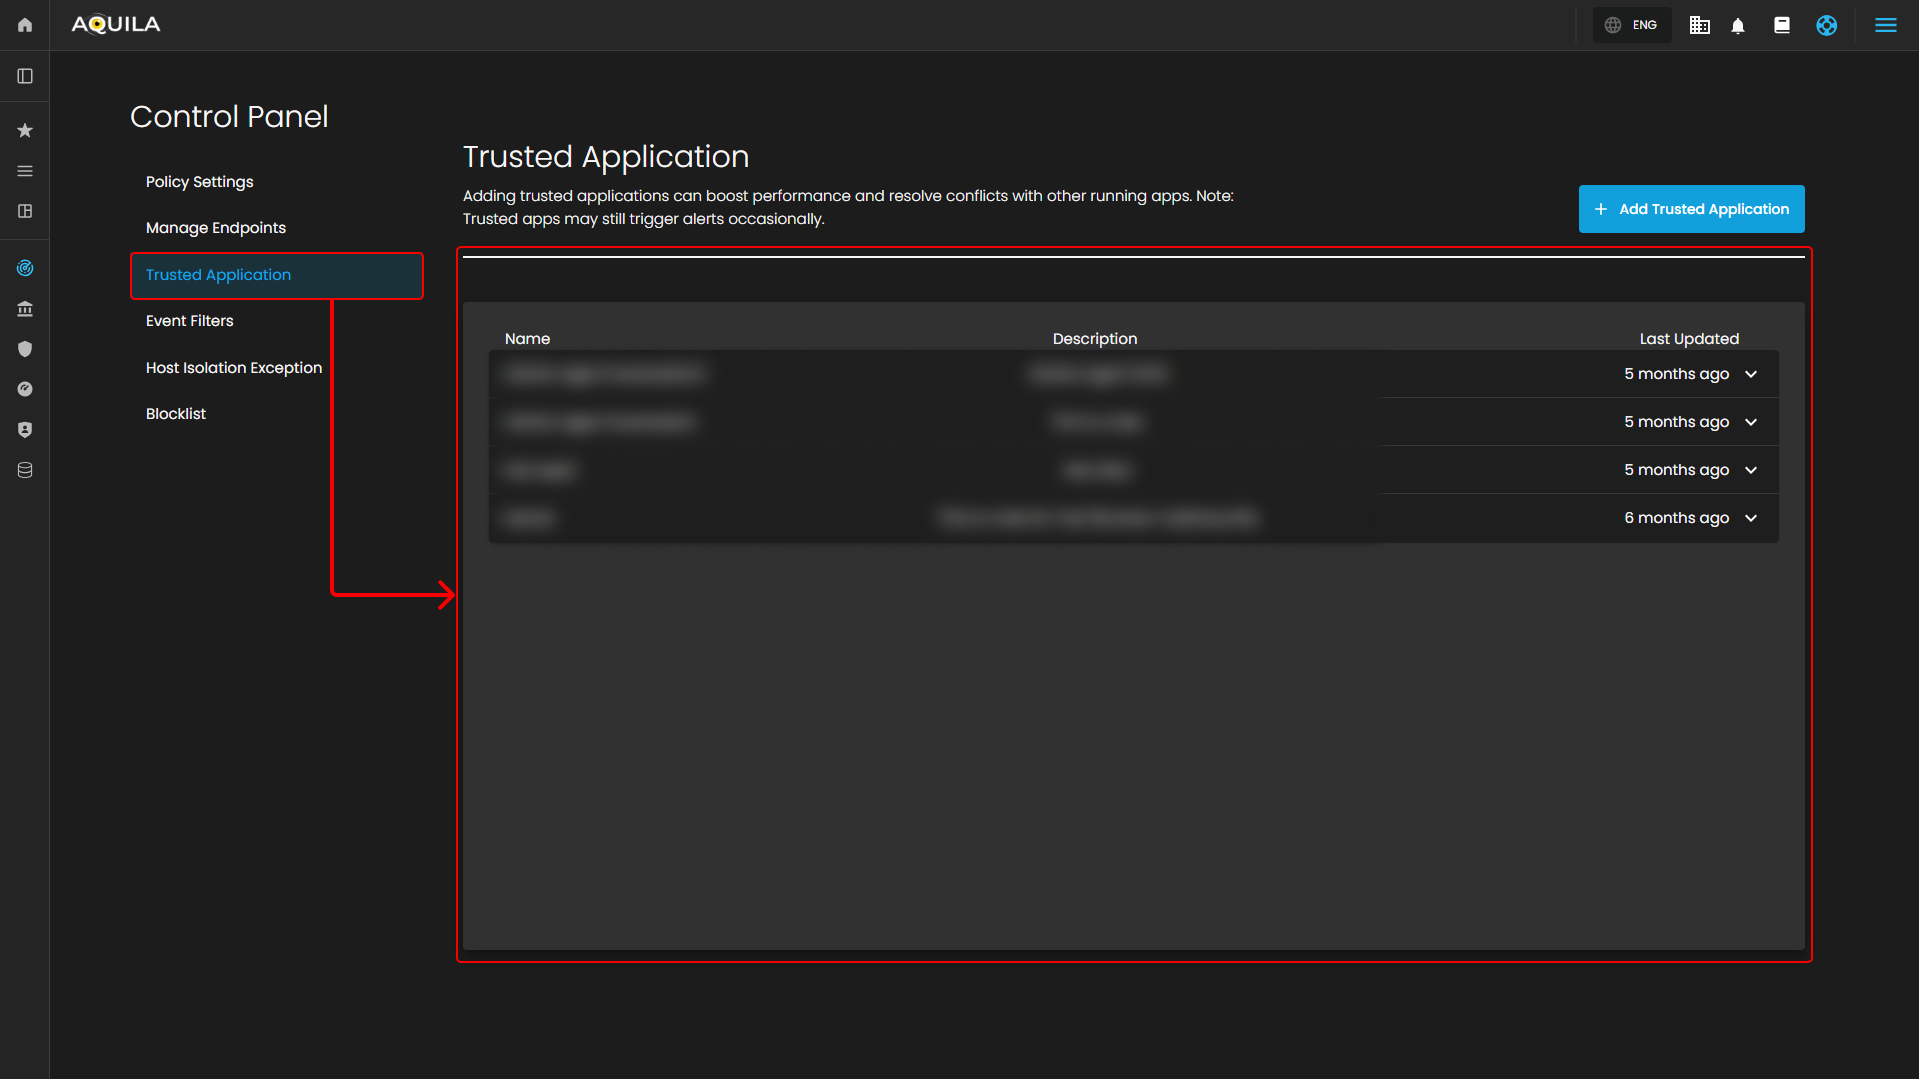
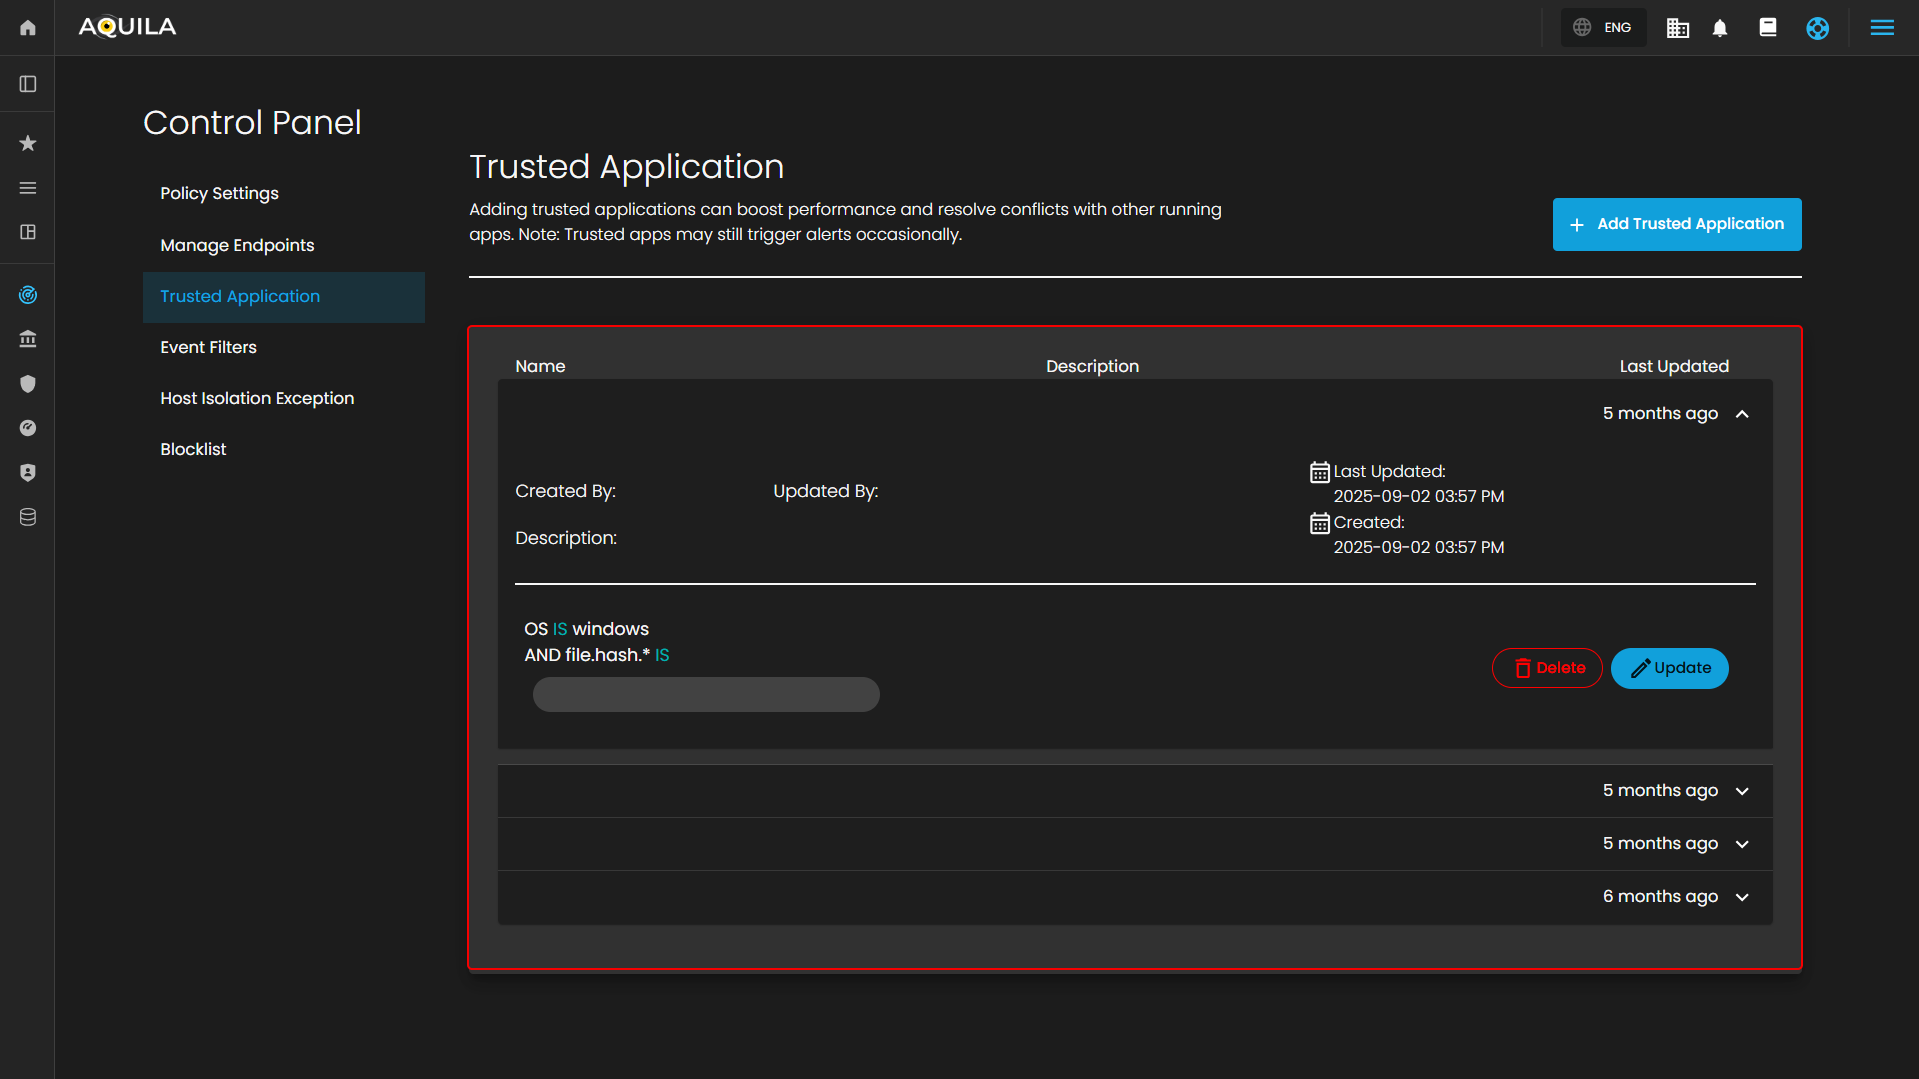
- The Application Details Table
- It displays additional details, including the application name, description, and the timestamp of the last update. This table helps you track which applications are trusted and their associated descriptions. You can also update or remove any trusted application from this section.

- It displays additional details, including the application name, description, and the timestamp of the last update. This table helps you track which applications are trusted and their associated descriptions. You can also update or remove any trusted application from this section.
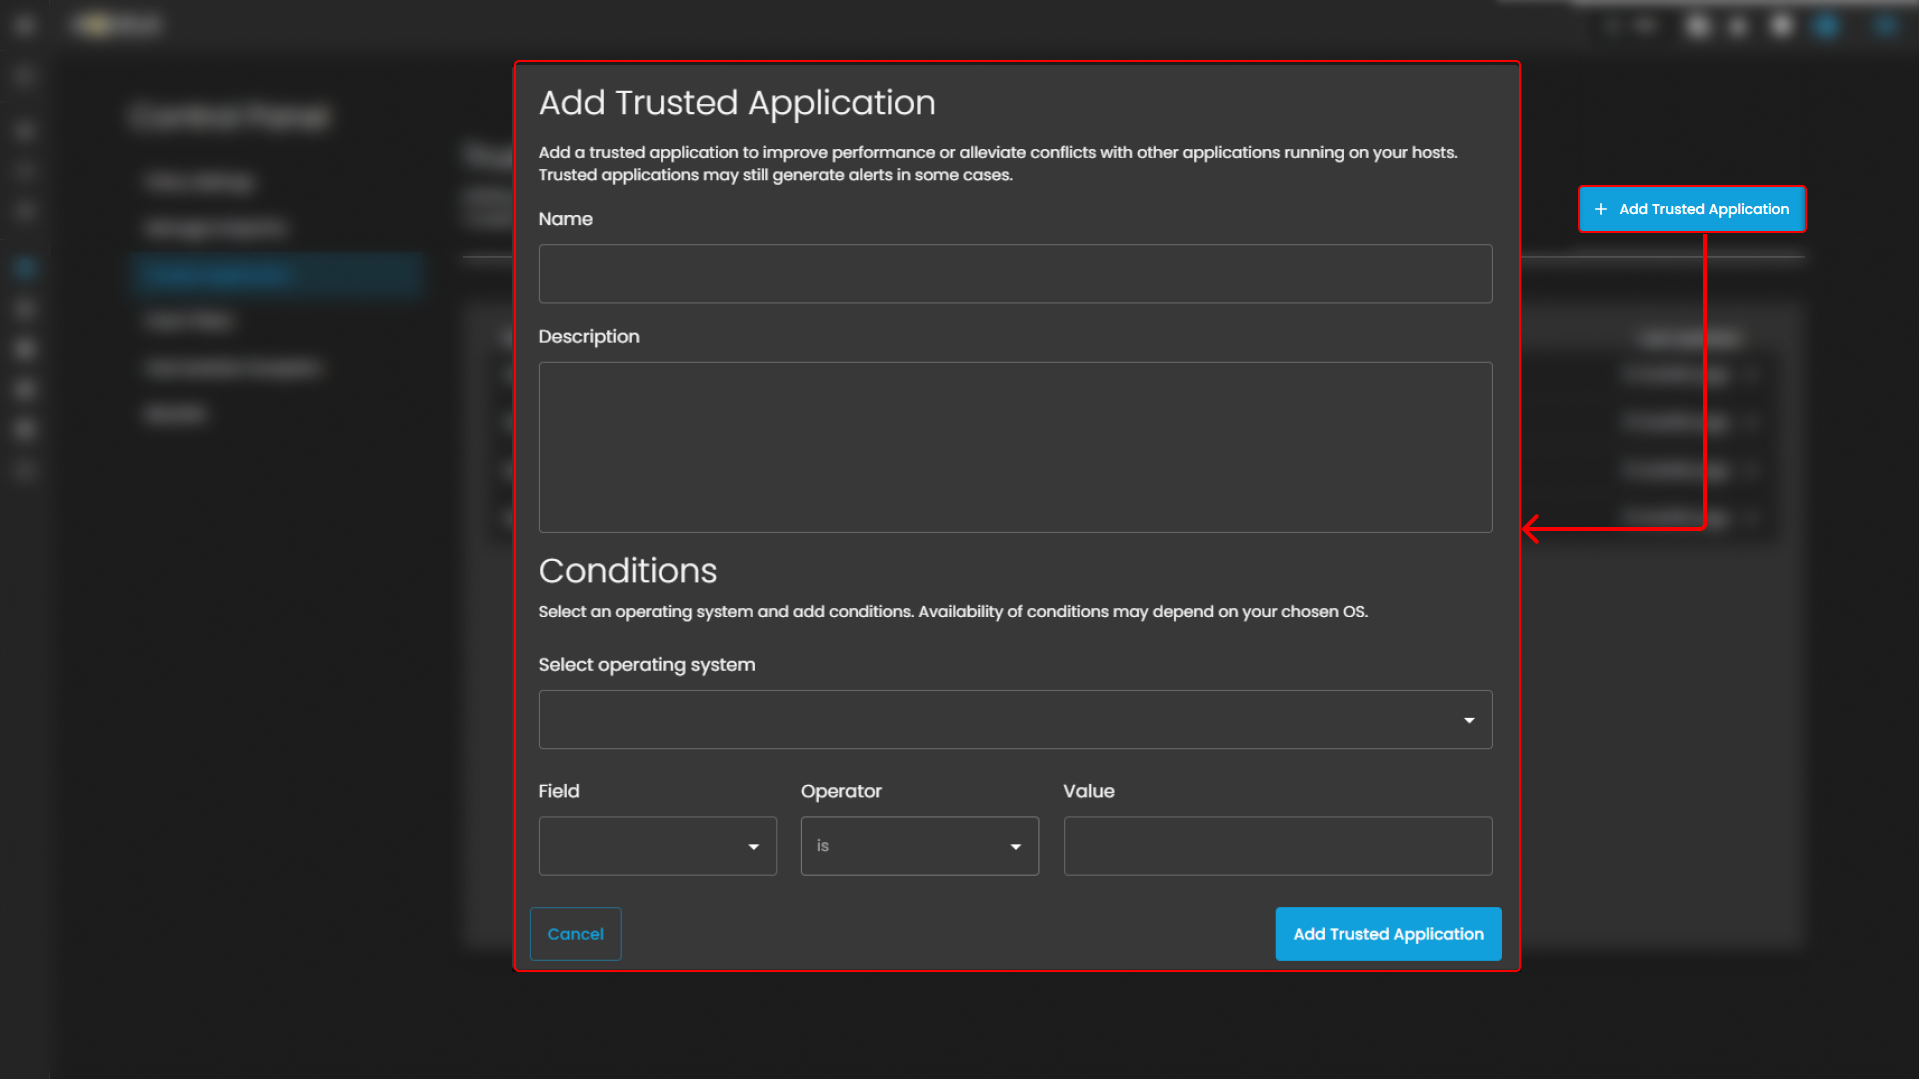
- Add Trusted Application
- This popup allows users to input the Name and Description of the trusted application. Additionally, it includes a Conditions section where you can select an operating system and specify conditions using fields, operators, and values. At the bottom, there are two buttons: Add Trusted Application to confirm the addition and Cancel to discard the action.
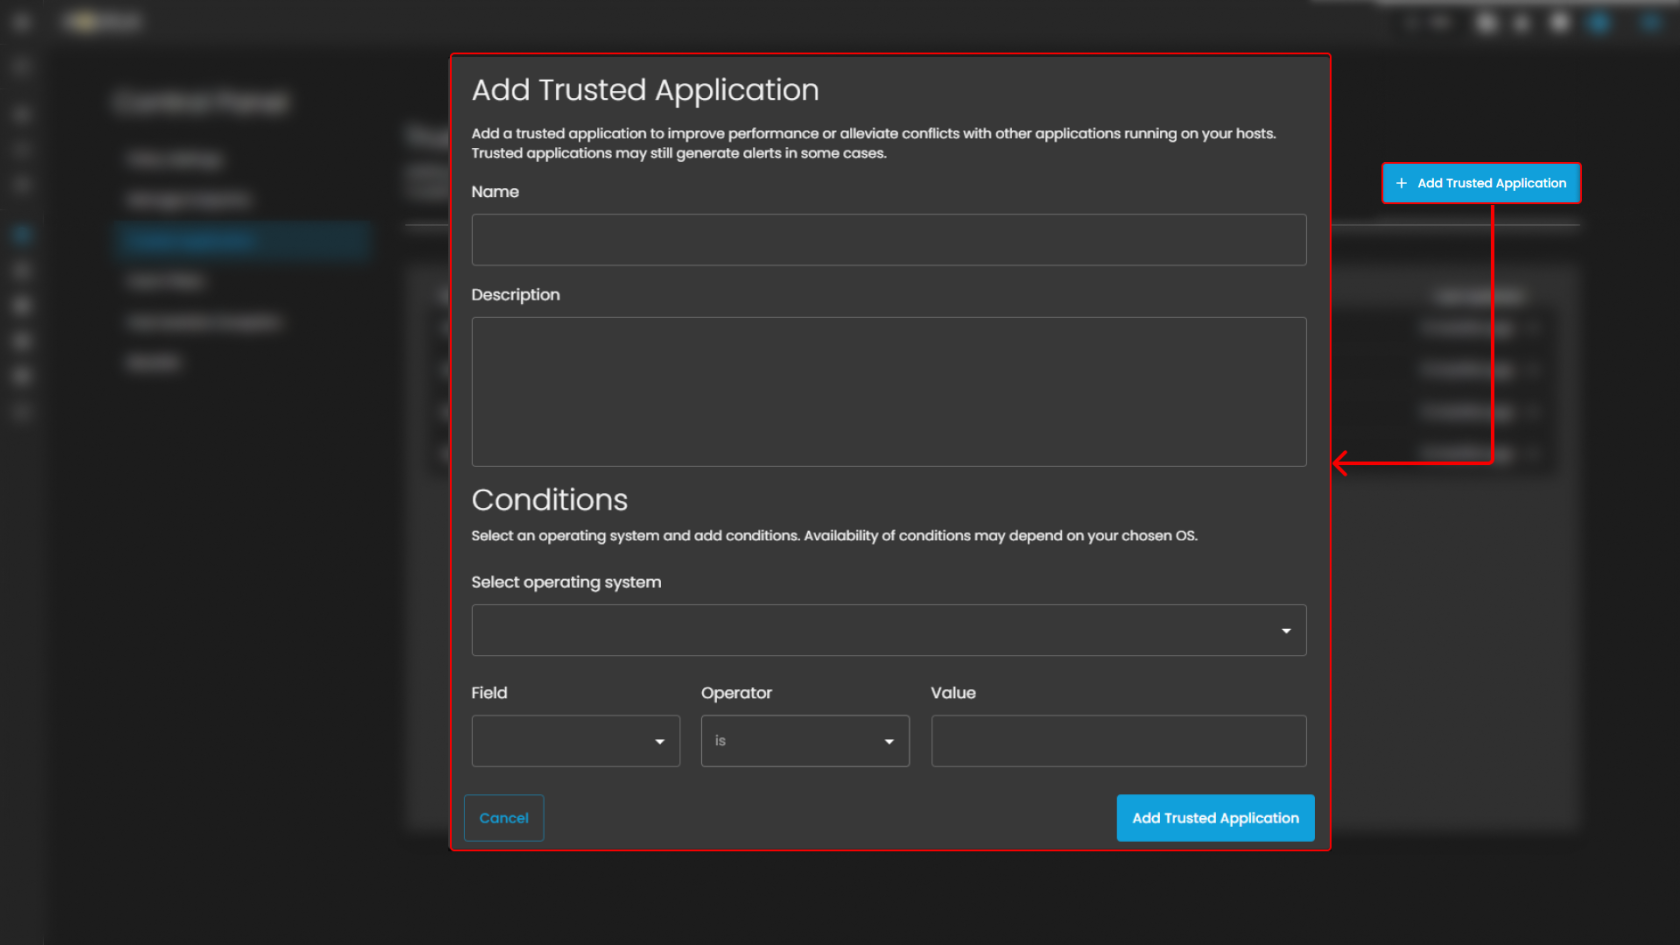
- This popup allows users to input the Name and Description of the trusted application. Additionally, it includes a Conditions section where you can select an operating system and specify conditions using fields, operators, and values. At the bottom, there are two buttons: Add Trusted Application to confirm the addition and Cancel to discard the action.
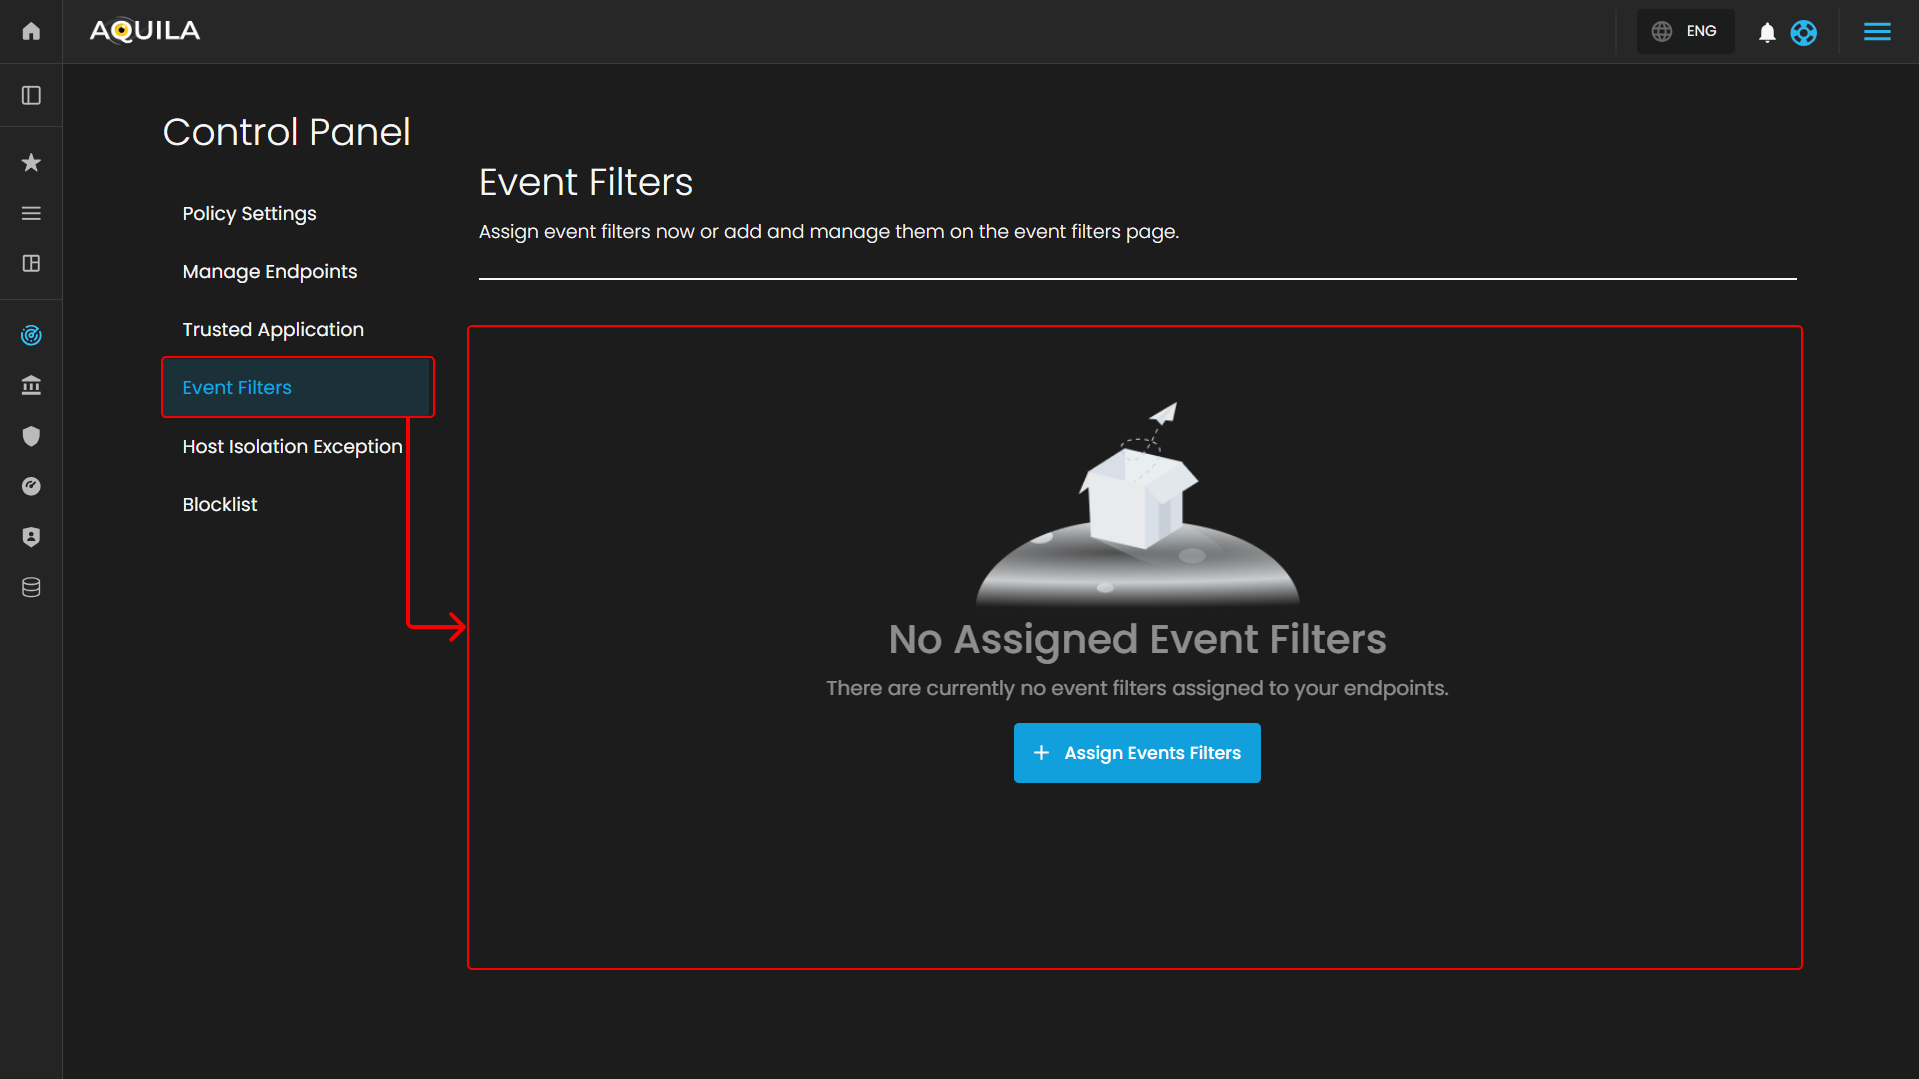
Event Filters Page
In the Event Filters Page, you can assign or manage event filters that define which events should be tracked for your endpoints. Currently, there are no event filters assigned to any of the endpoints, as the section shows the message "No Assigned Event Filters."
Event Filters
-
- The Assign Events Filters Option allows you to easily configure and apply filters to events, helping you focus on specific types of activities or behaviors across your endpoints. This will enable you to narrow down the event logs to show only relevant information.
The Empty Event Filter Status
-
- It shows that no filters have been assigned yet, but it provides a clear call-to-action to add event filters.
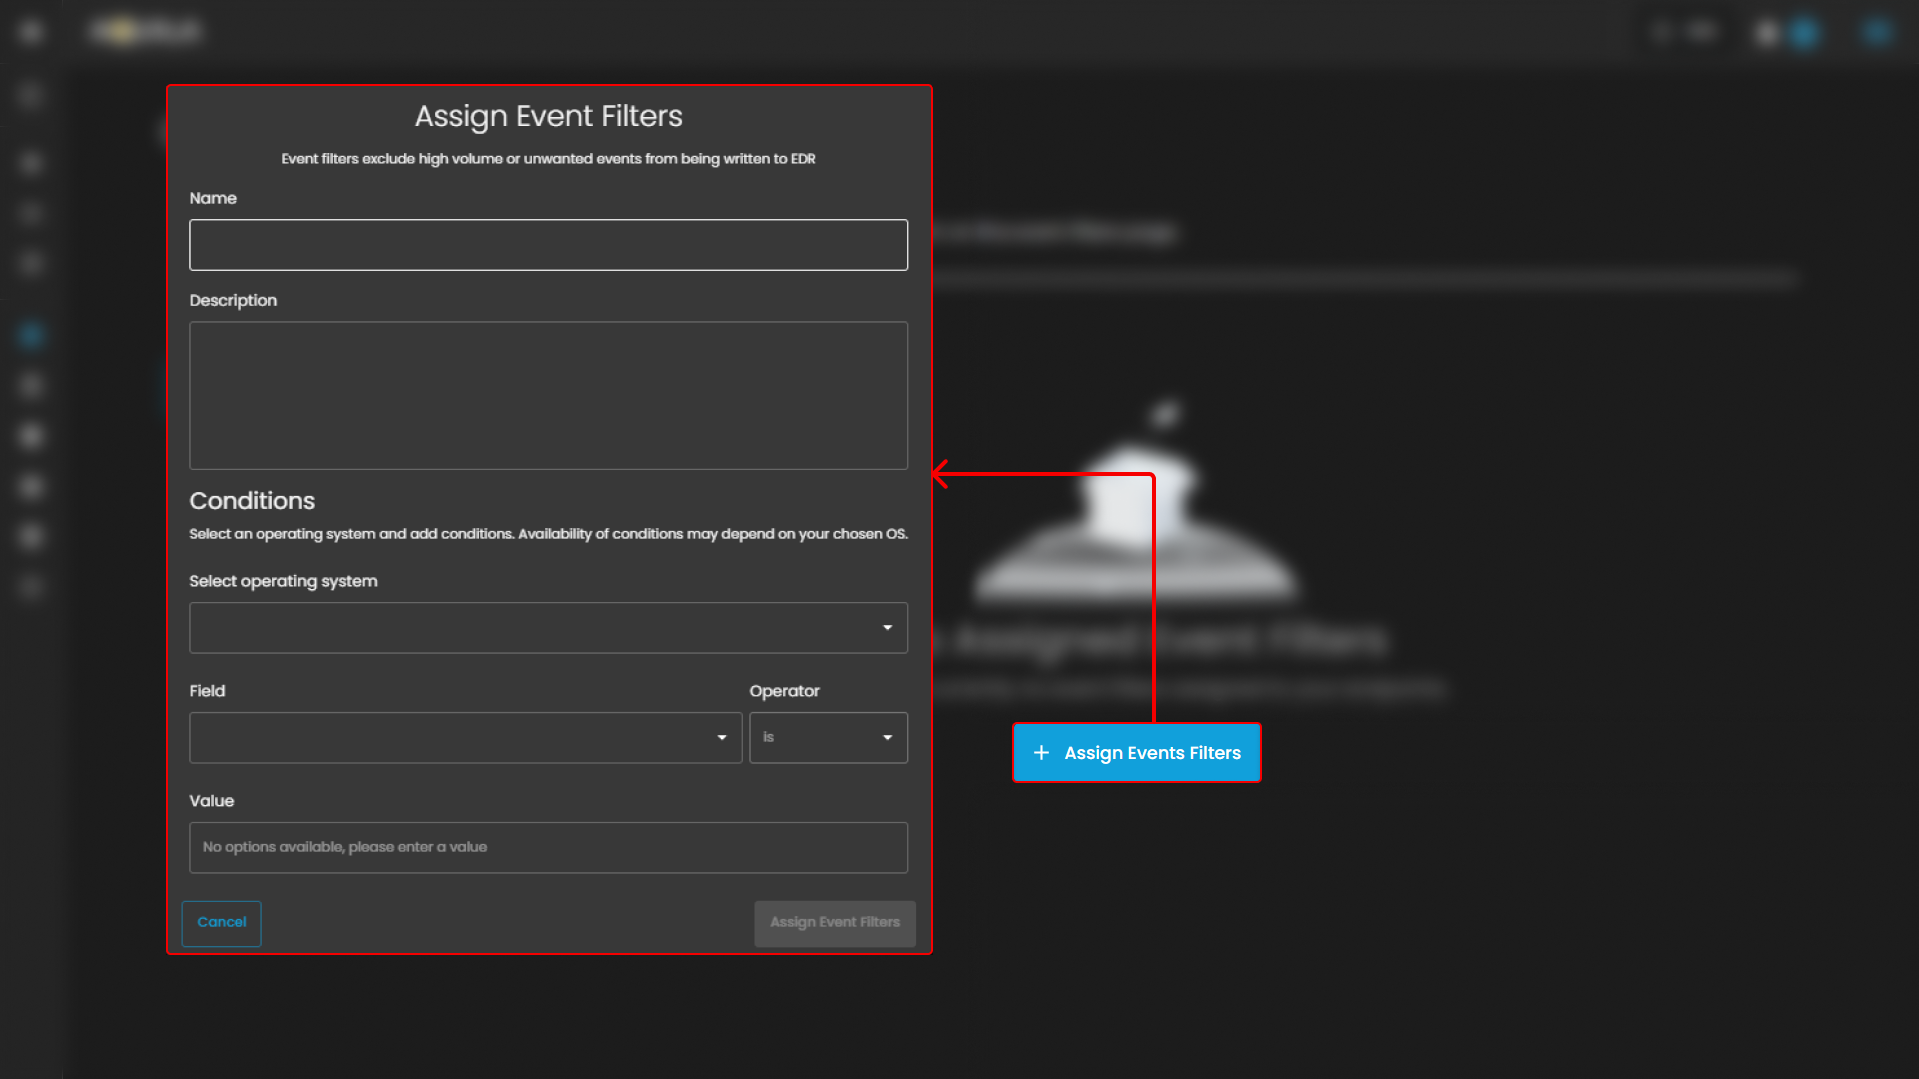
Assign Event Filters
-
- This section allows users to configure filters that exclude high volume or unwanted events from being written to the EDR (Endpoint Detection and Response) system. It includes fields for the Name and Description of the event filter, both of which can be filled out with relevant details. Below that, the Conditions section lets you select an operating system and apply specific conditions using Field, Operator, and Value to filter events based on certain criteria.

- This section allows users to configure filters that exclude high volume or unwanted events from being written to the EDR (Endpoint Detection and Response) system. It includes fields for the Name and Description of the event filter, both of which can be filled out with relevant details. Below that, the Conditions section lets you select an operating system and apply specific conditions using Field, Operator, and Value to filter events based on certain criteria.
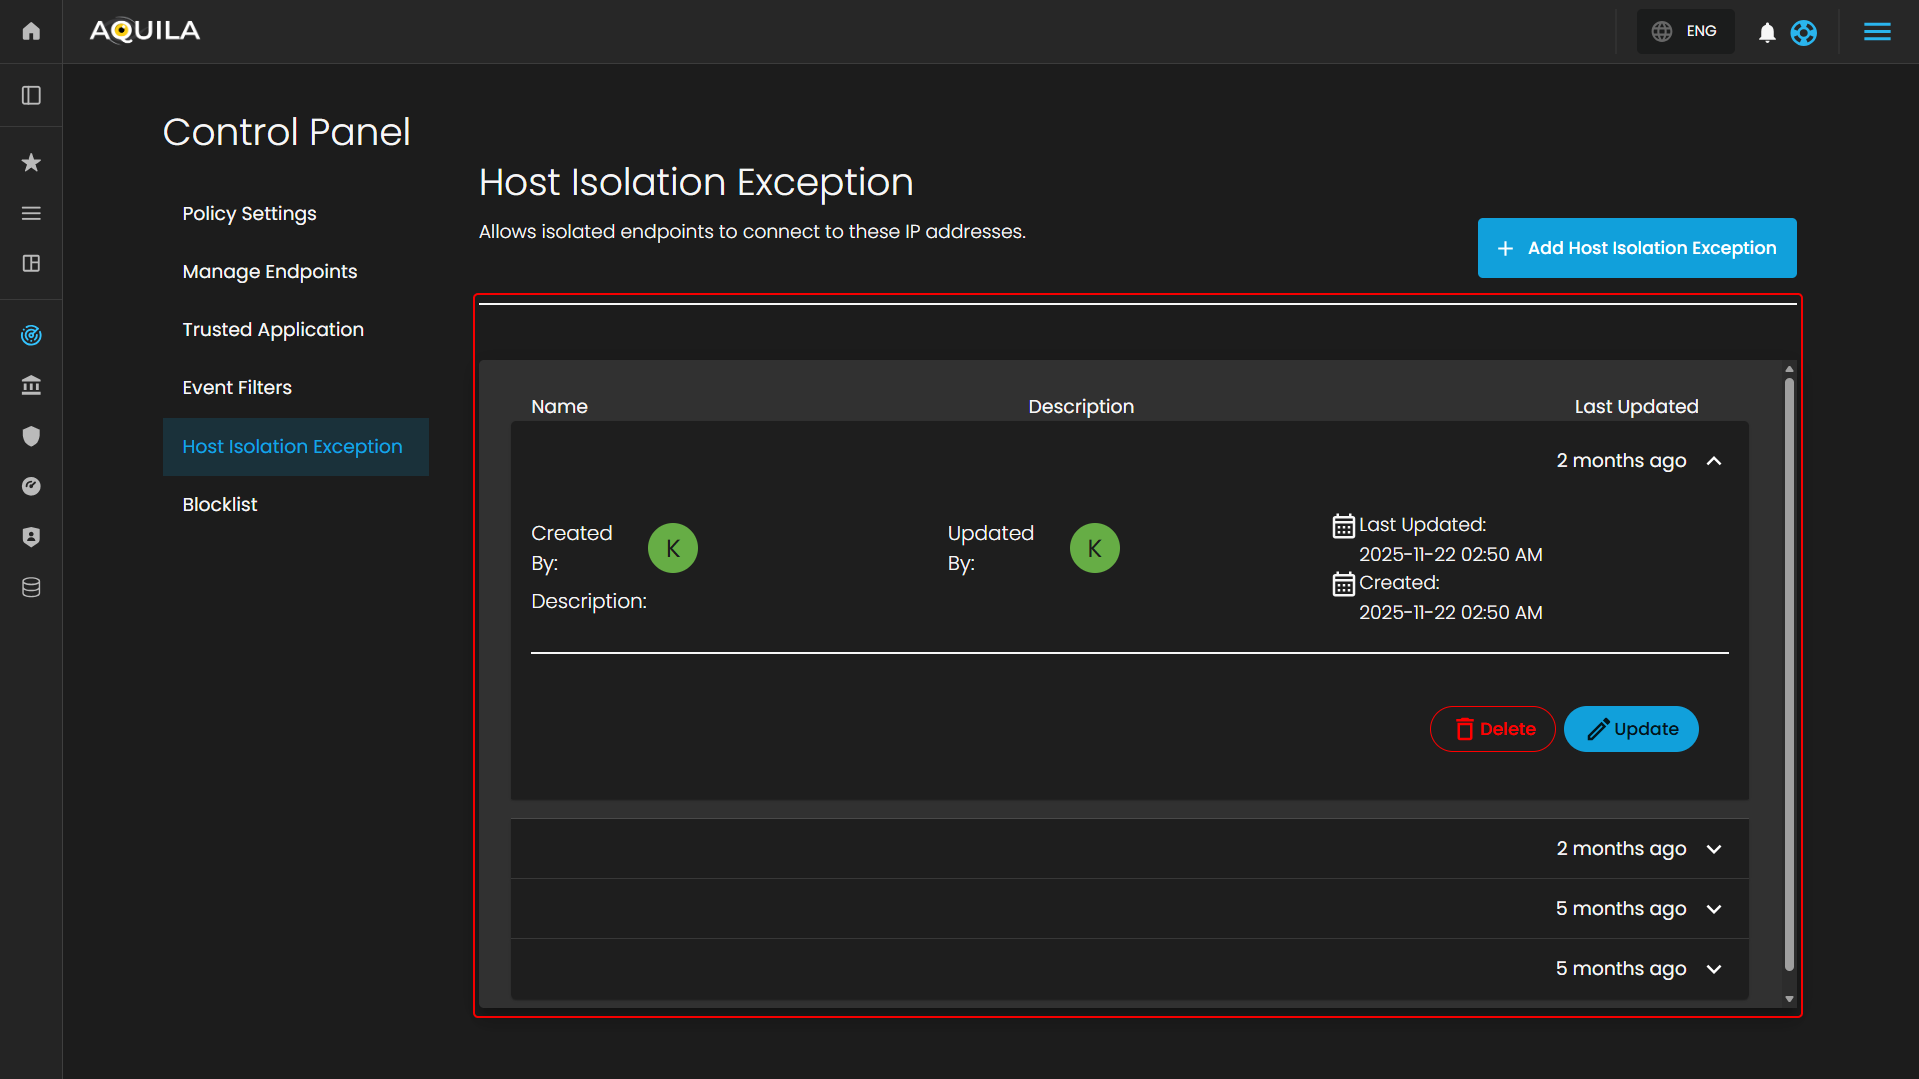
Host Isolation Exception Page
In the Host Isolation Exception Page, you can see the list of exceptions that allow isolated endpoints to connect to specific IP addresses. This section displays the names of the exceptions, their descriptions, and the most recent update times.
- The Host Isolation Exception Overview
- This gives you the ability to manage exceptions made to the host isolation policy. Here, you can track any exceptions, that have been made to allow endpoints to access certain IPs.
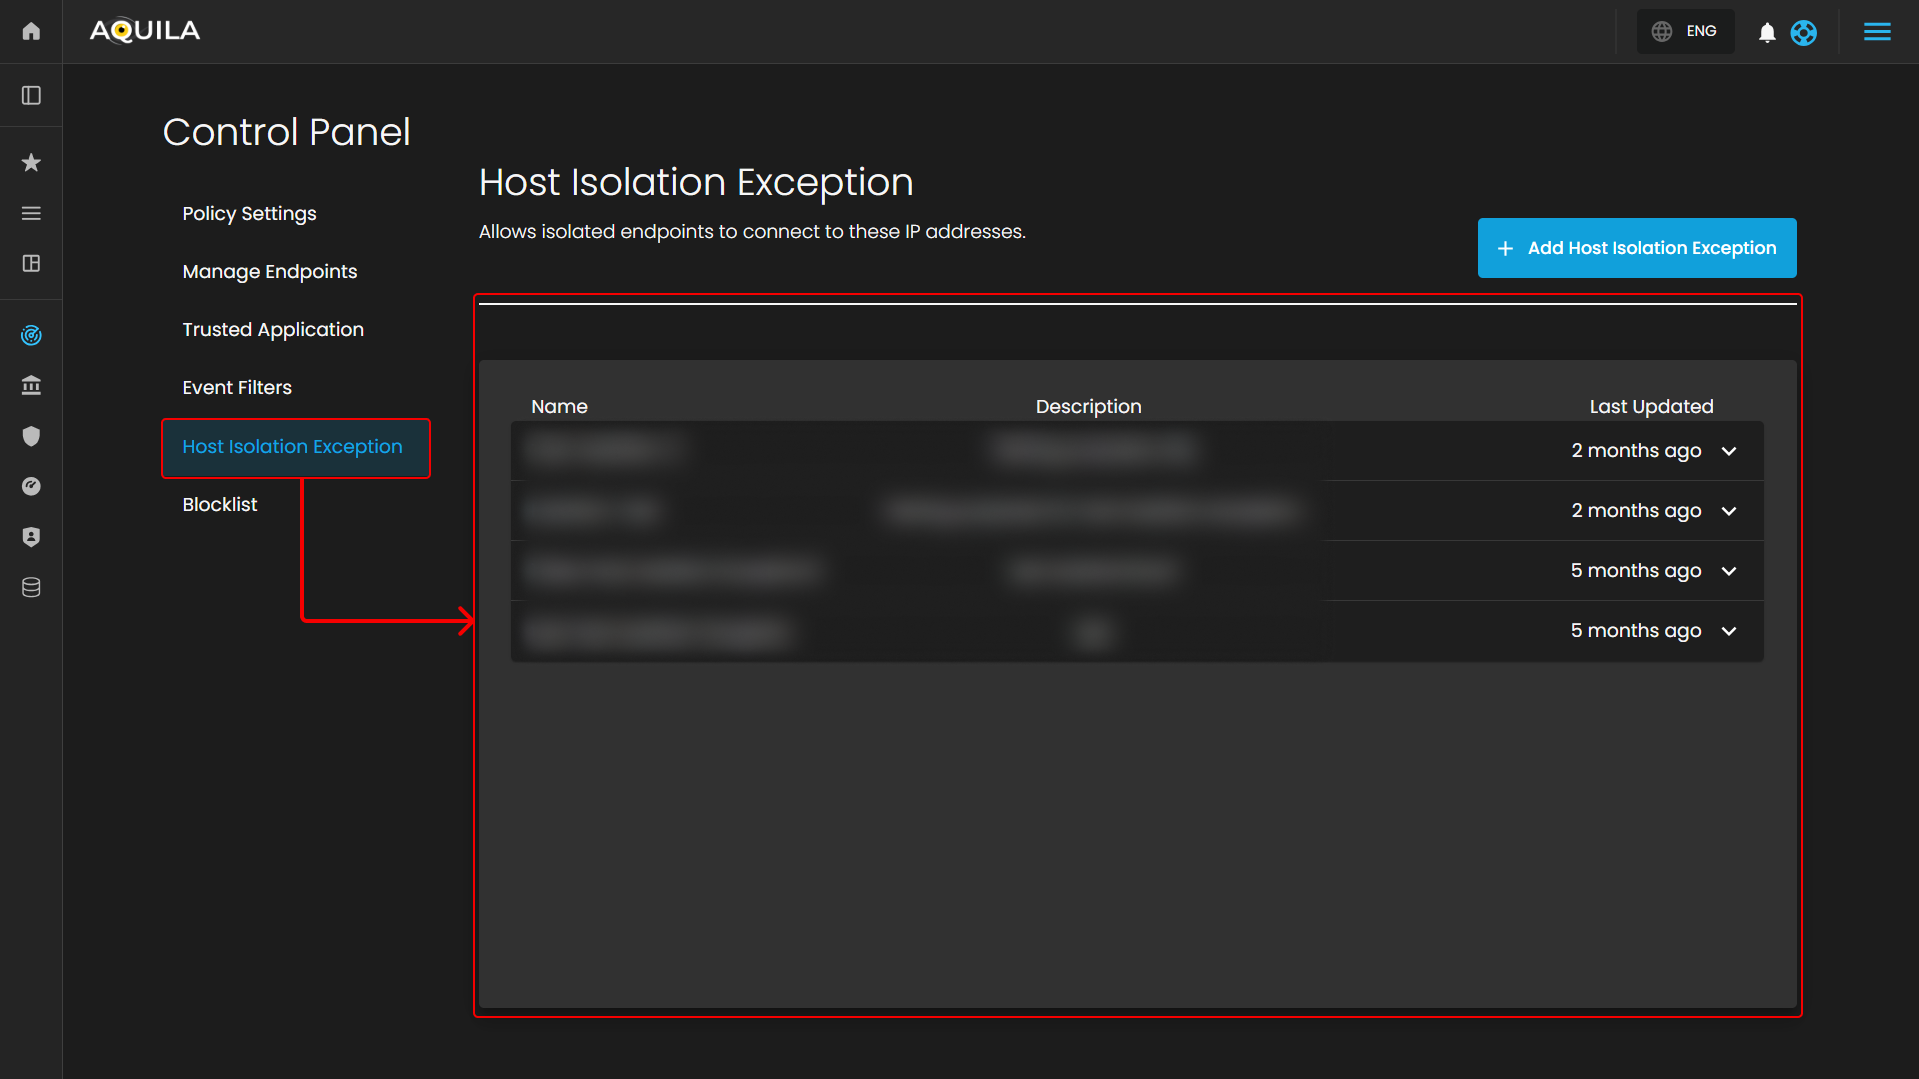
- The Exception Details Table
- It lists the exception names, descriptions, and the timestamp of when they were last updated. You can use this table to manage and modify these exceptions, ensuring proper access while maintaining security policies.
- It lists the exception names, descriptions, and the timestamp of when they were last updated. You can use this table to manage and modify these exceptions, ensuring proper access while maintaining security policies.
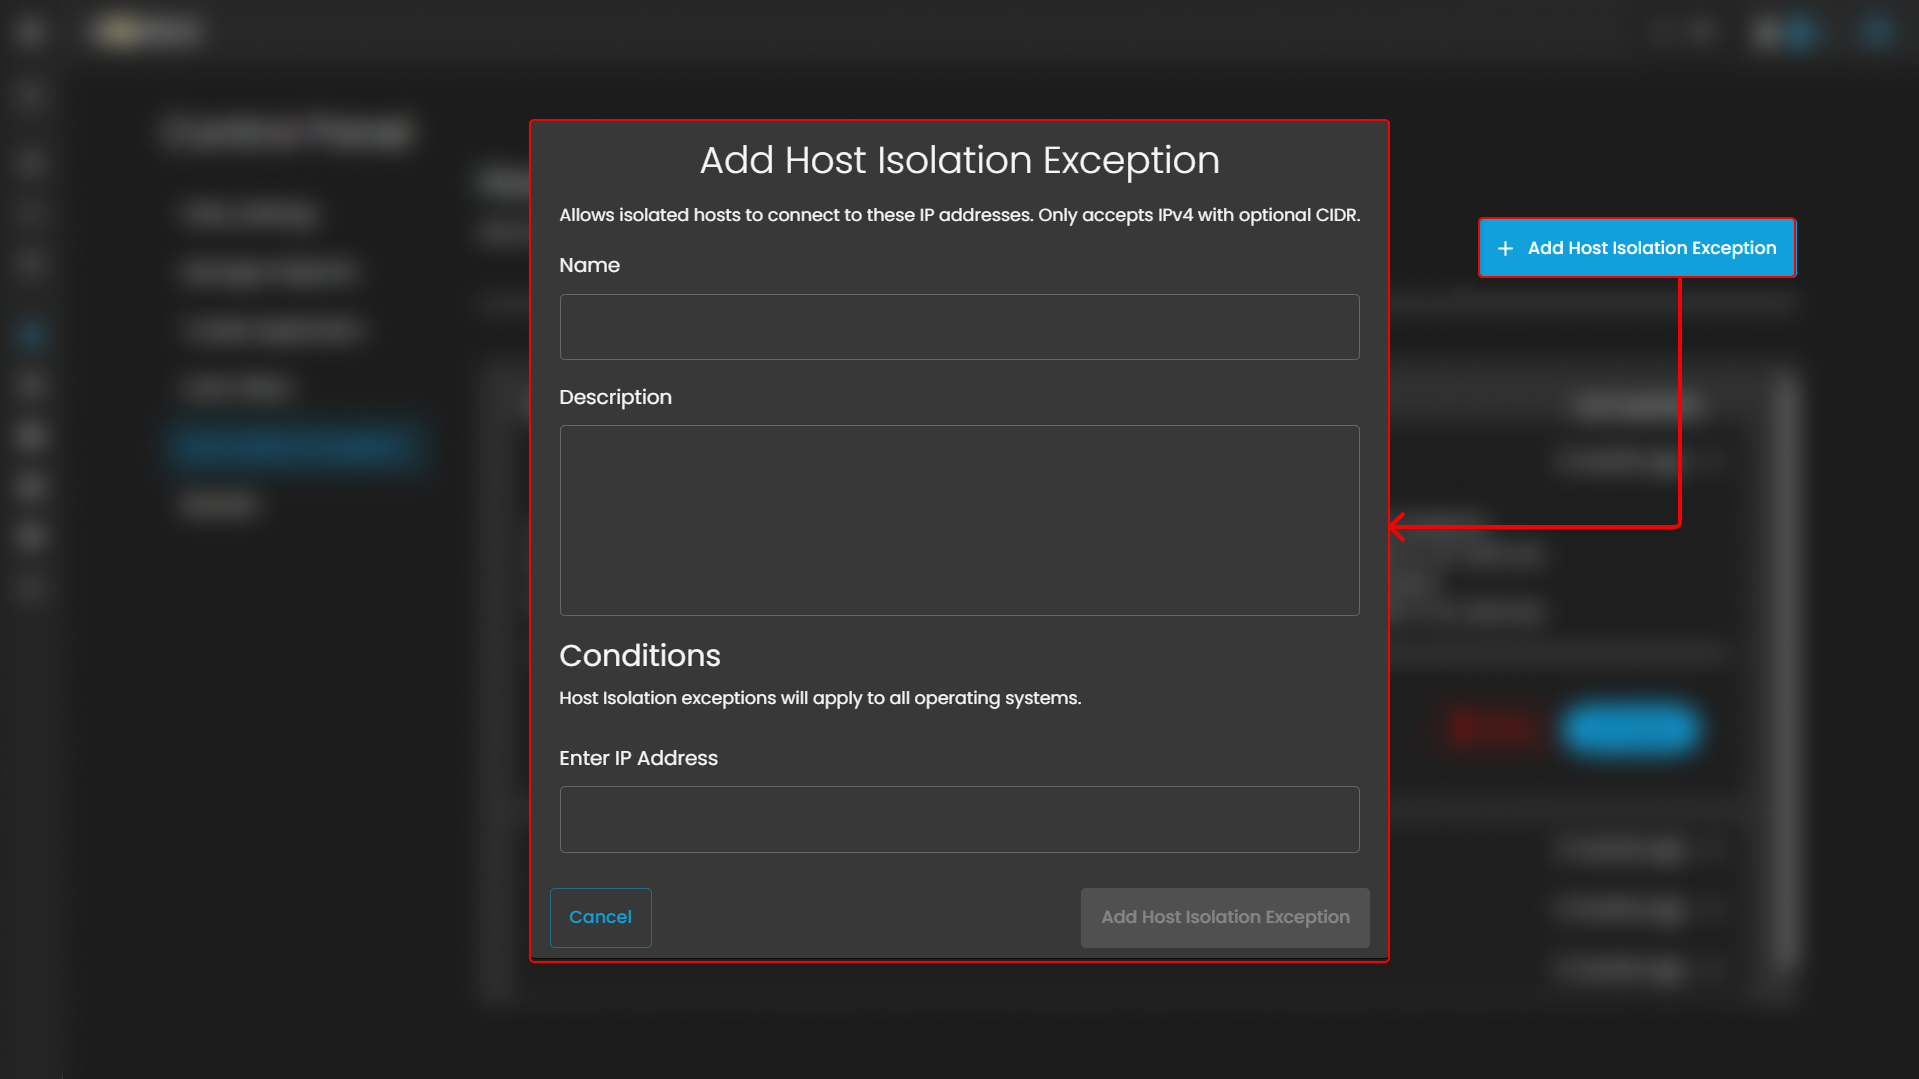
- Add Host Isolation Exception.
- This popup allows users to create exceptions for isolated hosts, enabling them to connect to specific IP addresses. It includes fields for the Name of the exception and an optional Description to provide additional details. Under Conditions, there is a field labeled Enter IP Address, where users can specify the IP addresses (IPv4, with optional CIDR) to which the isolated hosts are allowed to connect.

- This popup allows users to create exceptions for isolated hosts, enabling them to connect to specific IP addresses. It includes fields for the Name of the exception and an optional Description to provide additional details. Under Conditions, there is a field labeled Enter IP Address, where users can specify the IP addresses (IPv4, with optional CIDR) to which the isolated hosts are allowed to connect.

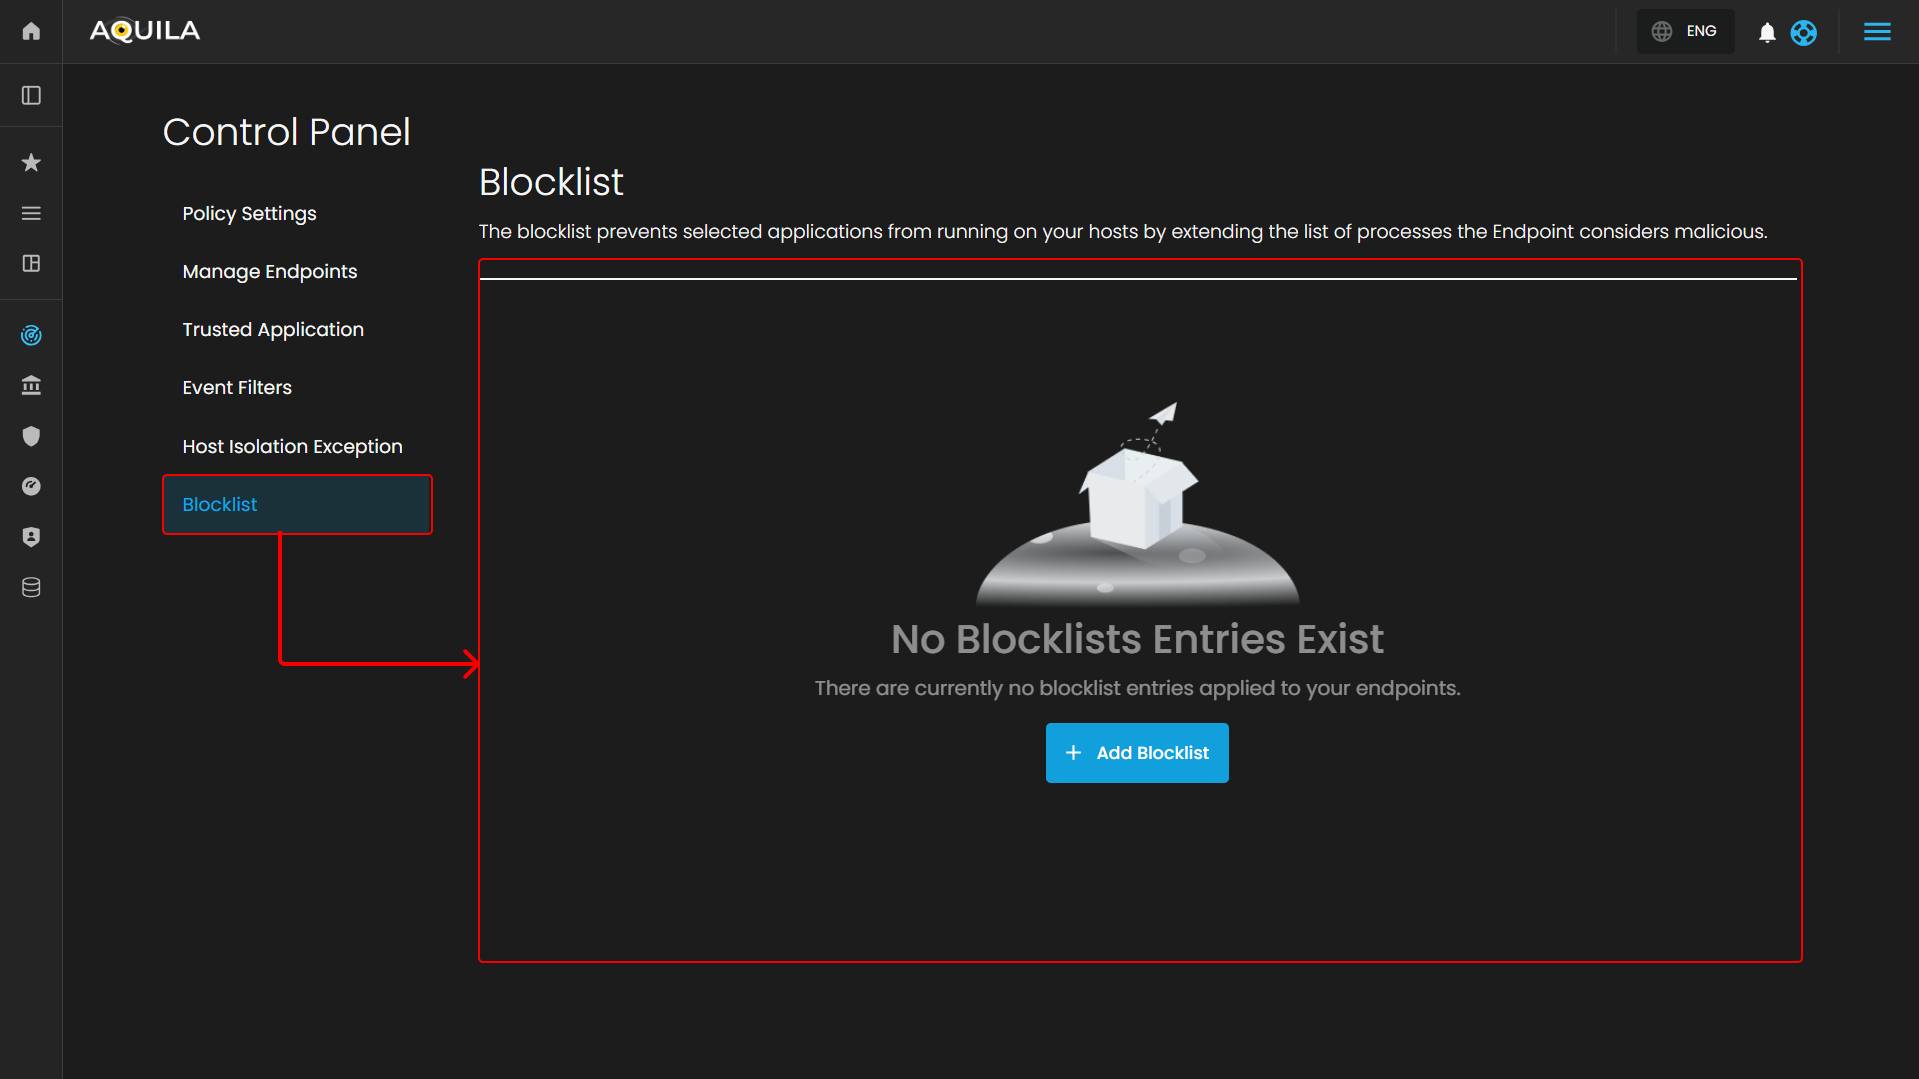
Blocklist
The Blocklist page allows you to manage applications that are restricted from running on your endpoints, preventing specified applications from being executed. The page displays a list of blocklisted applications, including their names, descriptions, and the time when each blocklist entry was last updated.
-
Blocklist Overview
-
This section provides an overview of all the blocklist entries. For example, you can view blocklist entries like Notepad Block - Test, which prevent specific applications from running on isolated systems, ensuring security is maintained.
-
- Blocklist Details Table
- The Blocklist Details Table provides detailed information about each entry, displaying the name of the application, description for additional context, and the time it was last updated. This table allows you to view and manage the entries, ensuring they align with your security policies. You can track the status of each entry and modify them as necessary to maintain proper access control and prevent unwanted applications from running.
- The Blocklist Details Table provides detailed information about each entry, displaying the name of the application, description for additional context, and the time it was last updated. This table allows you to view and manage the entries, ensuring they align with your security policies. You can track the status of each entry and modify them as necessary to maintain proper access control and prevent unwanted applications from running.
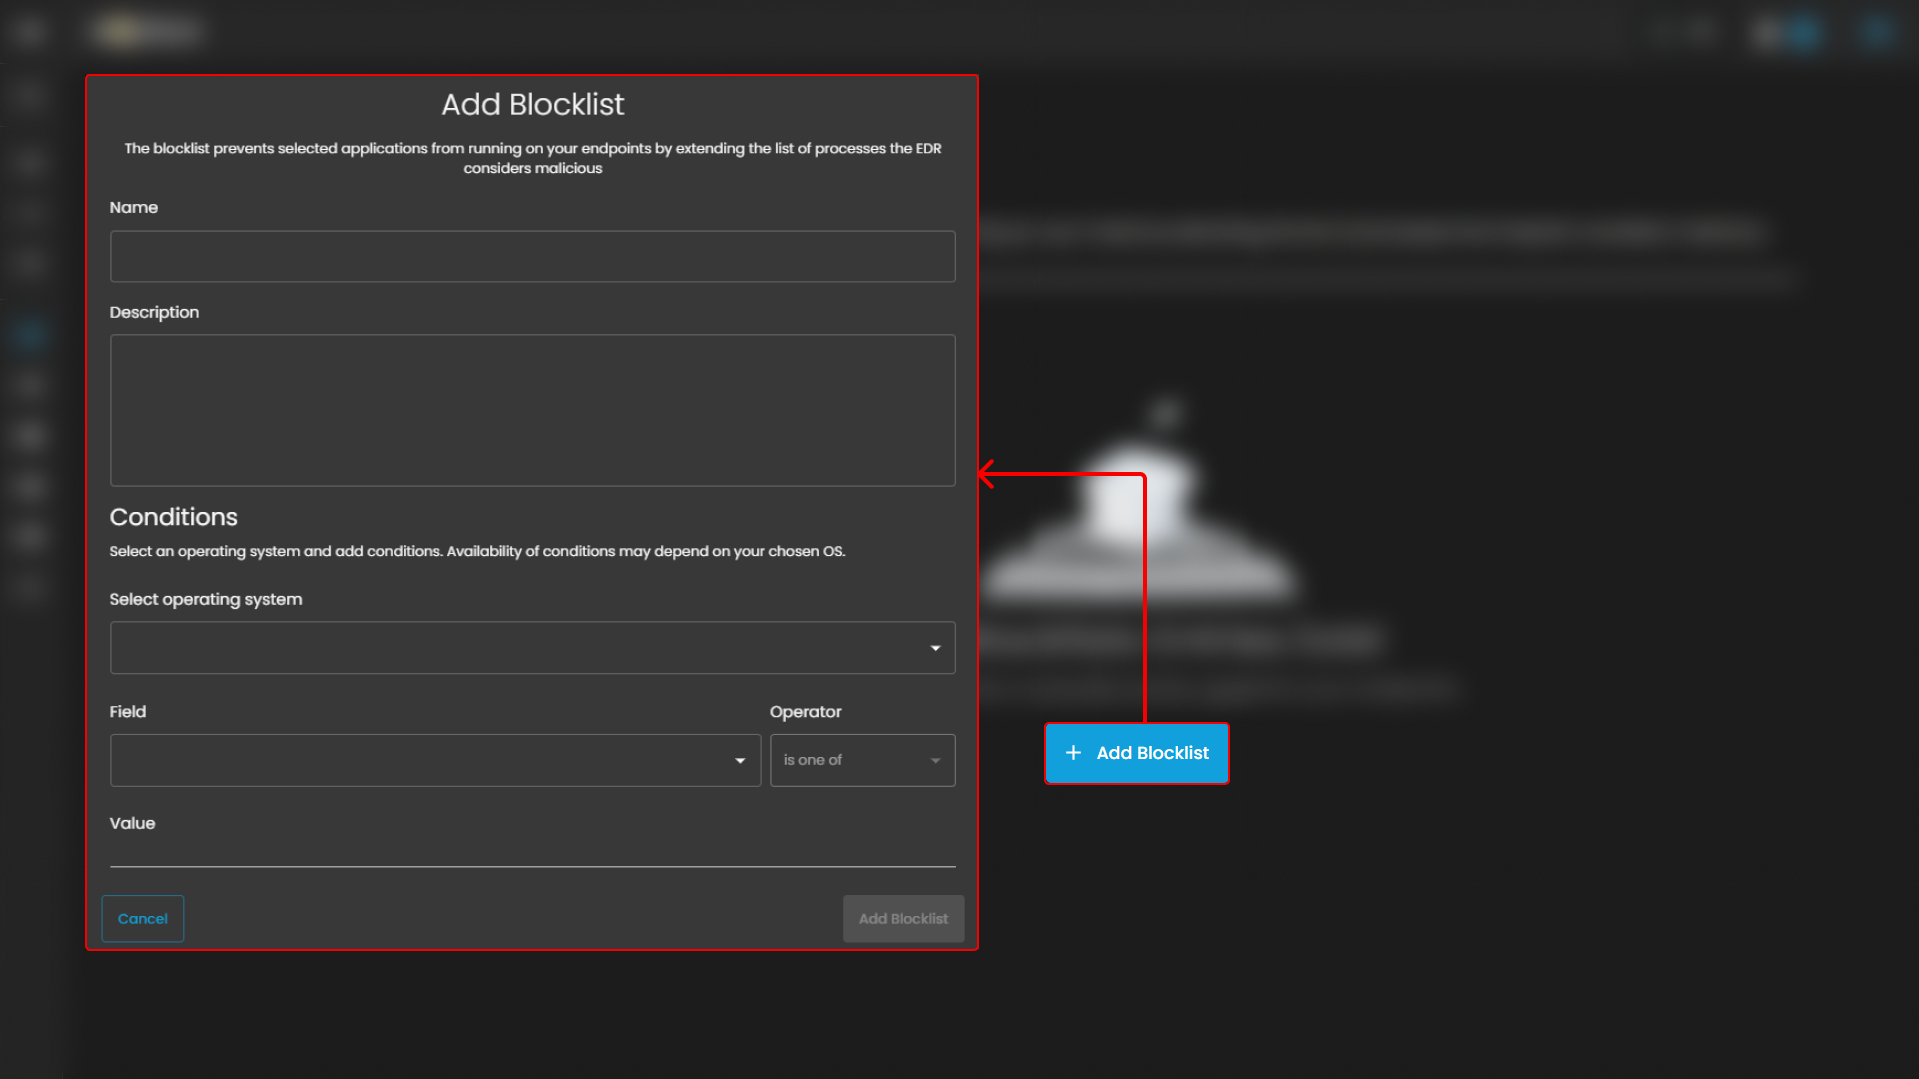
- Add Blocklist Entry
- When adding a new blocklist entry, a popup window appears allowing you to set up the entry. In this window, you can enter the Name of the entry and an optional Description. You can also define the Conditions by specifying the application and other criteria that should be blocked on your endpoints.
- When adding a new blocklist entry, a popup window appears allowing you to set up the entry. In this window, you can enter the Name of the entry and an optional Description. You can also define the Conditions by specifying the application and other criteria that should be blocked on your endpoints.
If you need further assistance, kindly contact our support at support@cytechint.com for prompt assistance and guidance.
No comments to display
No comments to display