CyTech AQUILA - Virtual Penetration Testing (Module)
Overview:
Virtual penetration testing is a controlled, authorized simulated attack on an organization’s systems that’s performed remotely (often against virtualized, cloud, or networked environments) to discover security weaknesses before malicious actors do.
Key Features:
- Dashboard - shows overall asset status, recurring vulnerabilities, trends, and recent scan results.
- Scan - lets users run different penetration tests, set scope, schedule, and monitor progress.
- Reports - provide summarized findings with severity, remediation guidance, compliance mapping, and export options.
Step 1: Log in to CyTech – AQUILA. https://usdc.cytechint.io/
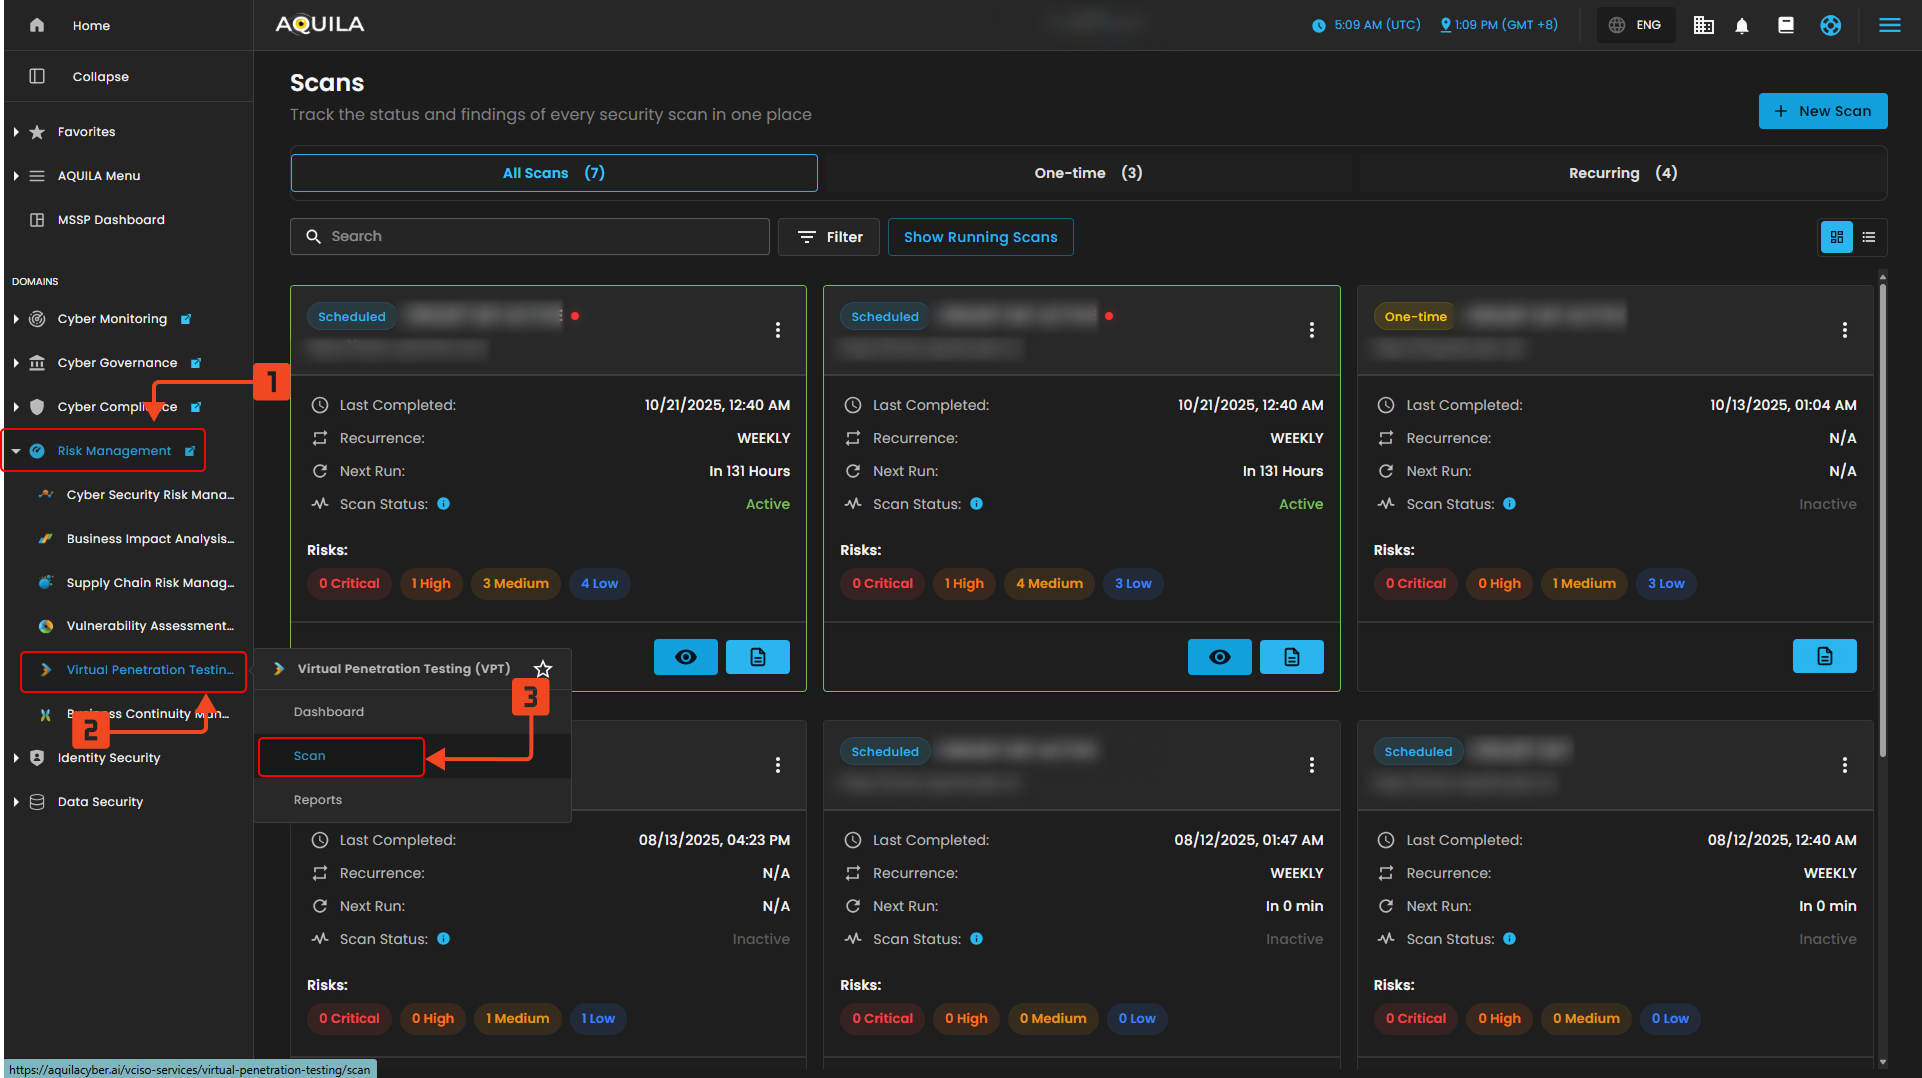
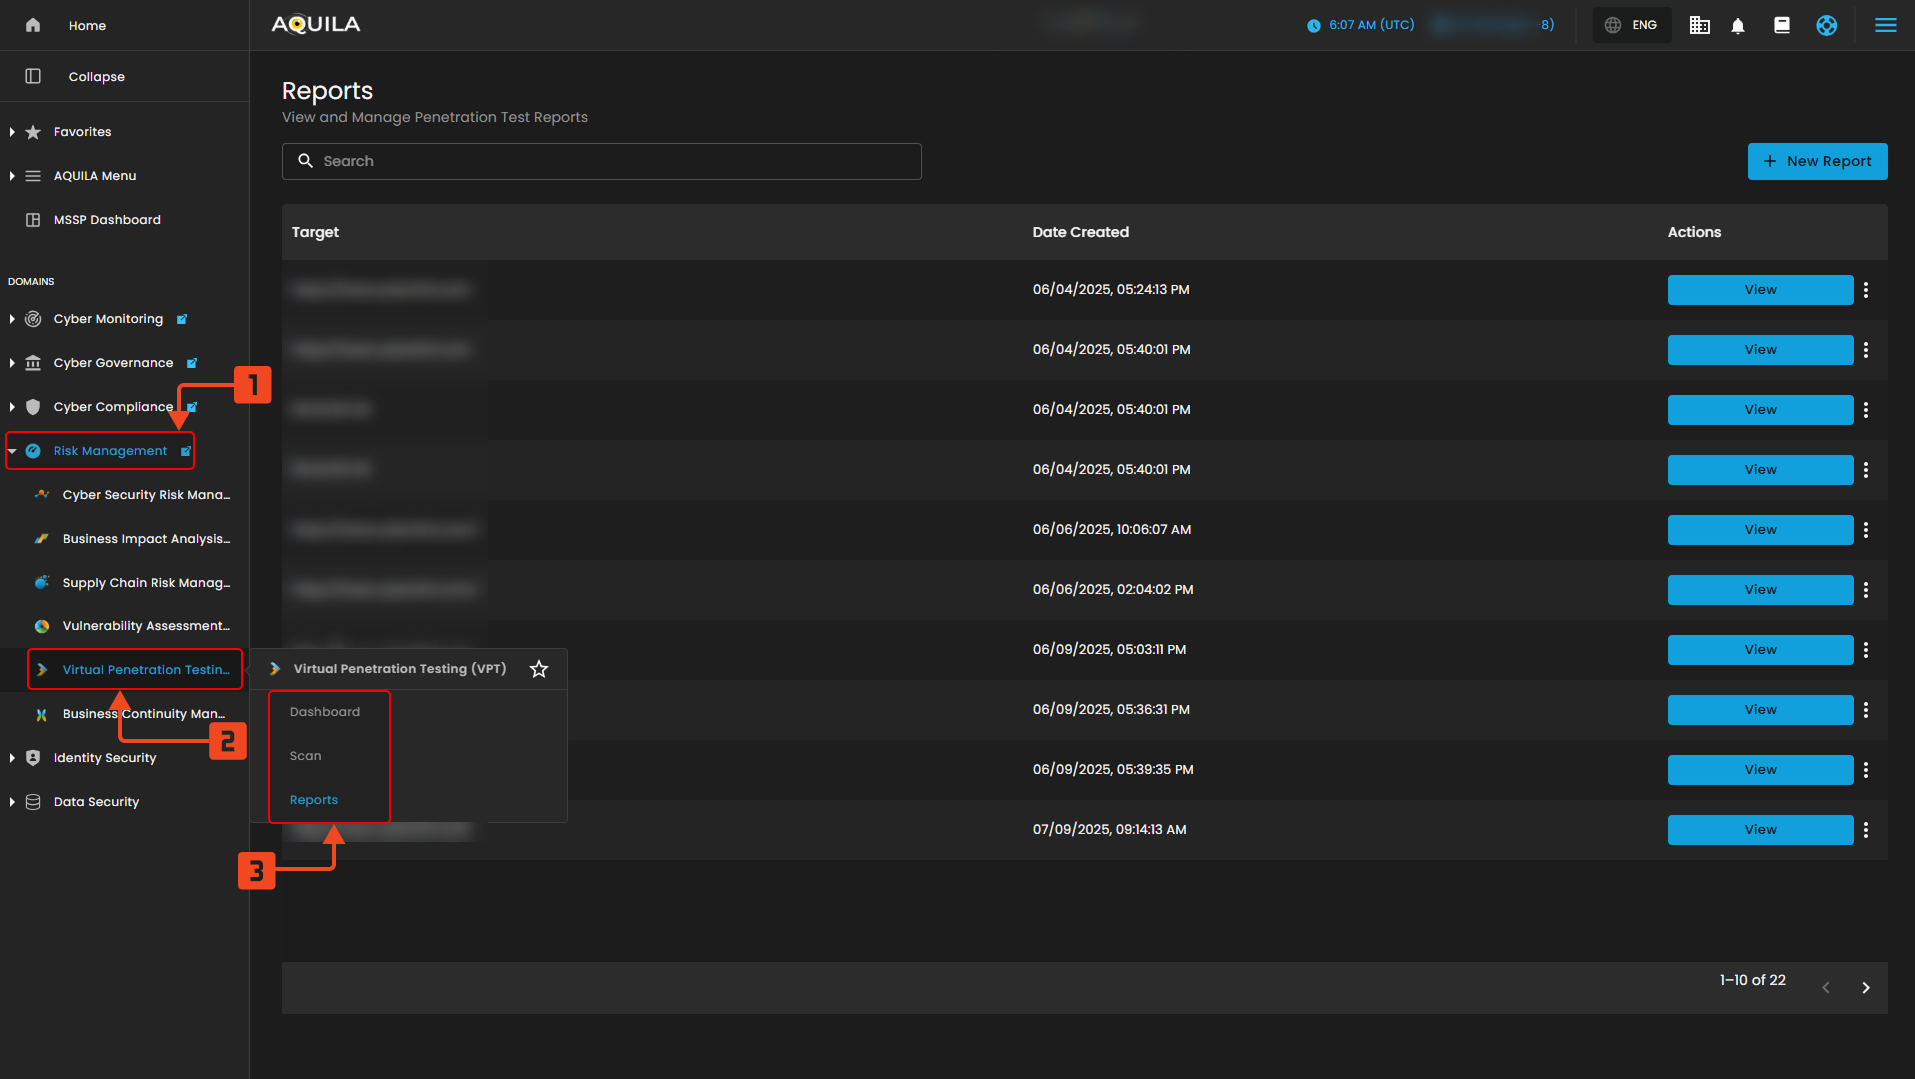
Step 2: In the left side panel, you can see the list of six (6) domains, kindly choose and click the Risk Management (Domain) -> Virtual Penetration Testing (Module) -> Dashboard (Sub Module)
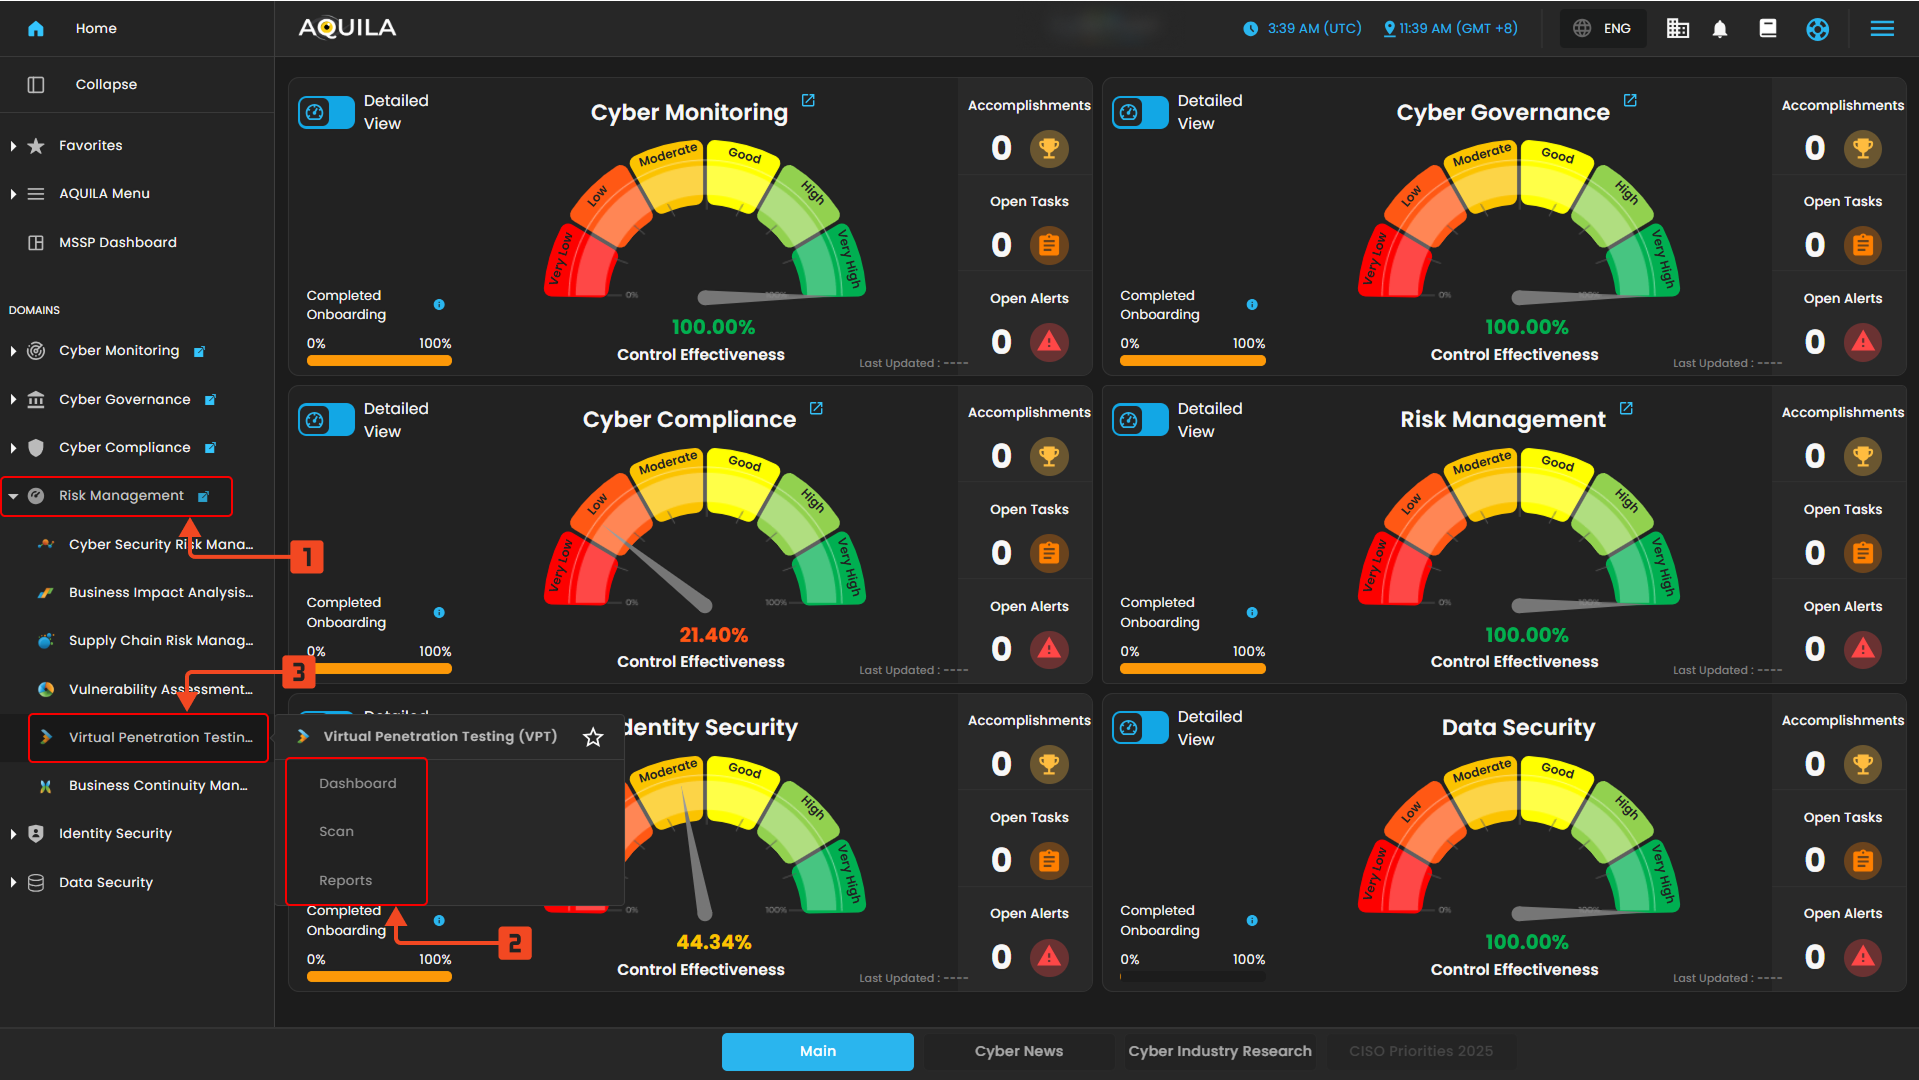
"Dashboard (Sub-module)" - Virtual Penetration Testing (Module)
The Virtual Penetration Testing Dashboard provides an overview of asset status, highlights top recurring vulnerabilities, shows trends of detected and open vulnerabilities over time, and lists recent scans with their progress and completion status.
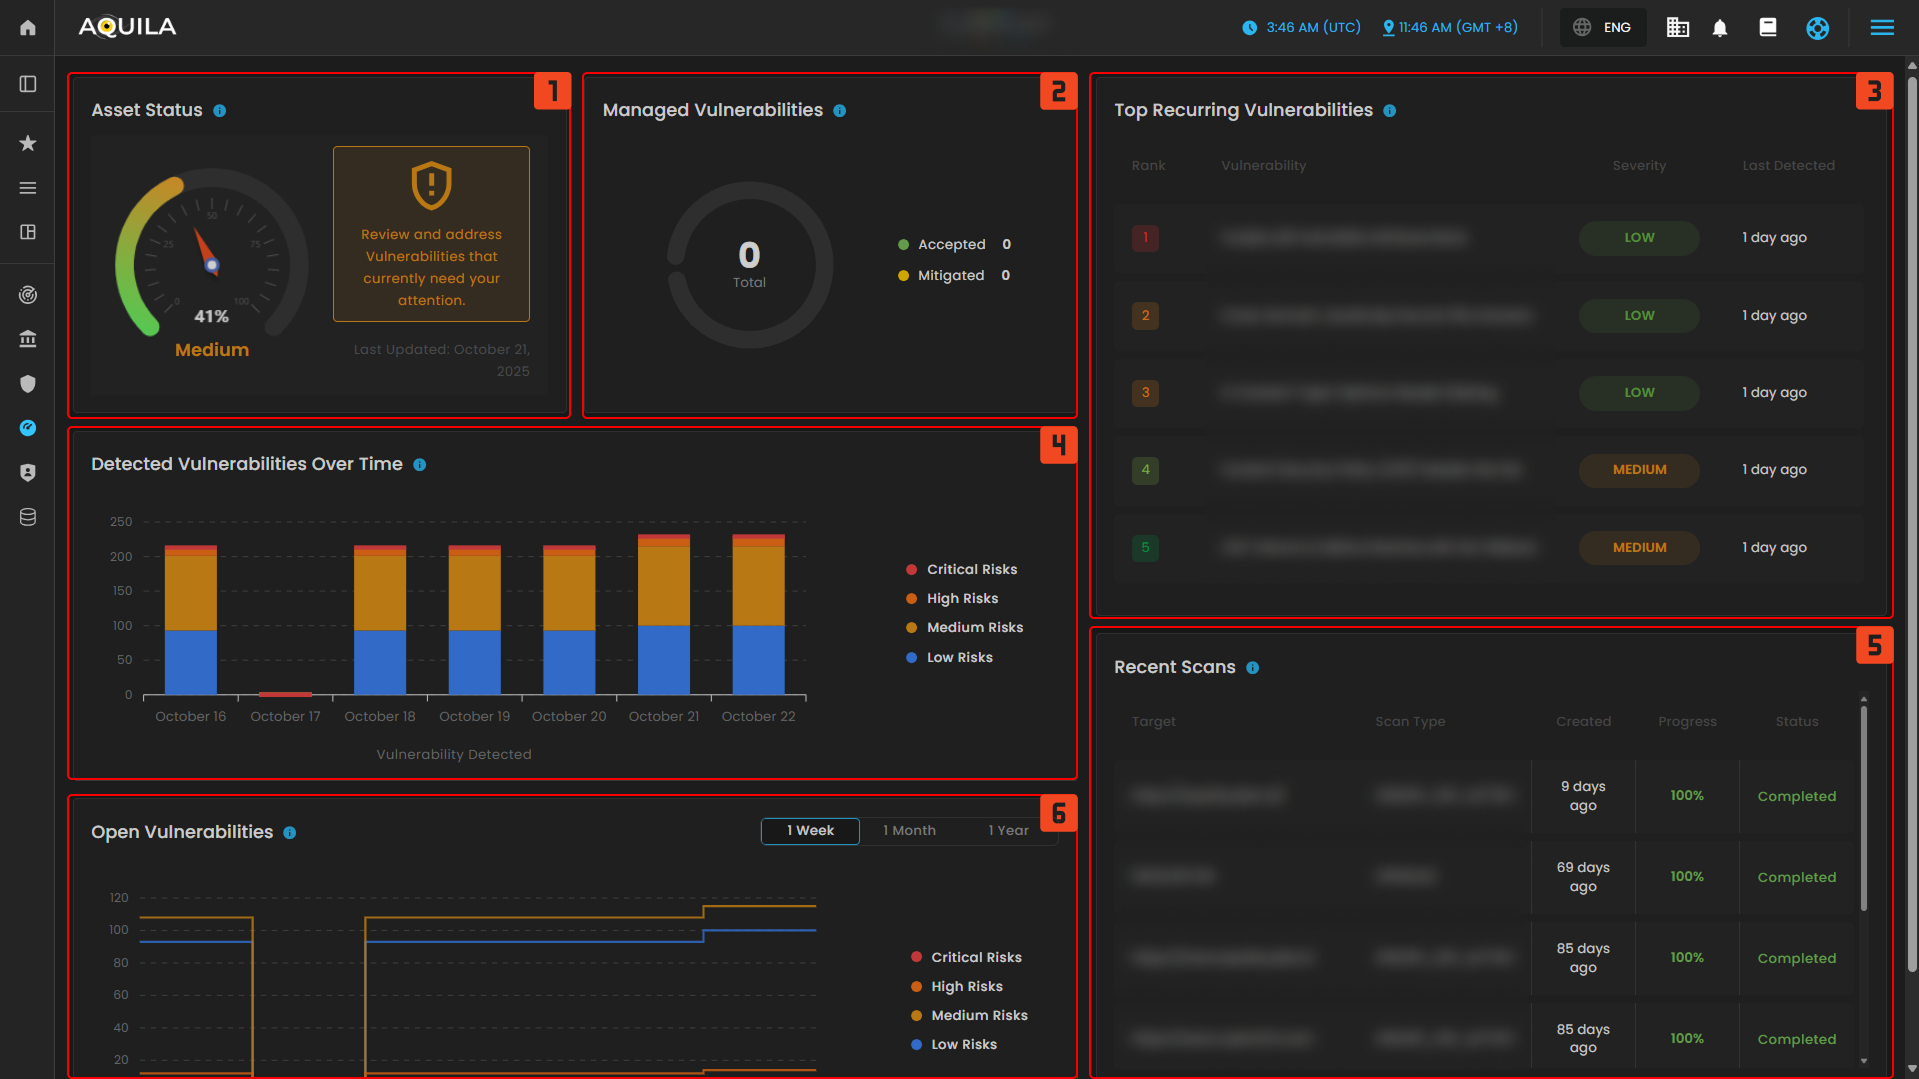
Uses of Dashboard Sections (1–6)
- Asset Status - how's the overall security health with a reminder to review and address vulnerabilities.
- Managed Vulnerabilities - displays the total accepted or mitigated issues to track resolved findings.
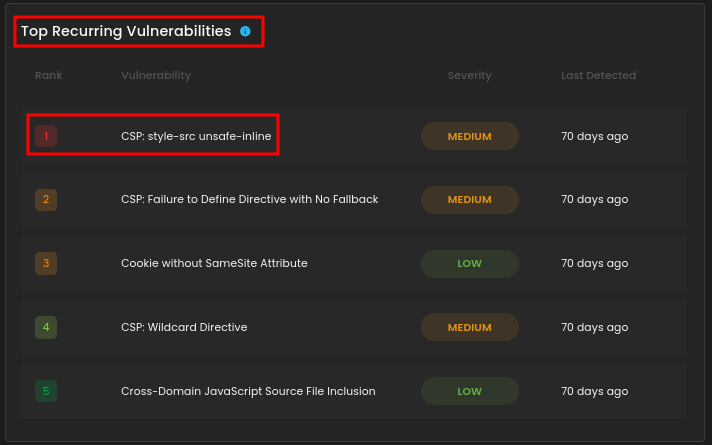
- Top Recurring Vulnerabilities - lists repeated issues such as CSP misconfigurations and missing cookie attributes, categorized by severity.
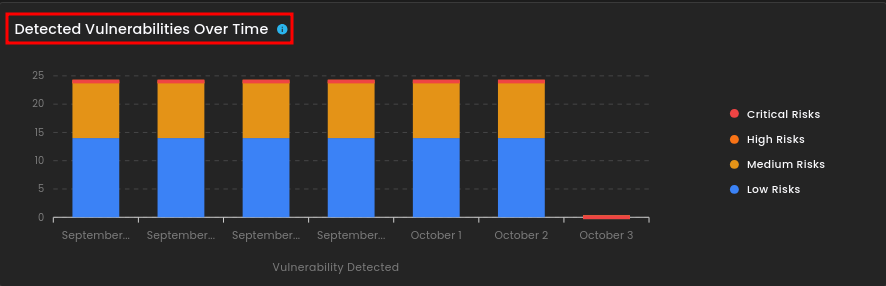
- Detected Vulnerabilities Over Time - graph tracks vulnerabilities across recent days, broken down by severity levels.
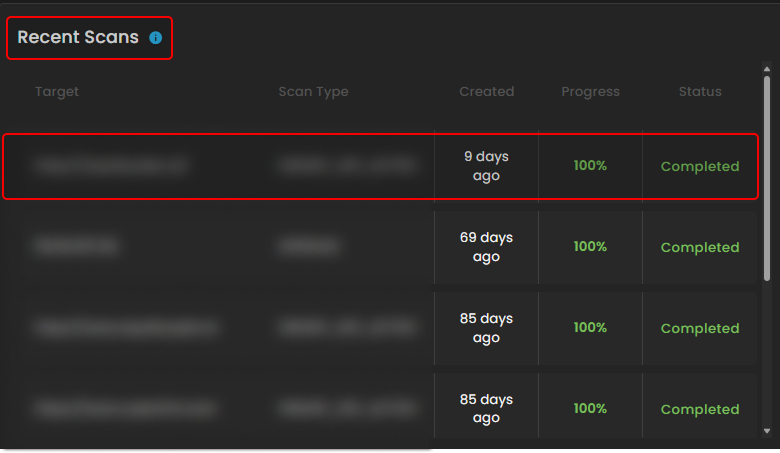
- Recent Scans - table shows the last tests performed, including their targets, scan types, progress, and status.
- Open Vulnerabilities - chart provides a line trend of unresolved risks over a selected time frame.
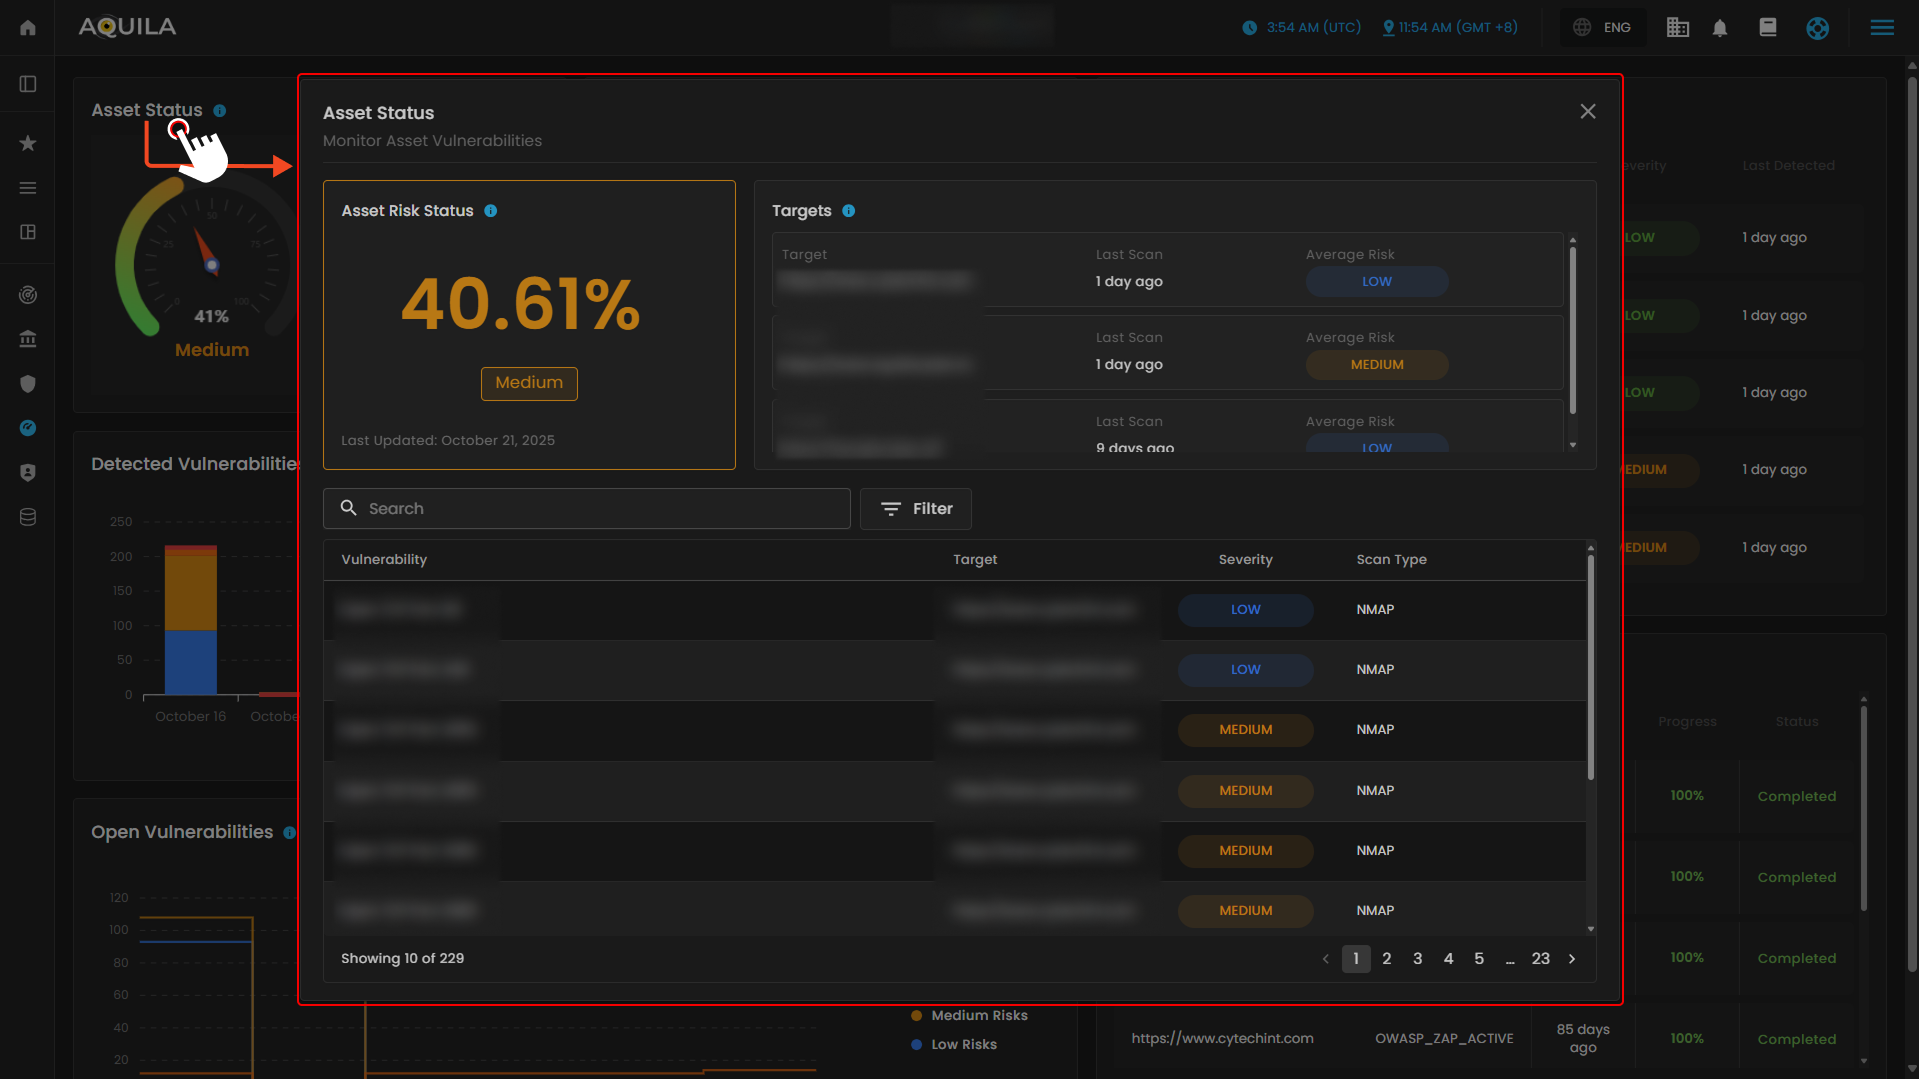
1. Asset Status
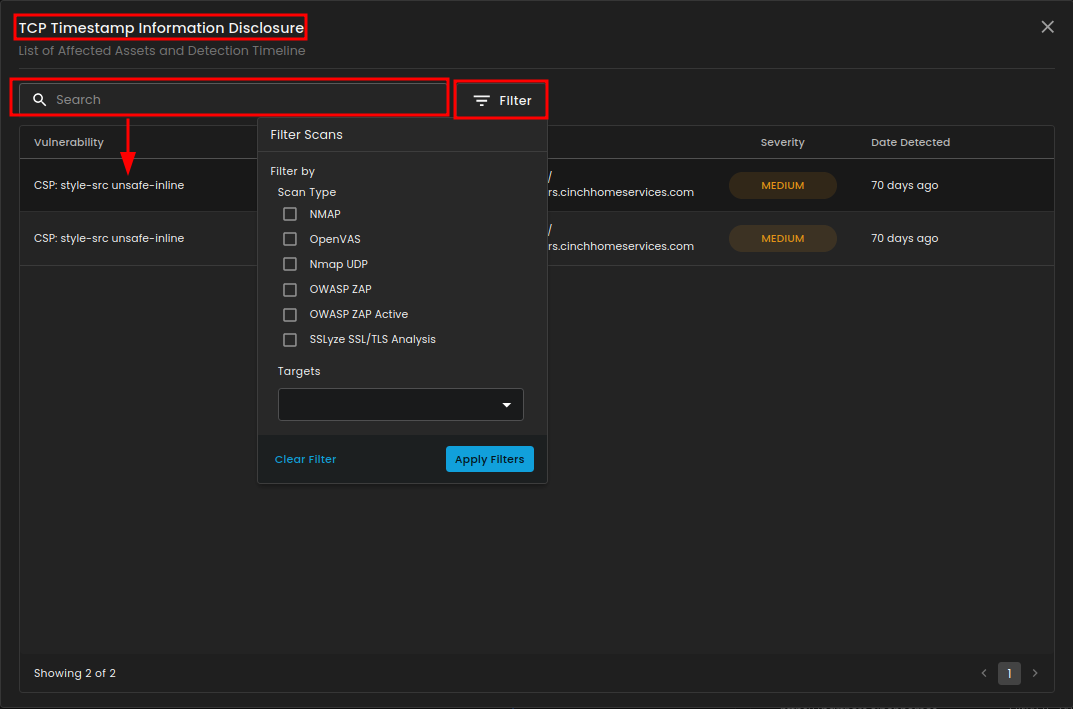
This section is the Asset Status view for monitoring asset vulnerabilities. It shows the overall asset risk level, the specific target being assessed, and its average risk rating based on scans. A detailed list of detected vulnerabilities is displayed, including the issue name, affected target, severity level, and the scan tool used. It also includes options to search, filter, and navigate through multiple pages of vulnerabilities, giving both a high-level risk score and a detailed breakdown of findings for remediation.
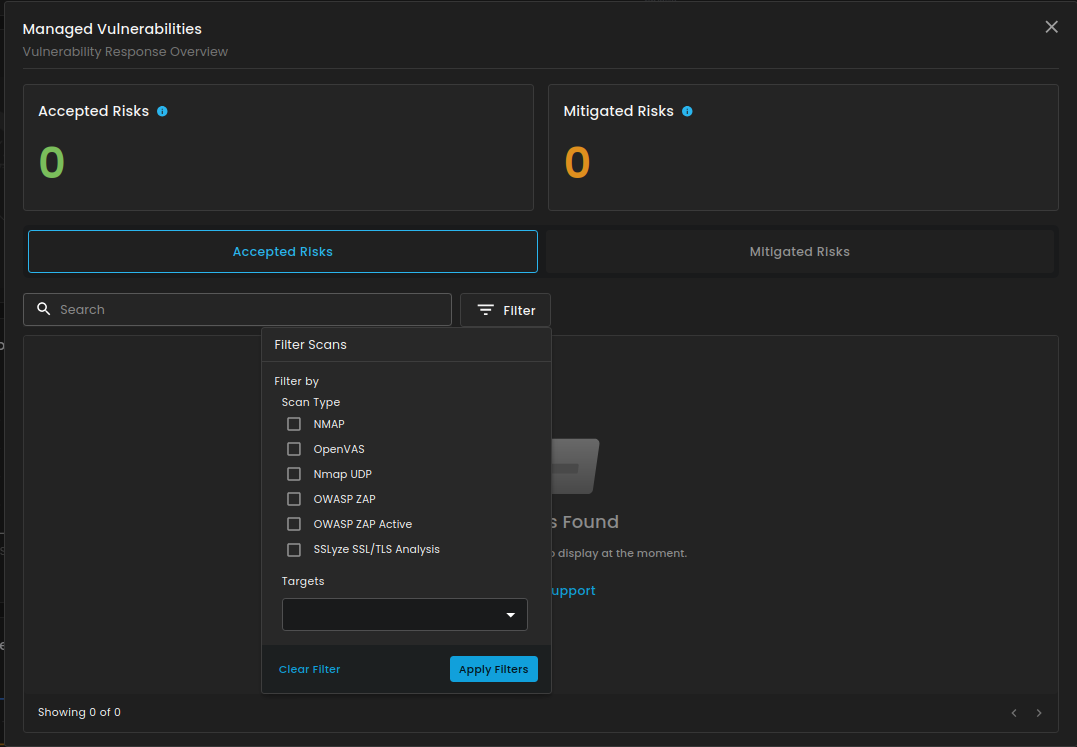
2. Managed Vulnerabilities
This section will show you the risk that were reviewed and accepted based on organization risk appetite and mitigated risk, risks that have been addressed through remediation task. The search box in this section is designed to help users quickly locate specific vulnerabilities or scan results. It is paired with a filter option that allows narrowing results based on scan type (such as NMAP, OpenVAS, OWASP ZAP, or SSLyze) and selected targets. This makes it easier to focus on particular findings, streamline analysis, and avoid manually going through long vulnerability lists.
3. Top Recurring Vulnerabilities
This section displays the top recurring vulnerabilities, listing repeated security issues along with their severity and the last time they were detected, helping to identify and prioritize persistent risks.
4. Detected Vulnerabilities Over Time
This section displays the trend of detected vulnerabilities over time, categorized by severity levels such as critical, high, medium, and low risks. It helps visualize how vulnerabilities are distributed and monitored across different dates.
5. Recent Scans
This section shows the most recent scans performed, including the scan type, target, creation date, progress, and status. It helps track completed scans and ensures all tests were successfully executed.
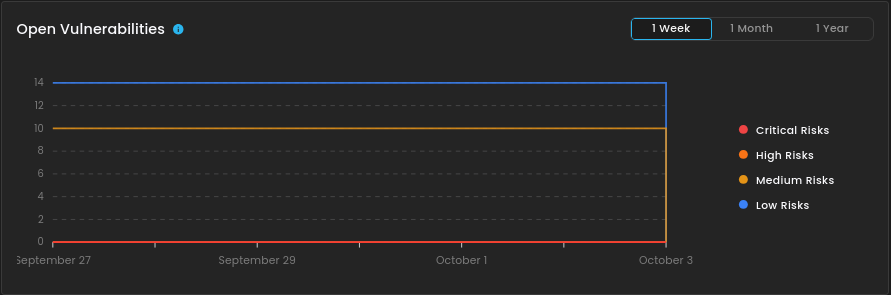
6. Open Vulnerabilities
This section displays the trend of open vulnerabilities over a selected time frame, categorized by severity levels such as critical, high, medium, and low risks. It helps monitor unresolved security issues and track their persistence over time.
" Scan (Sub-module)" - Virtual Penetration Testing (Module)
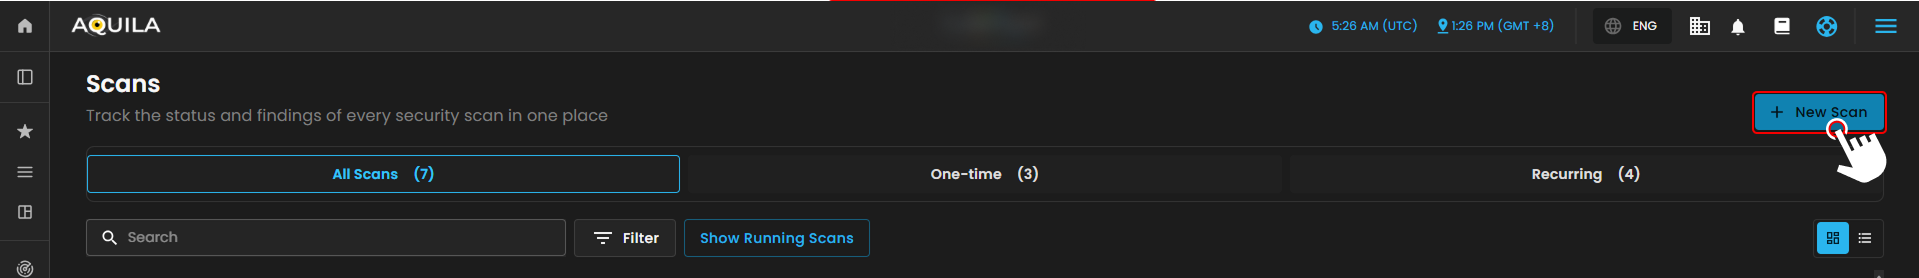
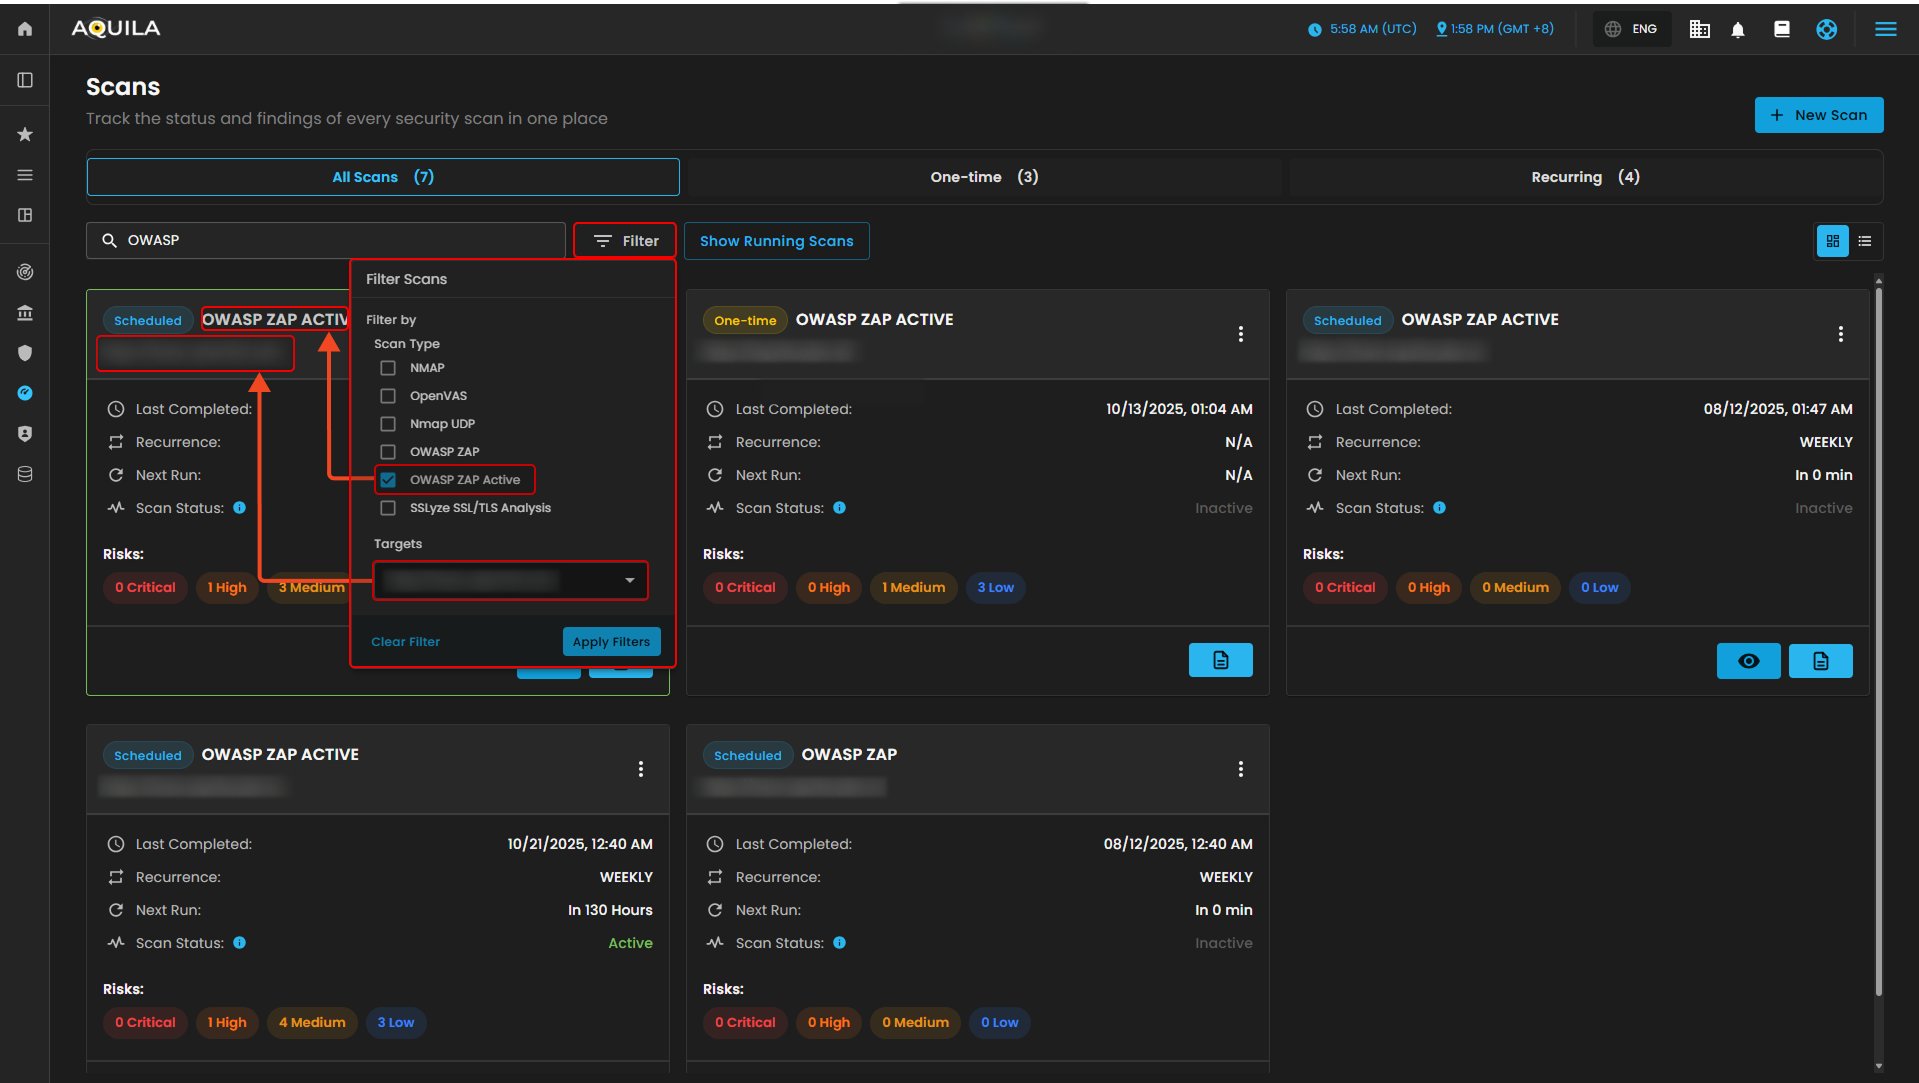
This module serves as the Scans dashboard, where users can view and manage all security scans in one place. It displays details such as scan type, target, last completed date, recurrence, next run, and current status, along with a risk summary categorized into Critical, High, Medium, and Low. Users can search, filter, or view running scans for easier tracking, and the New Scan button allows quick creation of a new test.
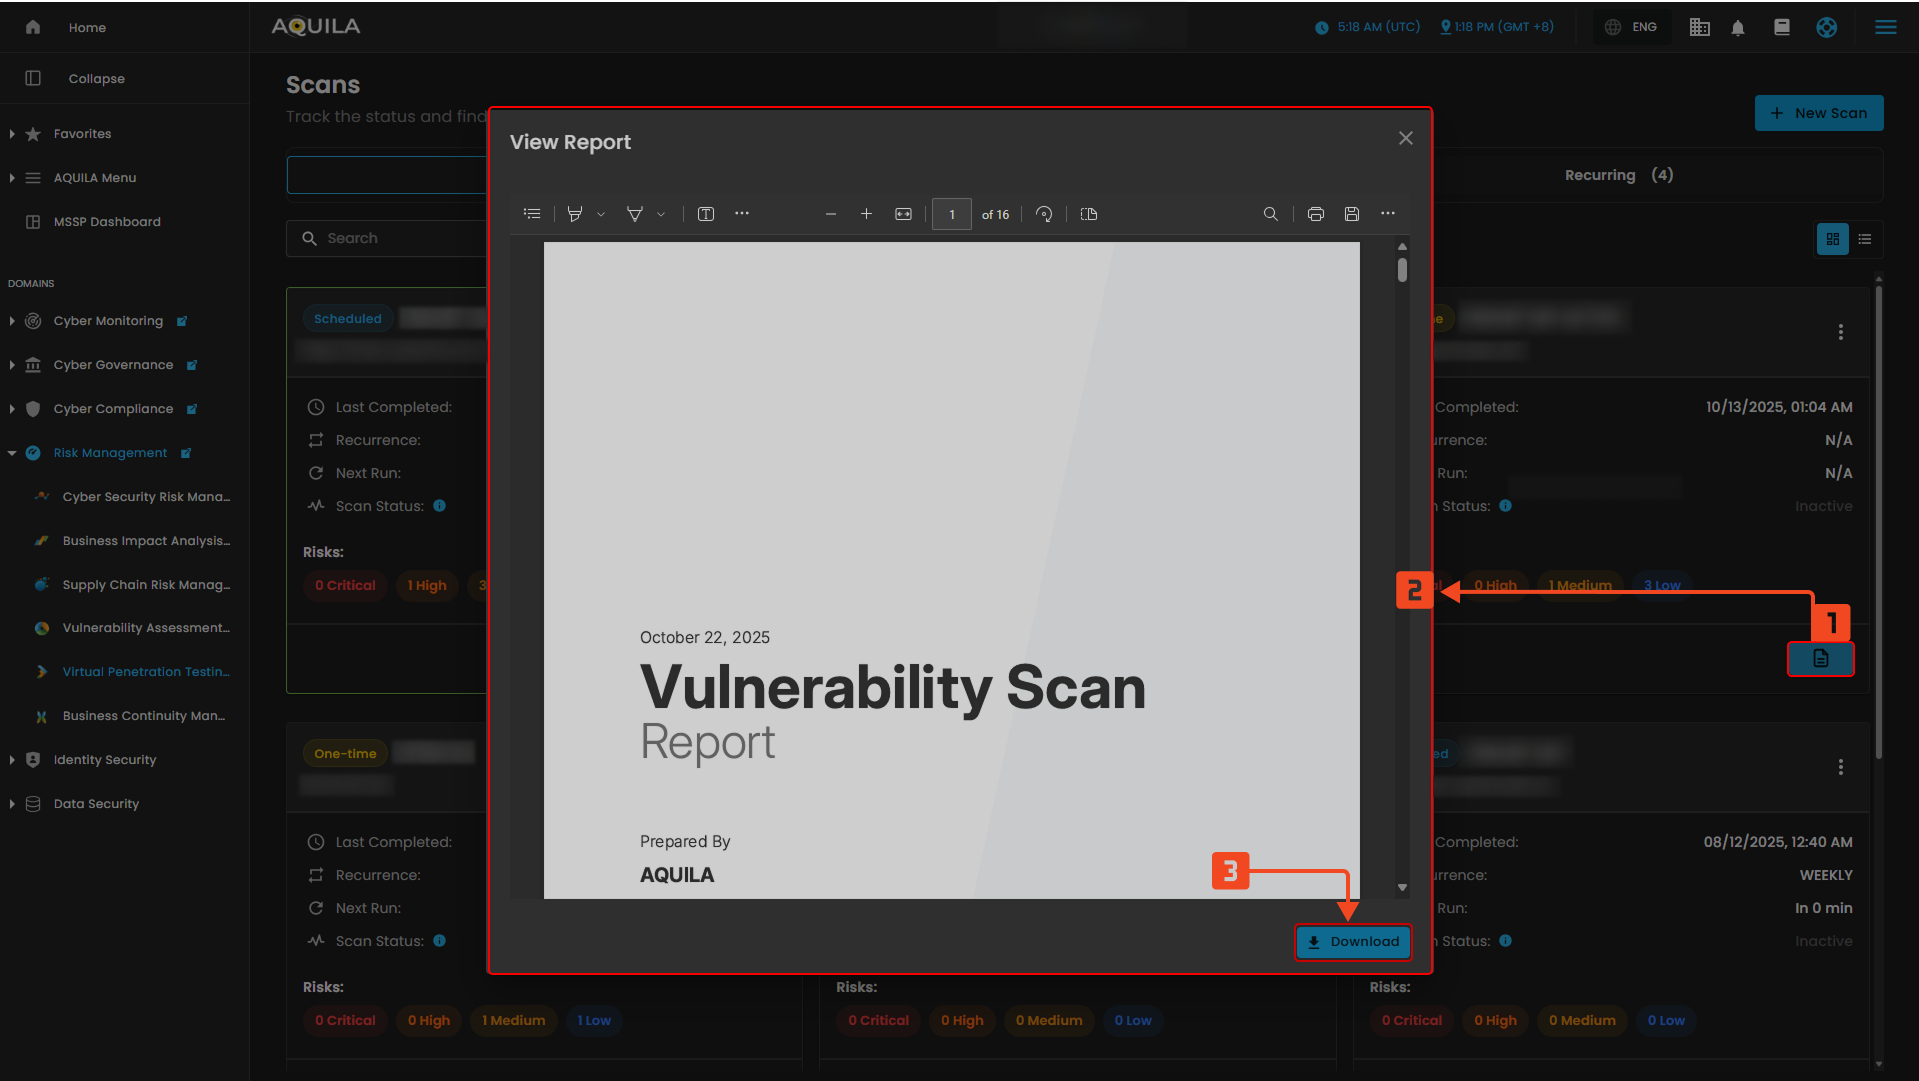
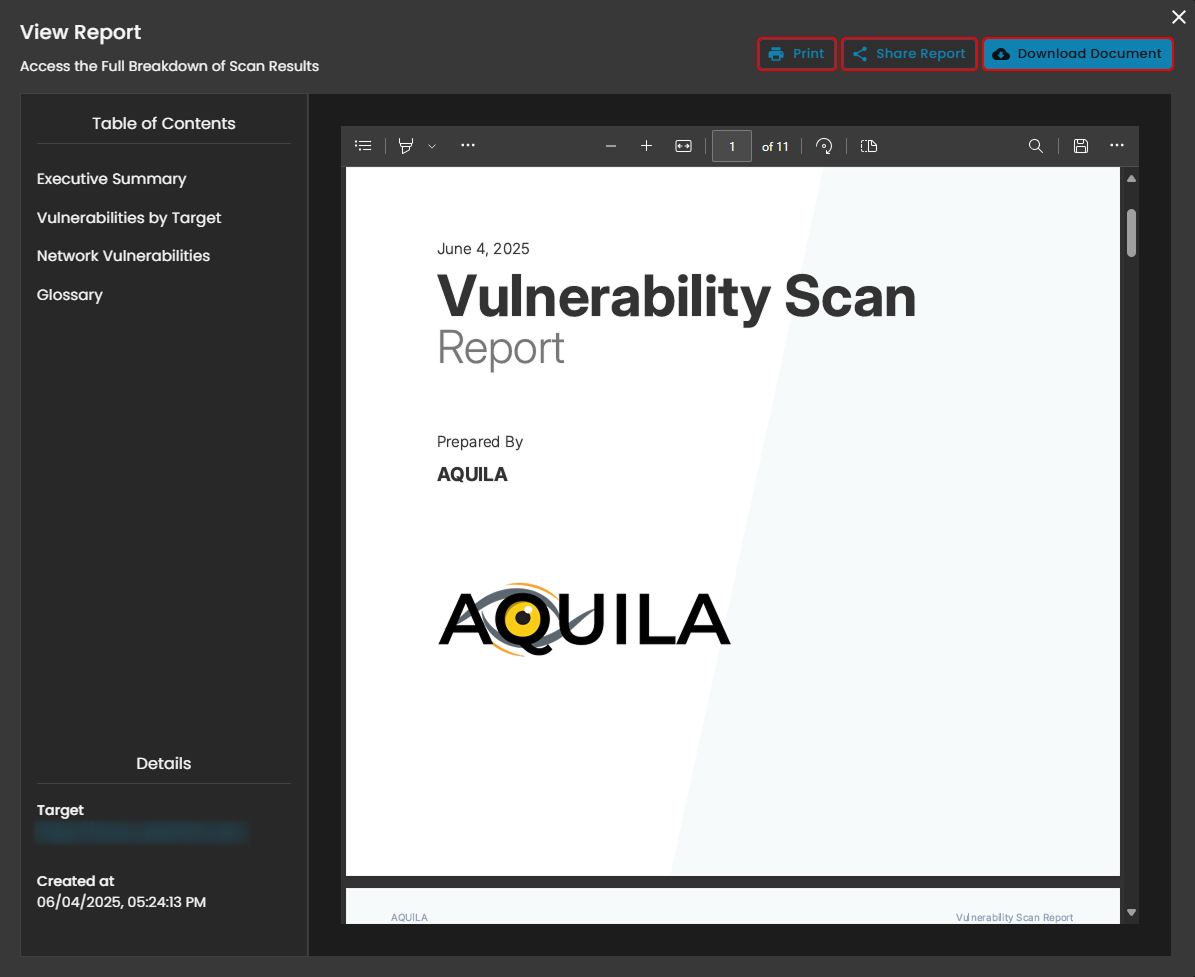
When you click View Report on the Scan, a small window titled View Report will appear, allowing you to download the file.
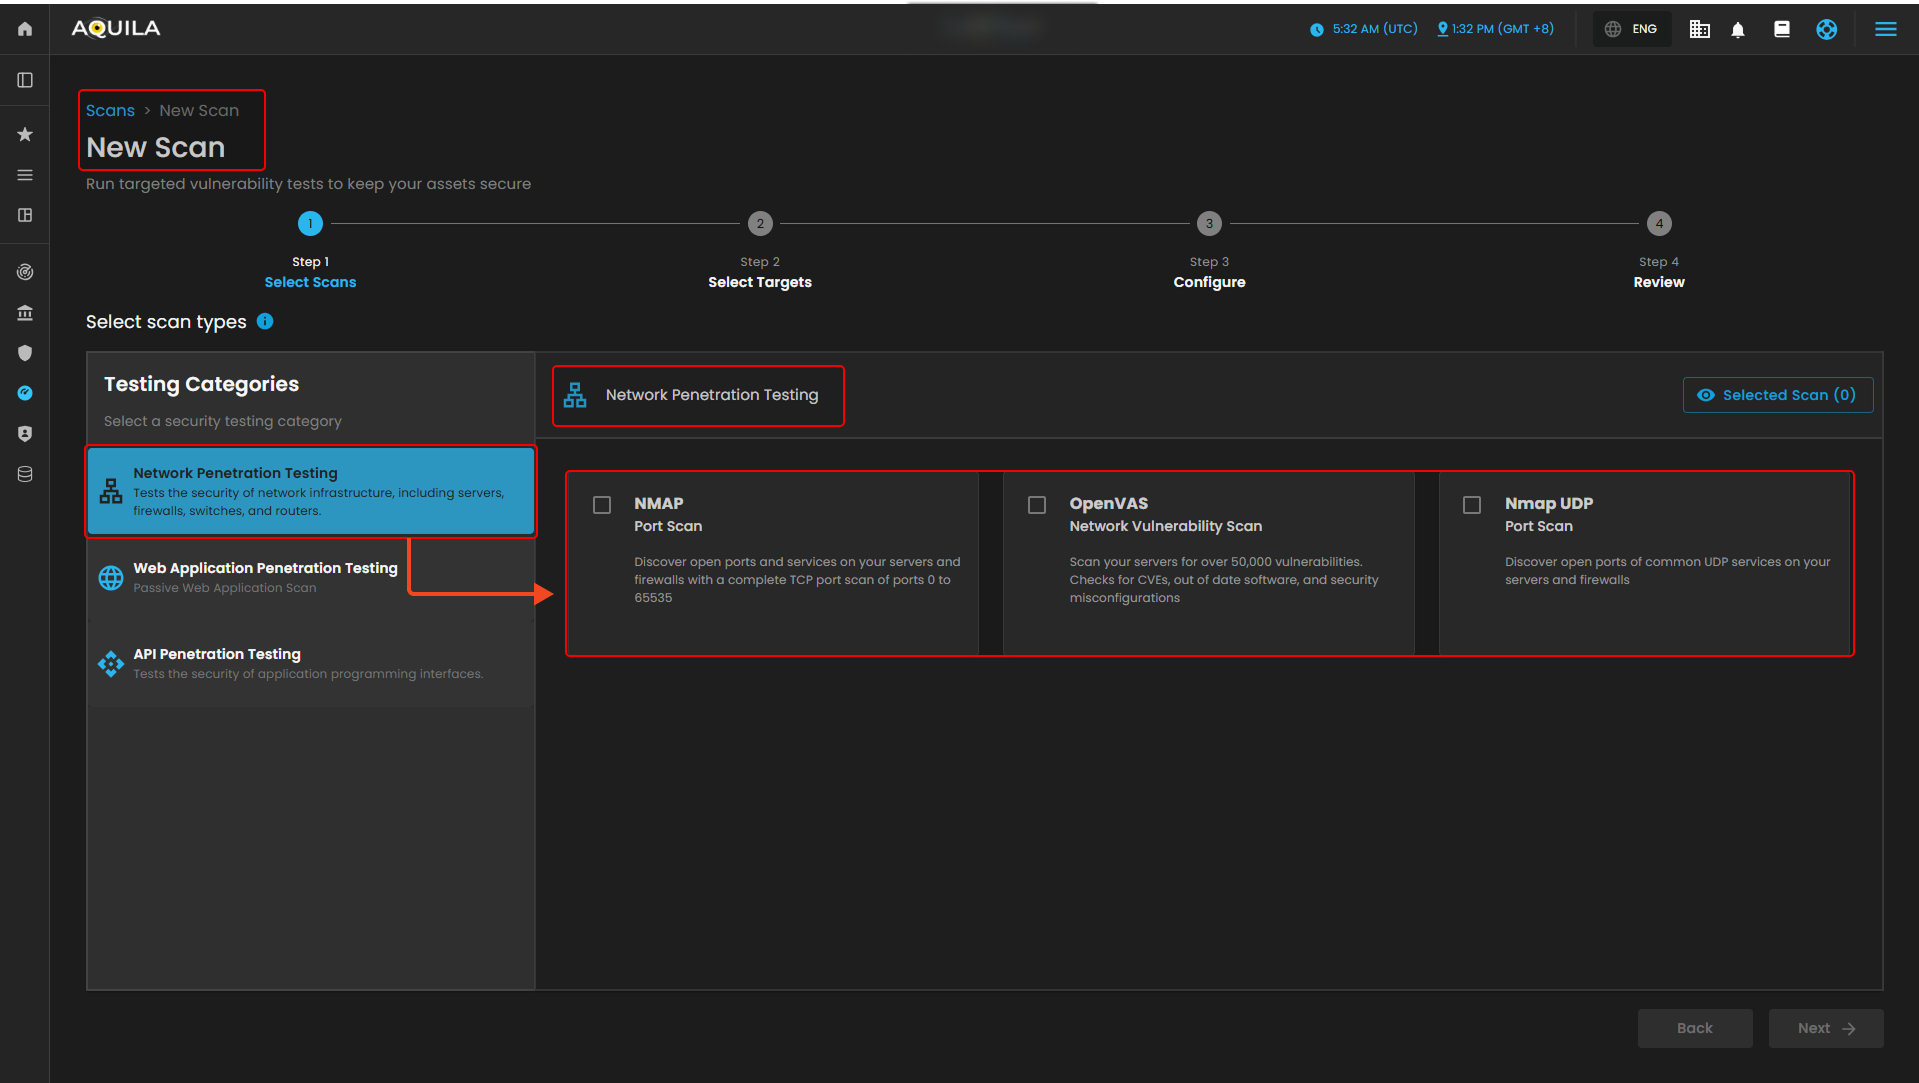
New Scan
This New Scan section is the first step in creating a new scan, where you select the type of security test to run. You can choose from categories like Network, Web Application, or API Penetration Testing. For Network Penetration Testing, options include NMAP (TCP port scan), OpenVAS (vulnerability scan), and Nmap UDP (UDP port scan). A progress bar shows the steps—Select Scans, Select Targets, Configure, and Review—while the Selected Scan counter and navigation buttons help you track and move through the process.
Network Penetration Testing
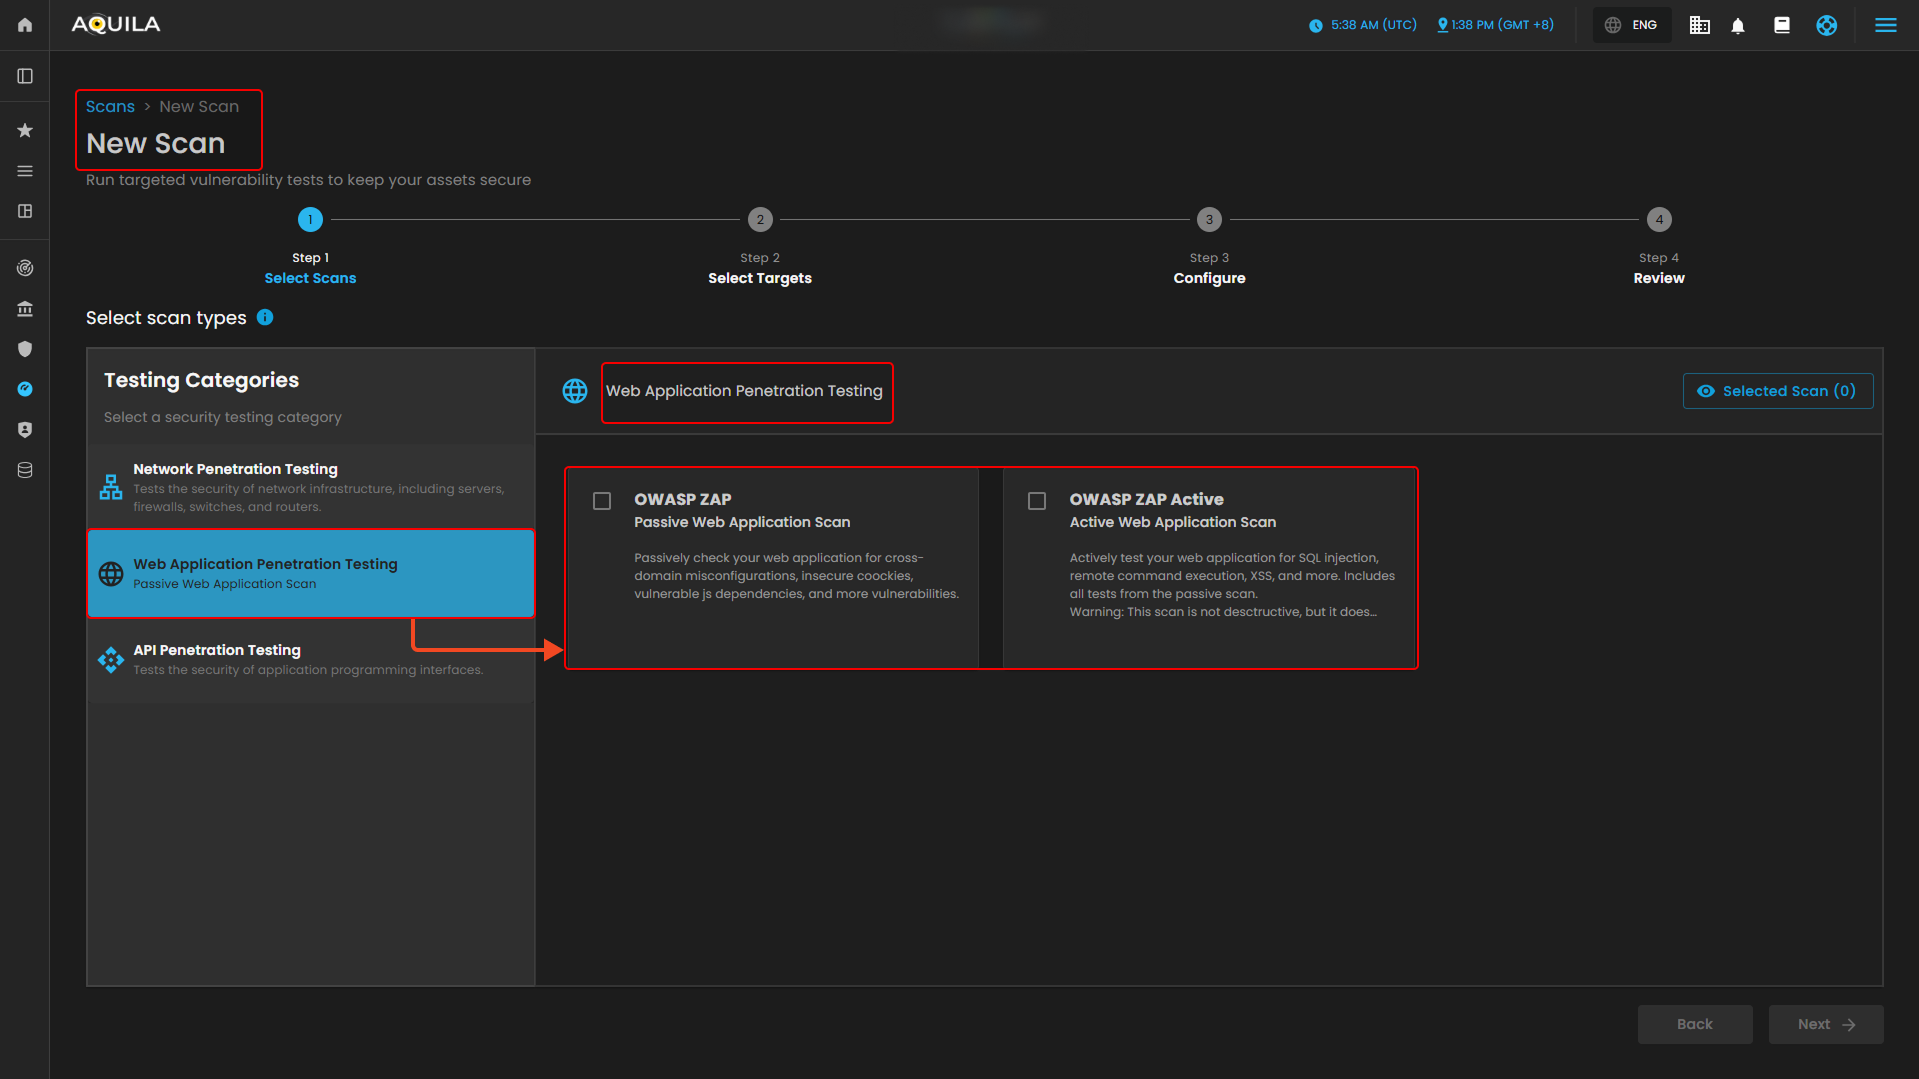
Web Application Penetration Testing
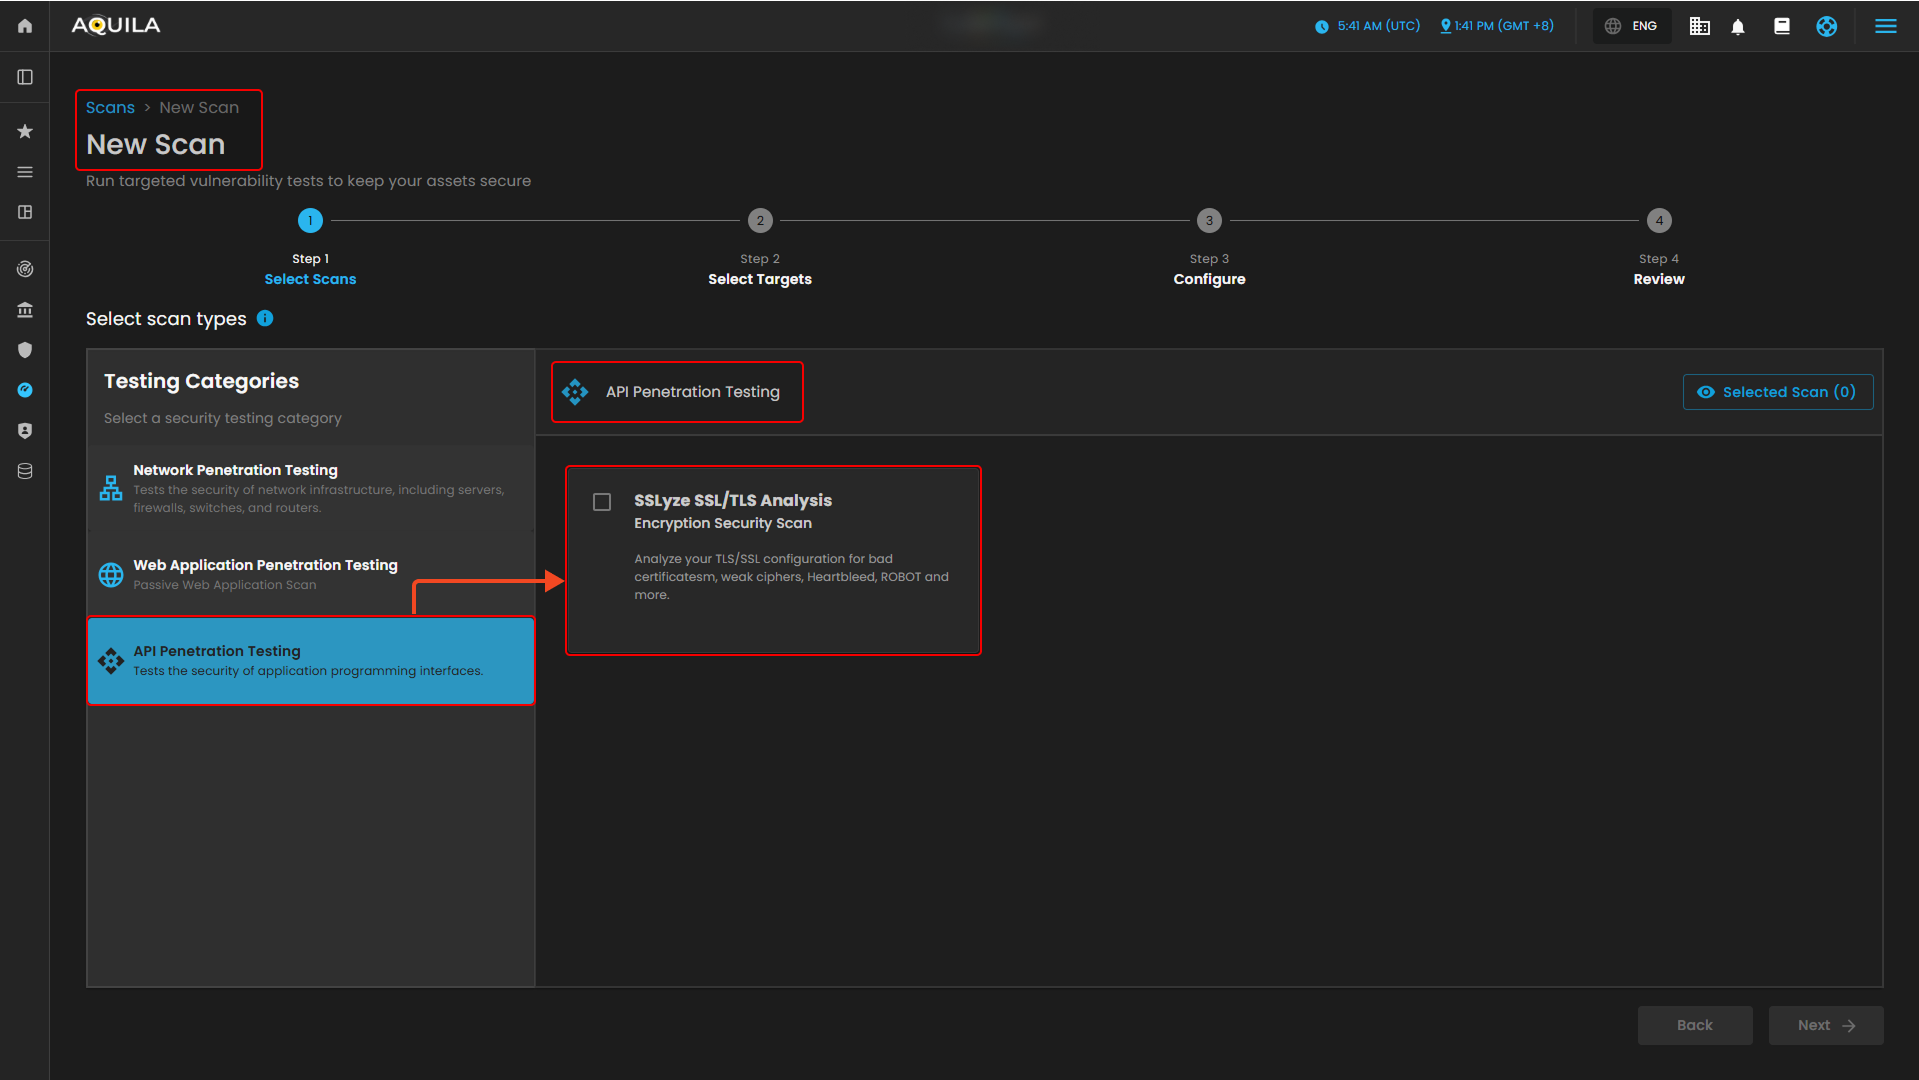
API Penetration Testing
1. Search Bar - Allowing you to look specific scans.
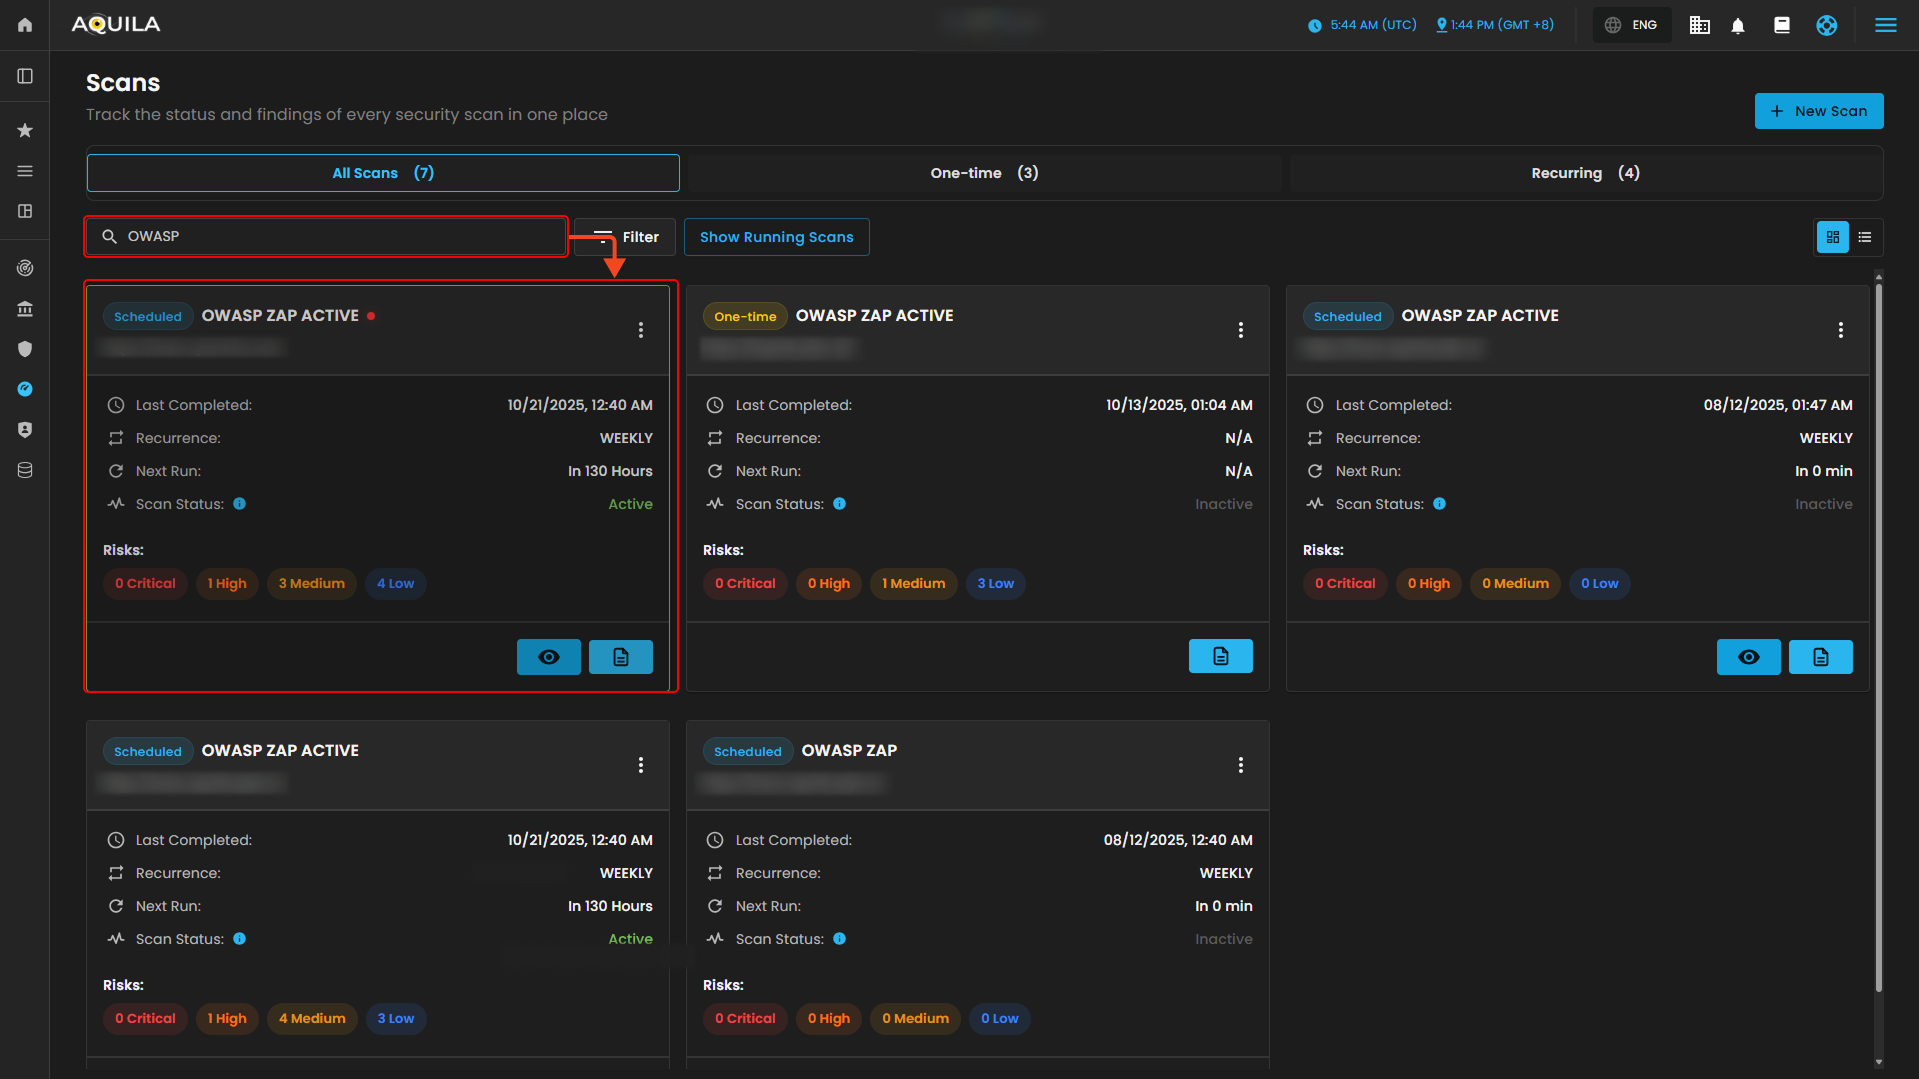
2. Filter - Allows users to refine and organize scan results based on specific criteria. You can filter by scan type (e.g., NMAP, OpenVAS, Nmap UDP, OWASP ZAP, SSLyze) or by target URL/domain to quickly locate relevant scans. The options Apply Filters and Clear Filter provide flexibility—either narrowing down results to the chosen criteria or resetting the view to show all scans. This makes it easier to manage and review scans without manually searching through the entire list.
" Reports (Sub-module)" - Virtual Penetration Testing (Module)
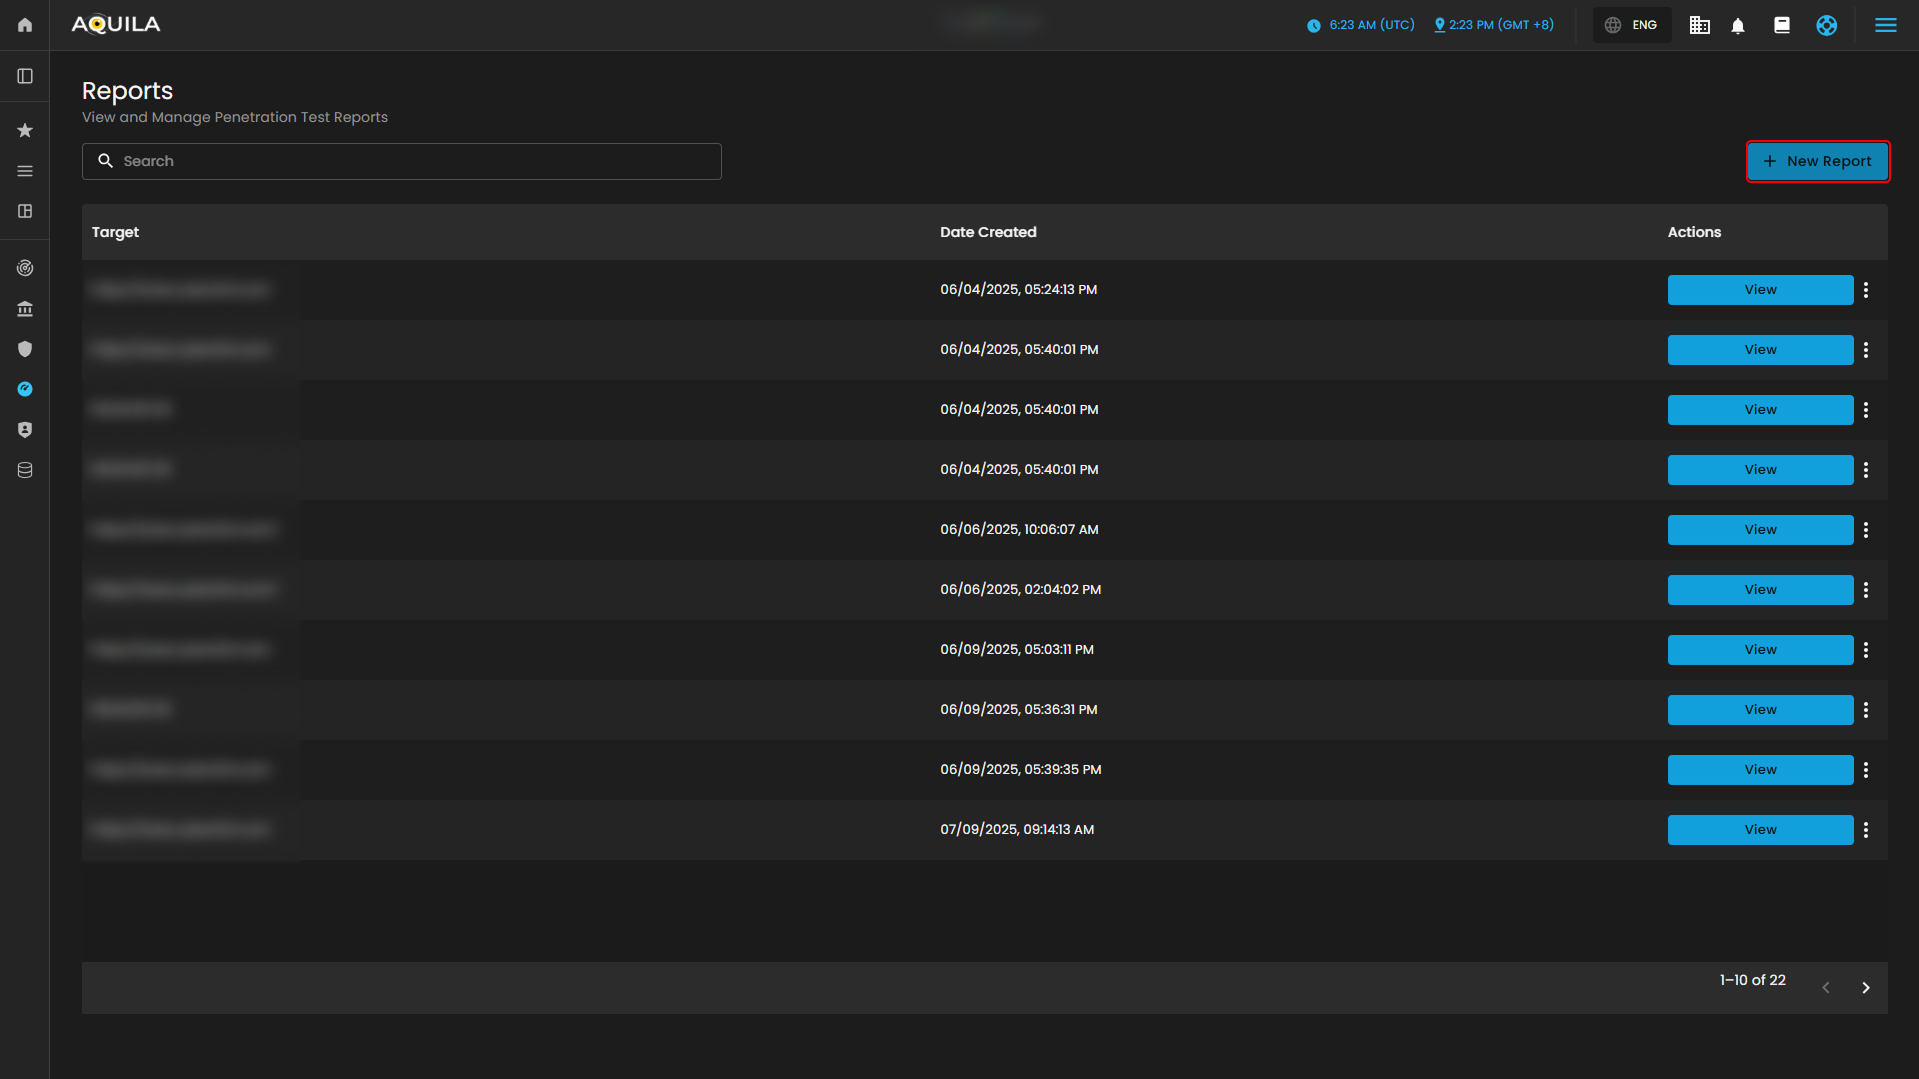
This section shows the Reports Overview page of the AQUILA platform, presenting a list of completed scans along with details such as the scan type, target URL, last run date, recurrence information, and detected risk levels.
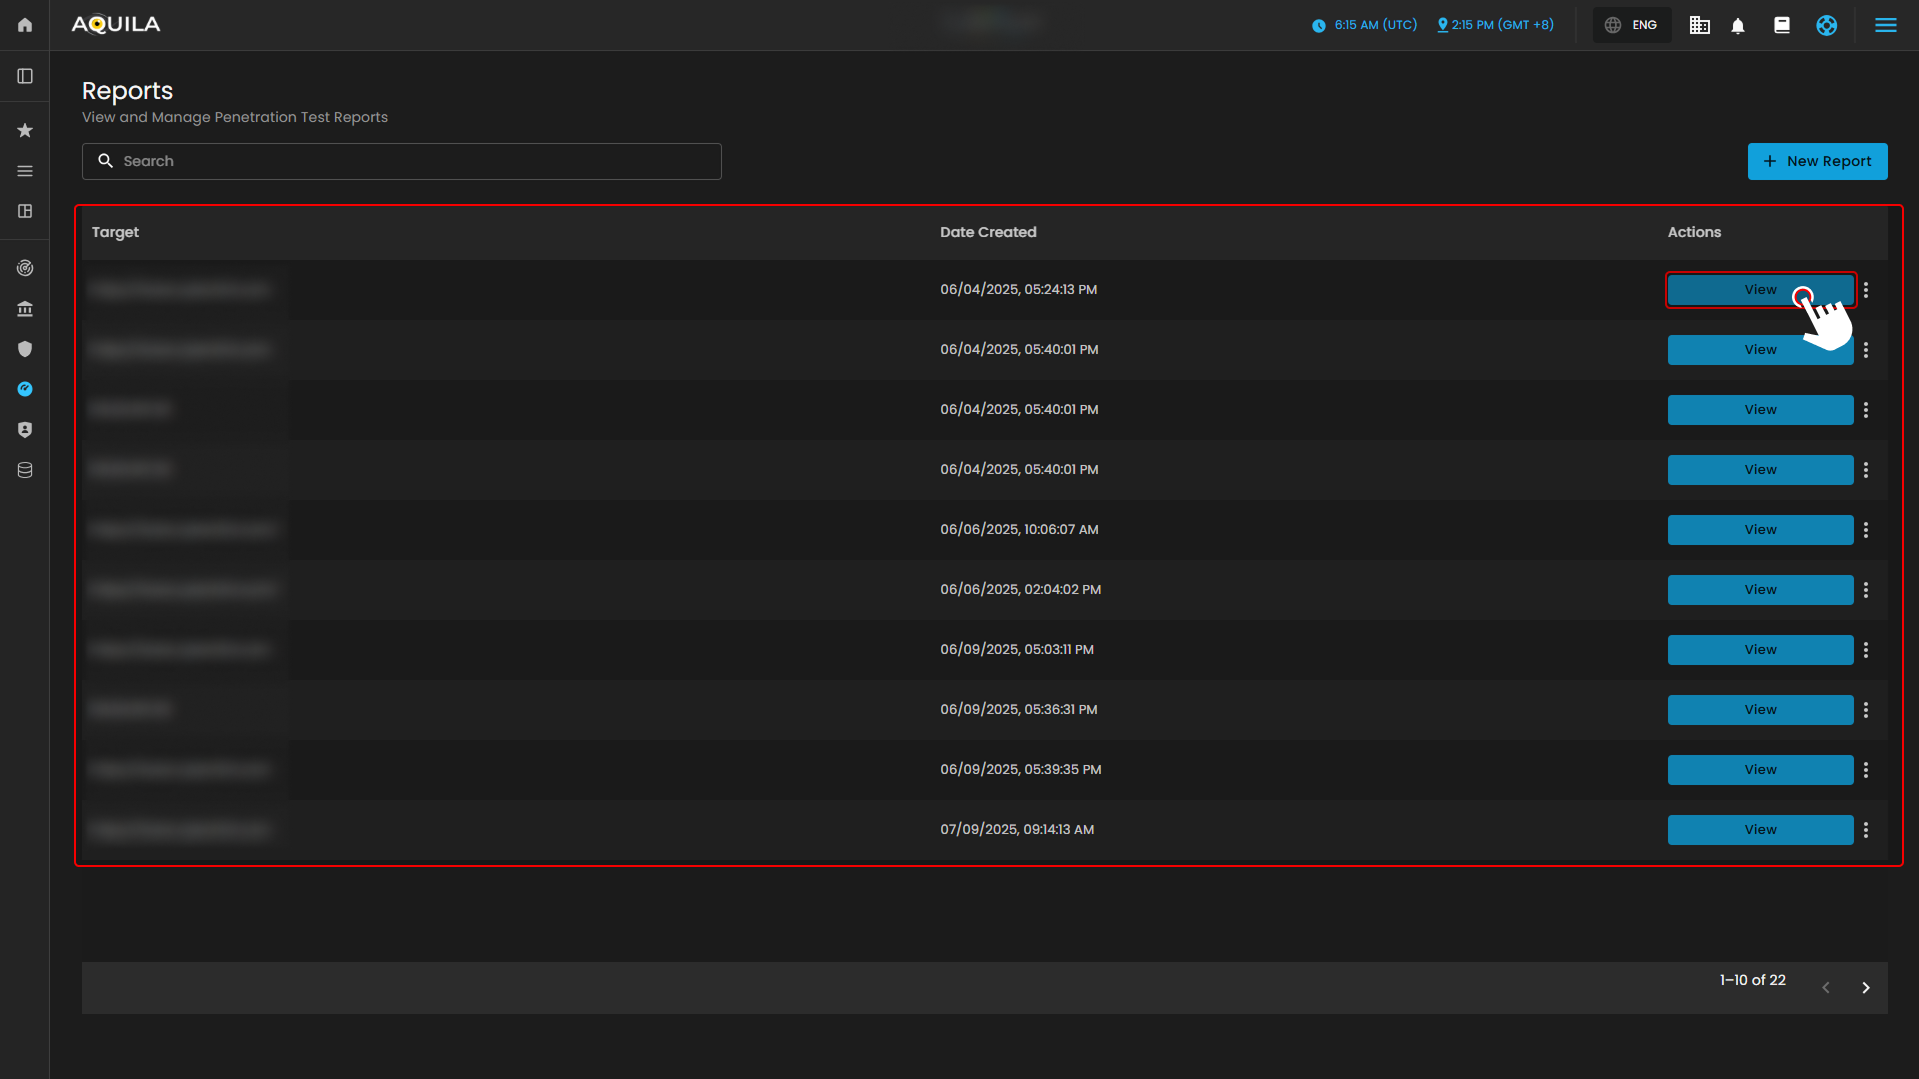
This section displays the Reports list in AQUILA, showing all generated penetration test reports. Each entry includes the target URL, the date the report was created, and an Action button labeled View that allows users to open, share report, print and download the detailed results of a specific report.
1. New Report
This section displays the Reports module in the AQUILA platform. It allows users to view and manage penetration test reports. The page lists all available reports with details such as target URLs and creation dates. Users can quickly search for specific reports using the search bar or create a new report using the “New Report” button. When creating a new report, users go through a step-by-step process — selecting scanned targets and providing report information before generating the final report.
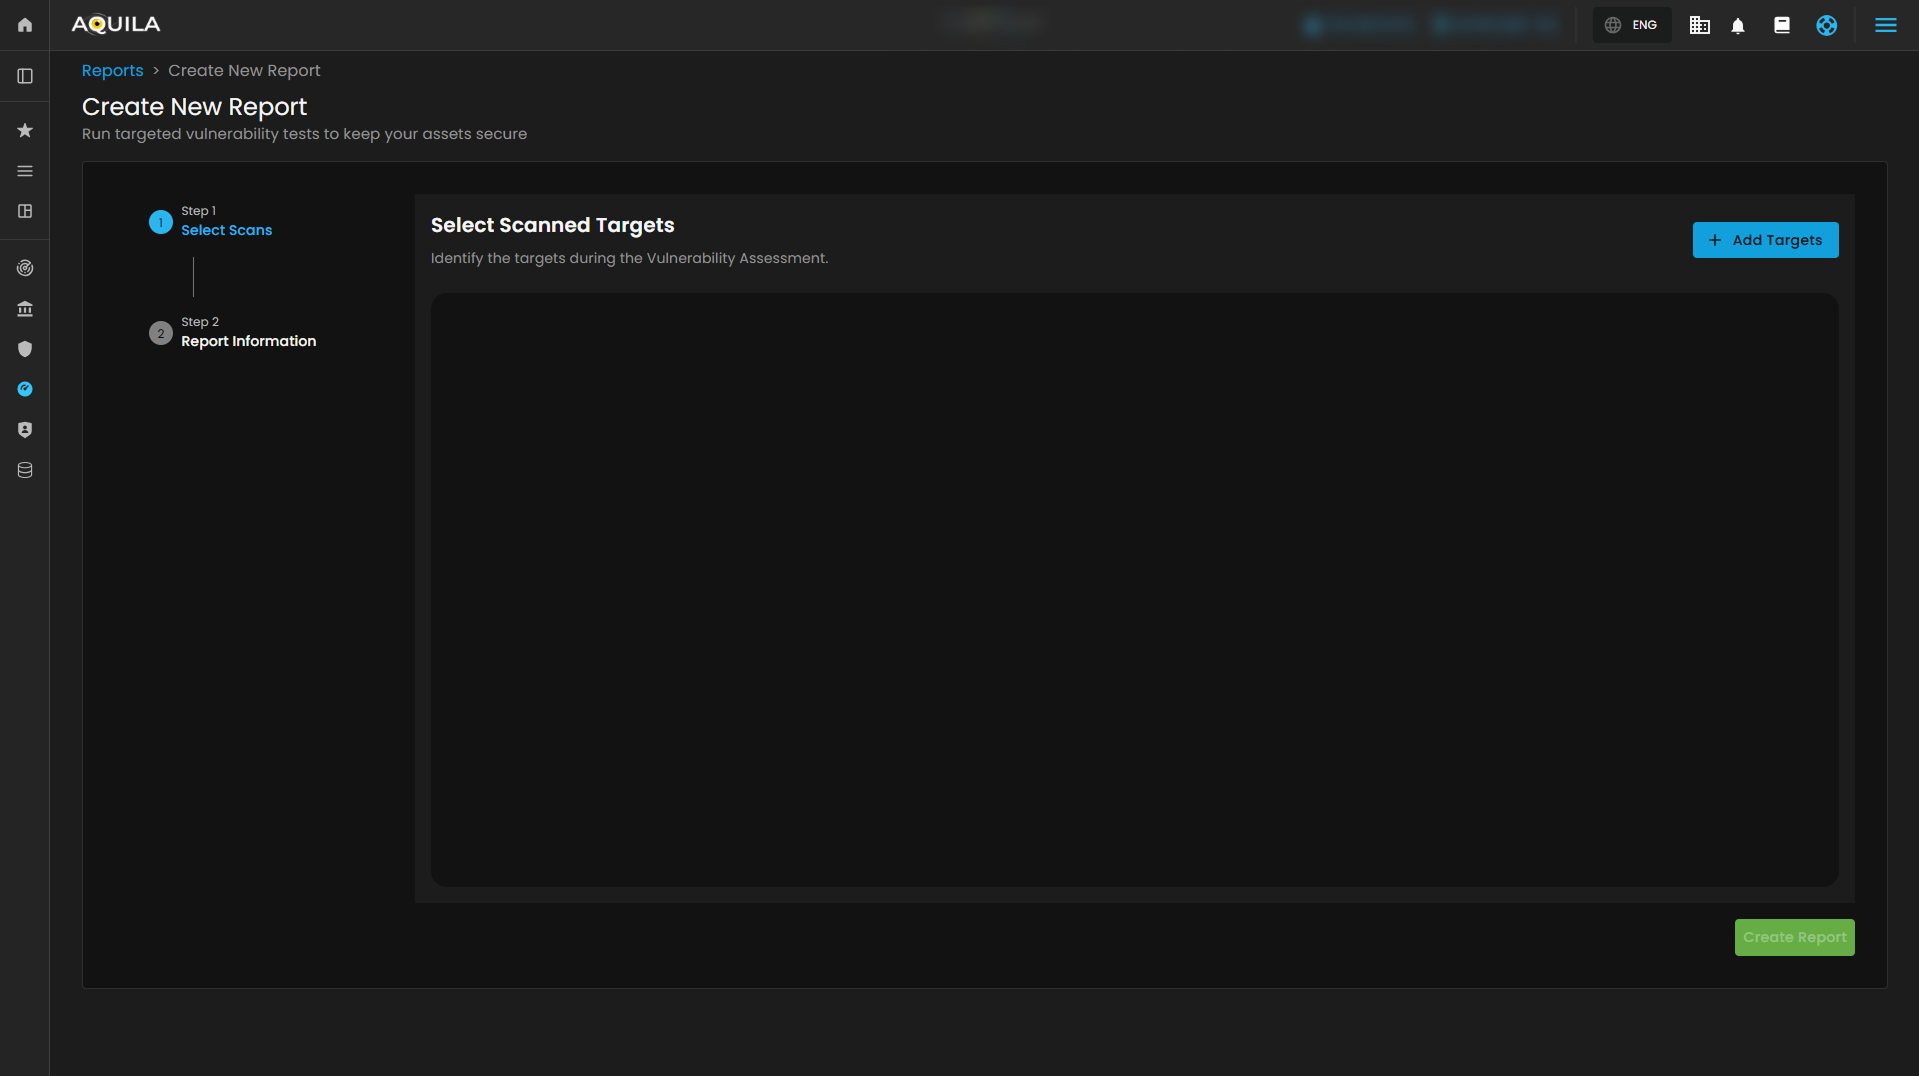
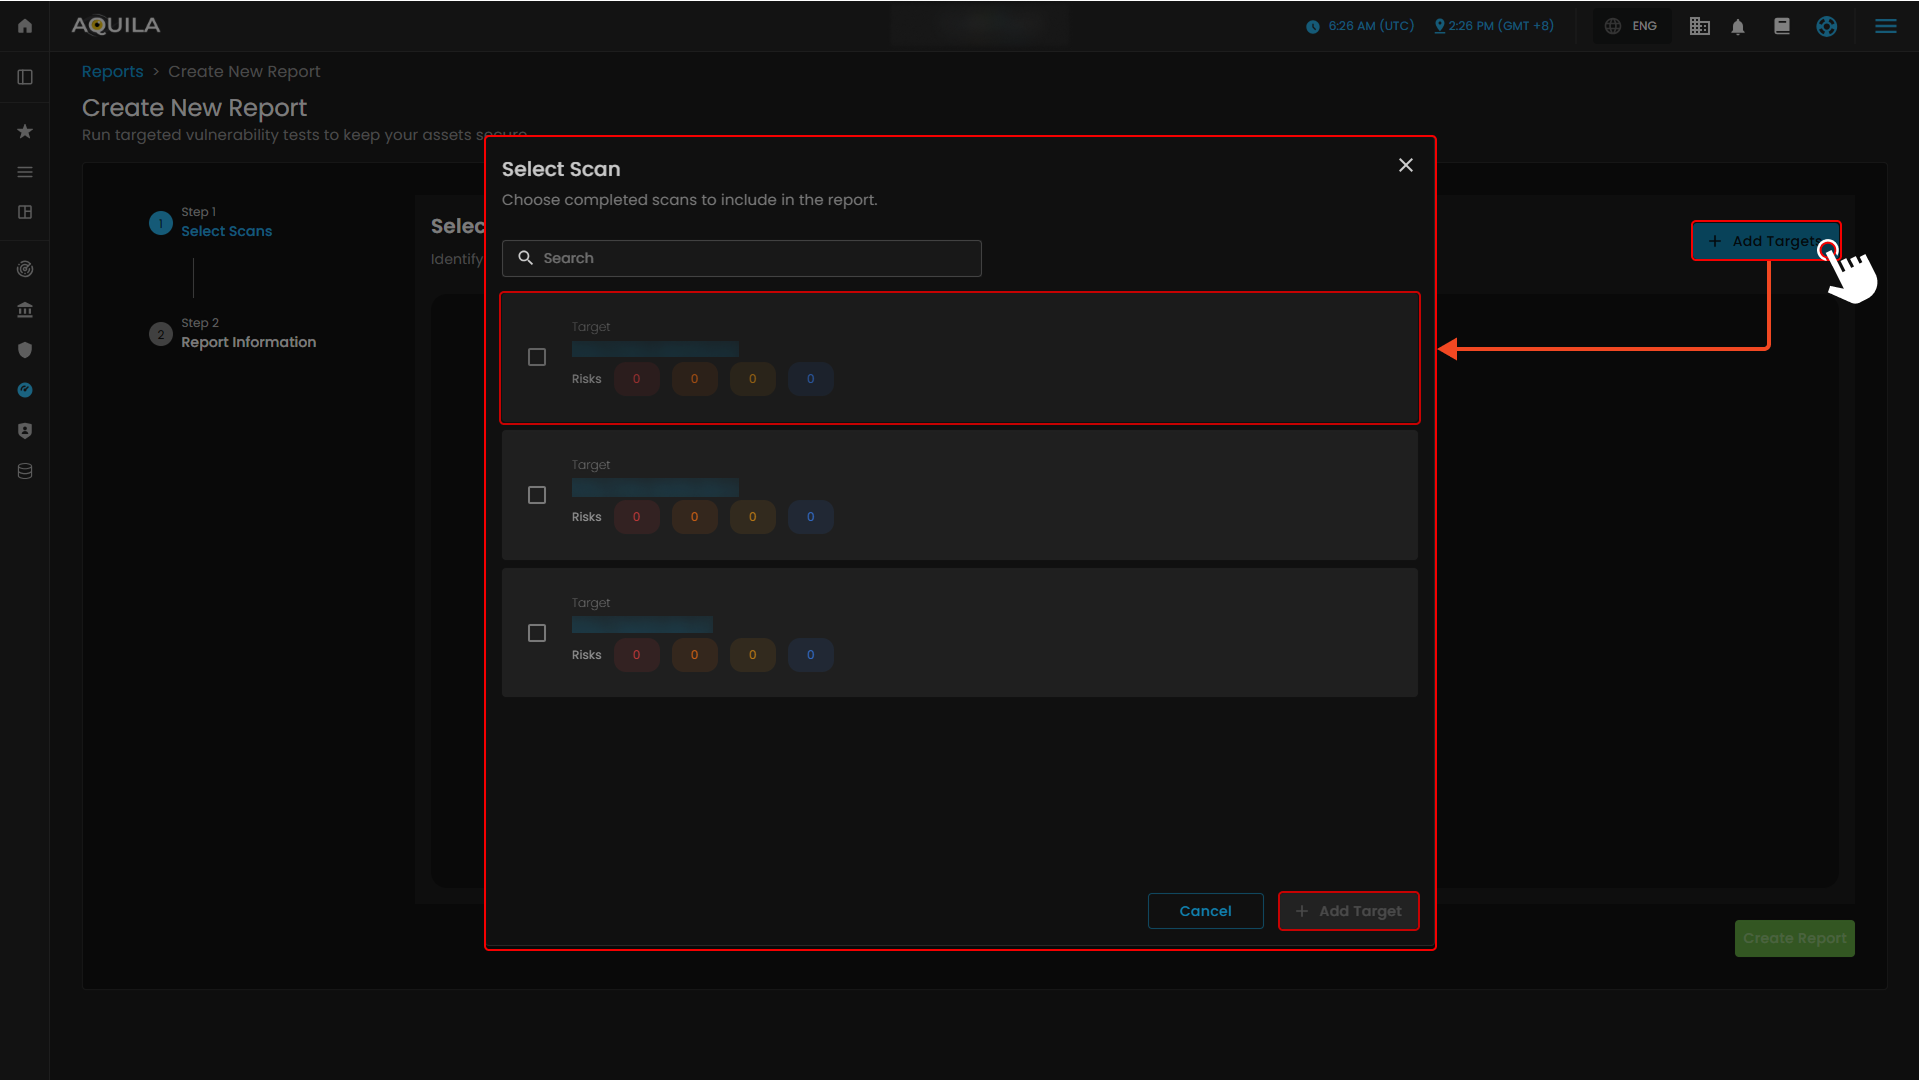
1.1 Create New Report - "Add Targets"
This section lets users select completed scans to include in a report. The search bar helps find specific scans, and users can check targets from the list to include them. After selecting, clicking Add Target confirms and adds the chosen scans to the report.
If you need further assistance, kindly contact support@cytechint.com for prompt assistance and guidance.
No comments to display
No comments to display