Endpoint Detection and Response (EDR)
Overview:
The EDR Module helps protect your environment by continuously monitoring endpoints for suspicious activity and malware. It provides real-time detection, endpoint isolation, and detailed event tracking to ensure your devices remain secure and compliant.
Key Features:
- Endpoint Detection & Response: Real-time threat detection with endpoint isolation capabilities.
-
Managed Endpoint Monitoring: Track online, offline, and unhealthy endpoints.
-
Authentication Tracking: Monitor successful and failed authentication attempts.
-
Event Logging: Detailed event activity logs to analyze endpoint behavior.
-
Recurring Offender Identification: Detect repeated threats for proactive response.
Pre-requisites
- Access to CyTech - AQUILA
-
Only users assigned the "Owner" or "Admin" role can access the Control Panel page within this module.
-

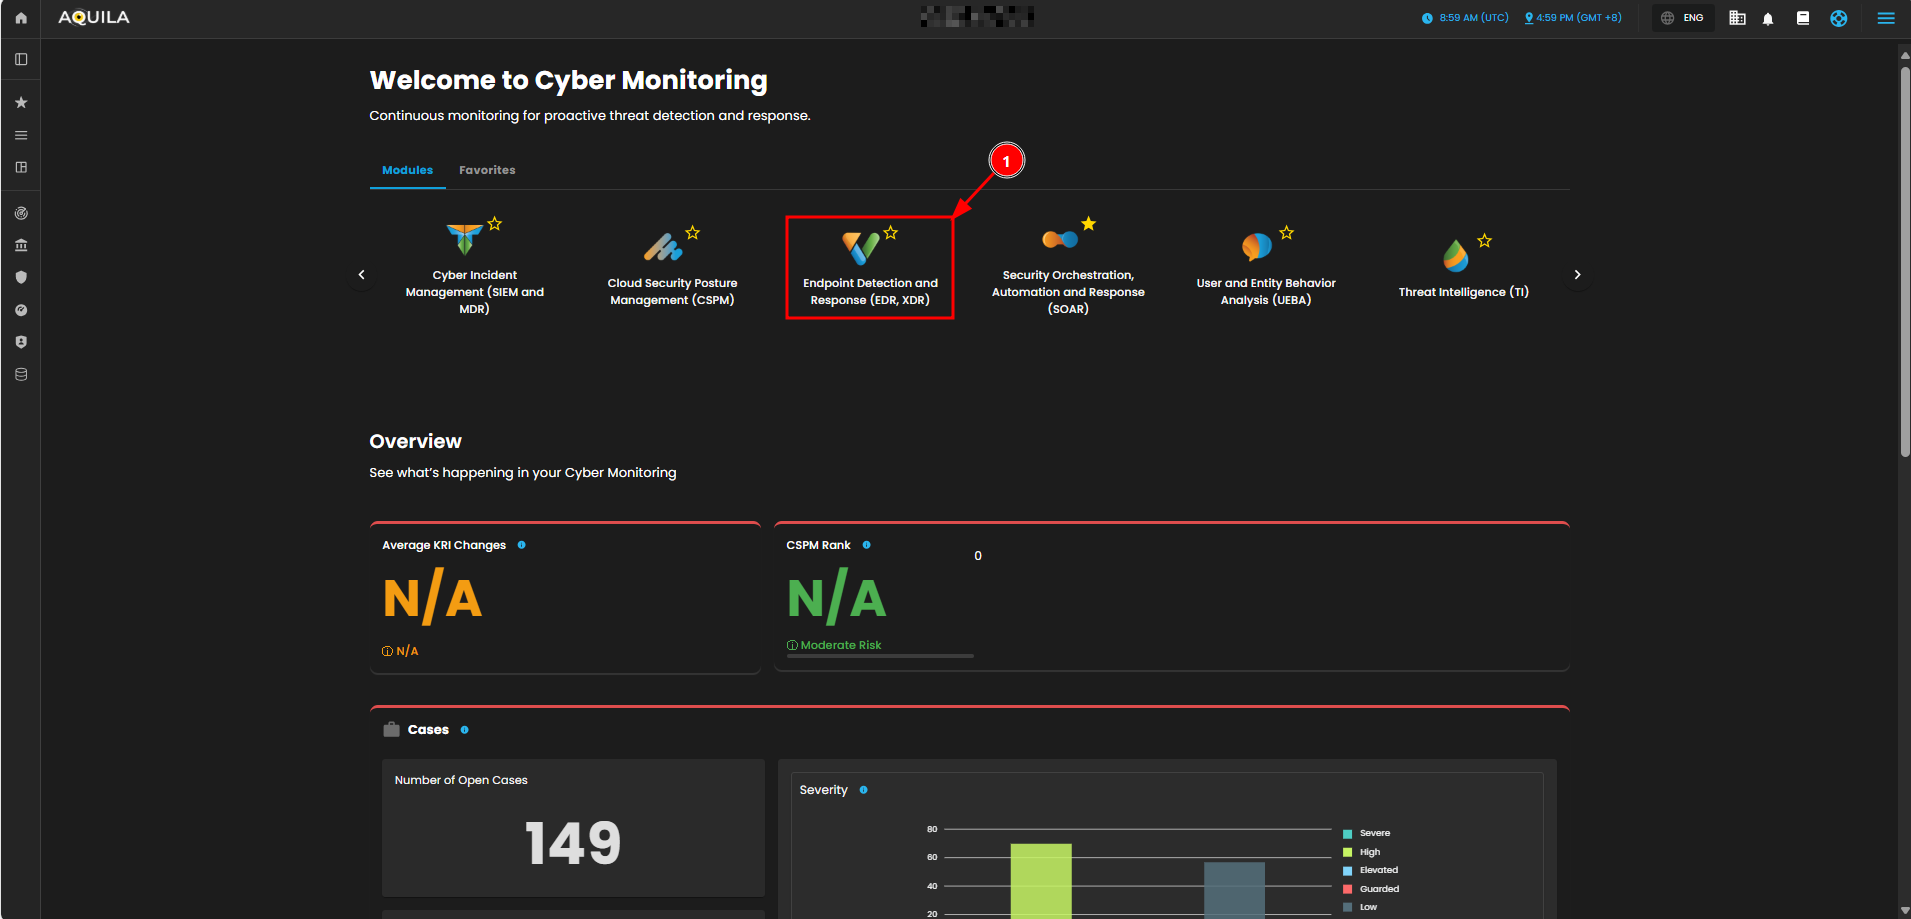
Step 3: Choose Endpoint Detection and Response (EDR).
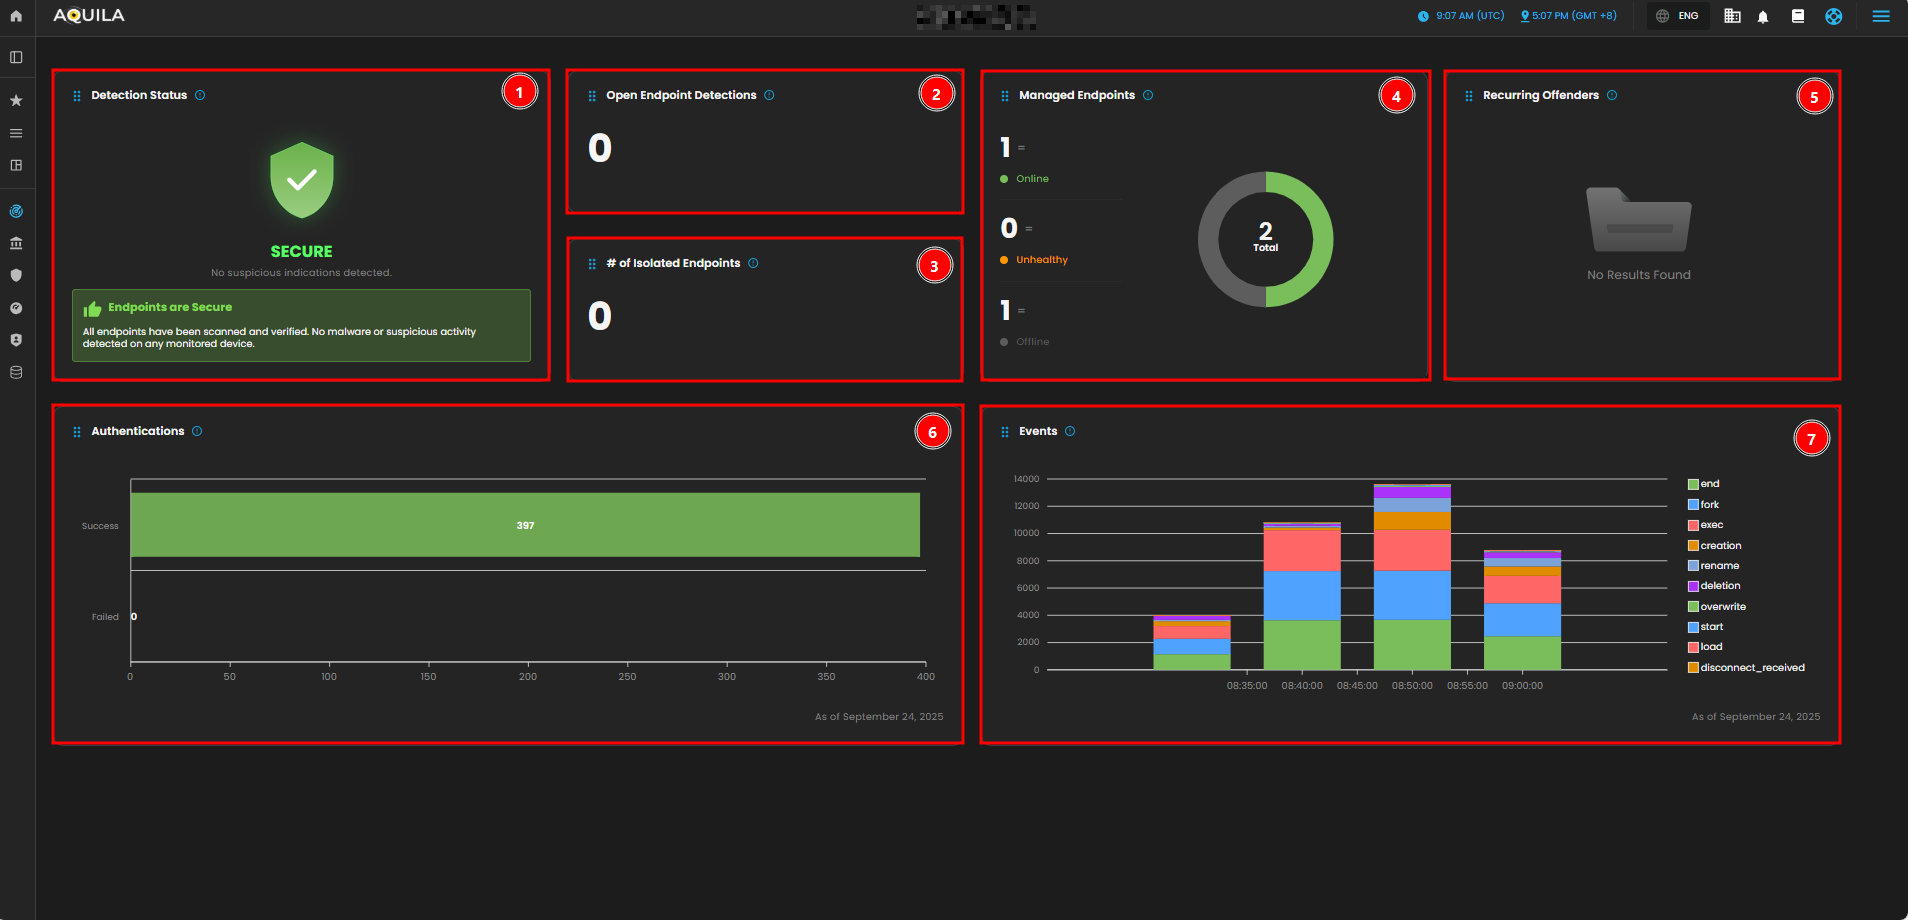
In the EDR Module Dashboard, you can monitor the security status of your endpoints at a glance. This includes Detection Status, Endpoint Health, Authentication Attempts, Event Activity, and Recurring Offenders.
-
Detection Status:
-
This widget shows the overall security status of the monitored endpoints. It indicates that there are no suspicious activities or malware detected. The green "SECURE" status confirms that the system is not facing any security issues at the moment.
-
-
Open Endpoint Detections:
-
Displays the number of currently active endpoint detections. This number is currently 0, meaning there are no open or unresolved detections.
-
-
Number of Isolated Endpoints:
-
Displays the number of endpoints that have been isolated due to detected threats or suspicious activities. The value is 0, indicating that no endpoints have been isolated.
-
-
Managed Endpoints:
-
Shows a breakdown of the endpoints under management. There is one endpoint marked as "Online" (green), and one is "Offline" (gray). The "Unhealthy" count is 0, which suggests no issues with endpoint health.
-
-
Recurring Offenders:
-
This widget lists any repeated offenders or recurring threats detected across the endpoints. It shows "No Results Found," meaning there are no repeated malicious activities detected at the moment.
-
-
Authentication:
-
Provides a graph showing the number of successful versus failed authentications. As of the latest data, there have been 397 successful authentications and 0 failed attempts, suggesting no authentication issues.
-
-
Events:
-
Displays the graphical representation of various system events over time. The chart breaks down different types of events (e.g., "end", "fork", "exec", etc.) that occurred between 08:35 and 09:00. The graph shows how these events fluctuate over time, with certain actions peaking during specific periods.
-
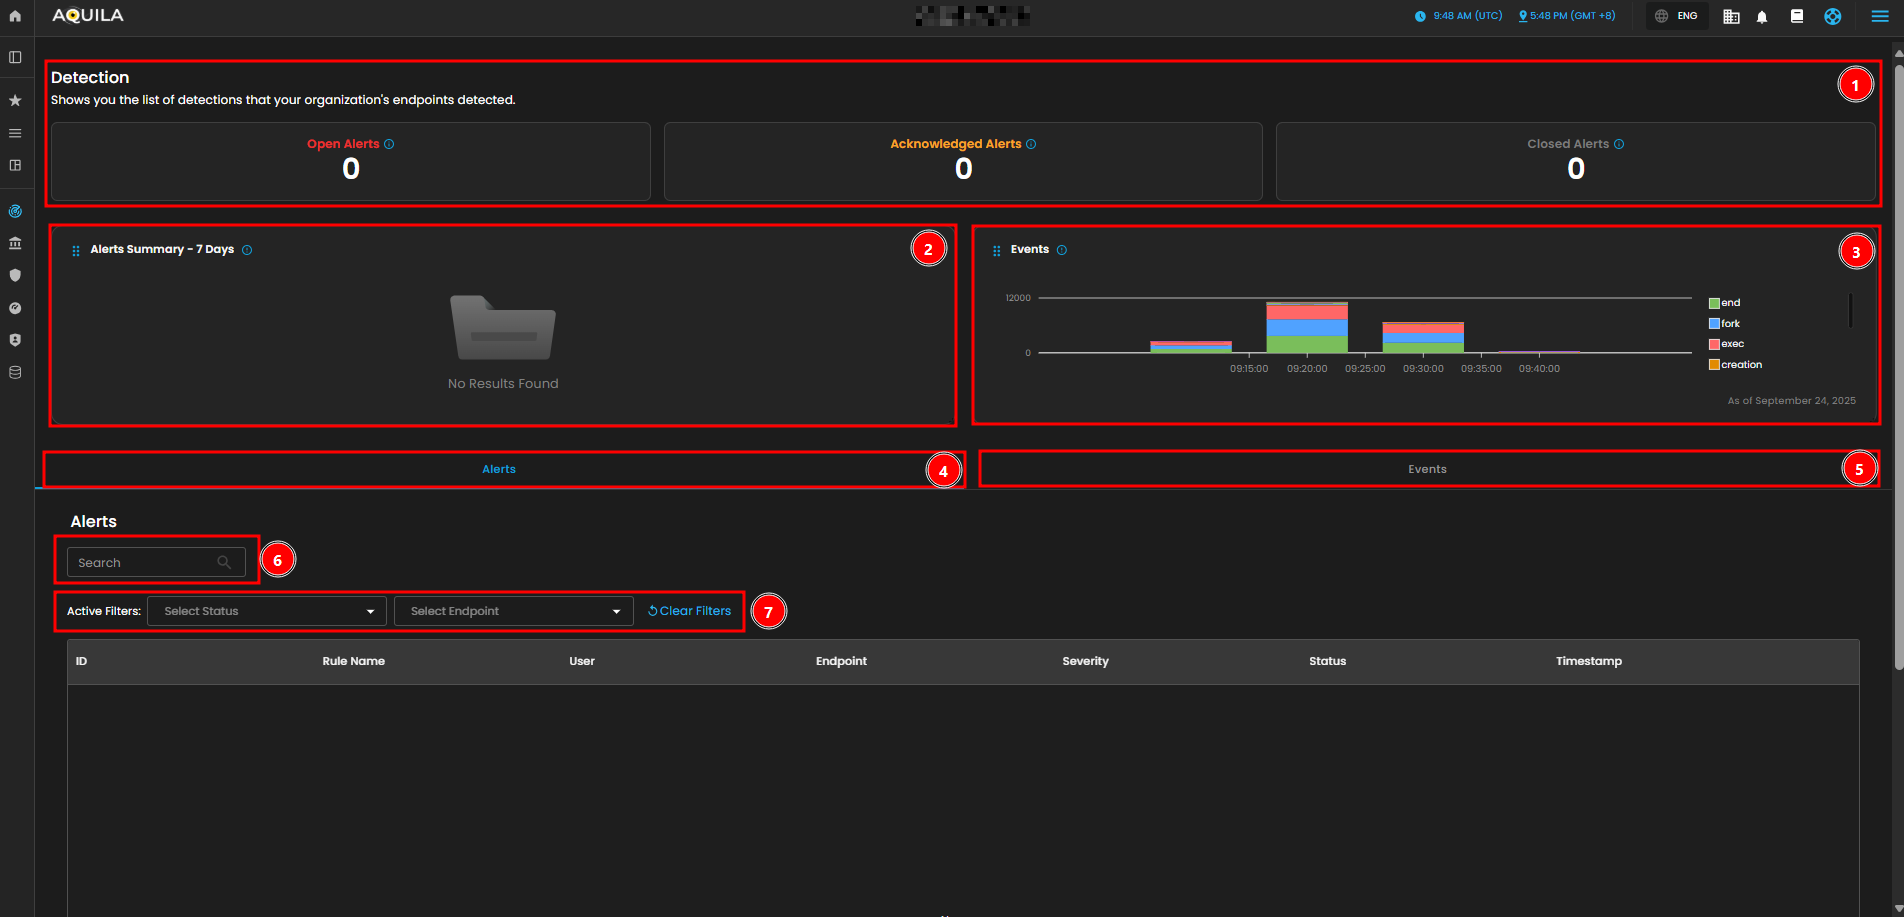
In the Detections, you can manage and analyze all detection and alert data. It includes an overview of open, closed, and acknowledged alerts, event activity trends, and detailed alerts with filtering capabilities.
-
Detections
-
Open Alerts and Acknowledged Alerts give you a quick overview of the current alerts that are either unresolved or acknowledged by users. As of now, there are no open or acknowledged alerts.
-
- Alert Summary
-
The Alerts Summary - 7 Days section shows a historical overview of detections from the past week. At the moment, it shows no results, indicating no major alerts have been triggered recently.
-
- Events Graph
-
The Events graph visualizes system activity, with each color representing different types of events like “end,” “fork,” “exec,” and “creation.” This graph provides insights into endpoint activity over time, showing fluctuations between 09:00 and 09:45 AM. For example, we can see spikes in events at certain times, allowing you to quickly identify periods of increased activity.
-
- Alerts Tab
-
The Alerts section allows you to search for specific alerts using the search bar. This feature helps you quickly locate an alert by its ID, user, or rule name.
-
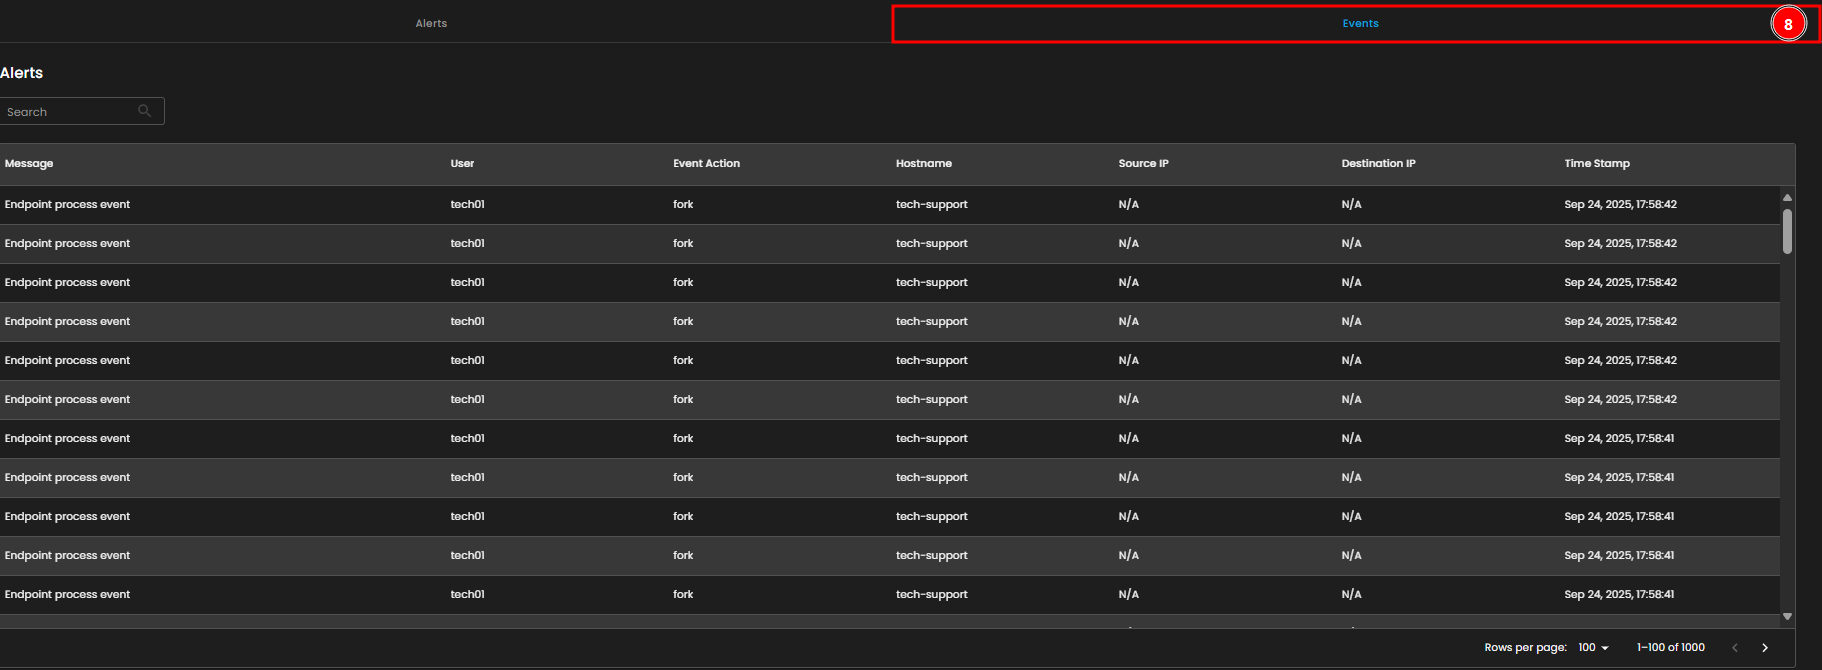
- Events Tab
-
The Events tab contains detailed logs of endpoint process events, including the user, event action, hostname, source and destination IPs, and timestamps. This tab enables you to investigate and track specific activities and behaviors occurring on your endpoints.
-
- Activity Filter
- The Active Filters allow you to filter the alerts by status (e.g., open, acknowledged, or closed) and endpoint. You can clear any applied filters with the “Clear Filters” button.
- Alerts Table
-
The Alerts Table shows detailed information for each alert, such as ID, rule name, user, endpoint, severity, status, and timestamp. Currently, there are no alerts listed, but this section would display them if there were any.
-
- Events Table
- The Events Table below provides a detailed list of endpoint process events, including information such as the user who triggered the event, the event action, the hostname, source and destination IPs, and timestamps. This helps in tracing specific activities happening on endpoints.