CyTech AQUILA - Cyber Incident Management (CIM) Module
Overview:
Cyber Incident Management (CIM) is the end-to-end process of preparing for, detecting, analyzing, responding to, and recovering from cybersecurity incidents (such as malware infections, data breaches, insider threats, or DDoS attacks).
The goal is to minimize damage, reduce recovery time, and prevent future incidents.
Key Features:
- Dashboard - Real-time view of alerts, cases, and overall security status.
- Alerts - Notifications when suspicious activity is detected.
- Cases - Track and manage incidents from start to finish.
- Data Explorer - Investigate logs and find root causes.
- Reports - Summaries for management, compliance, and lessons learned.
- Alert Rules - Define what should trigger an alert (custom detection logic).
- Settings - Configure integrations, access, and workflows.
Pre-requisites:
- Access to CyTech - AQUILA
-
Only users assigned the "Owner" or "Admin" role can access the Log Collector installation resources within the platform.
-
Step 1: Log in to CyTech - AQUILA. click here --> AQUILACYBER.ai
Step 2: In the left column click Cyber Monitoring -> Cyber Incident Management (CIM) -> Dashboard
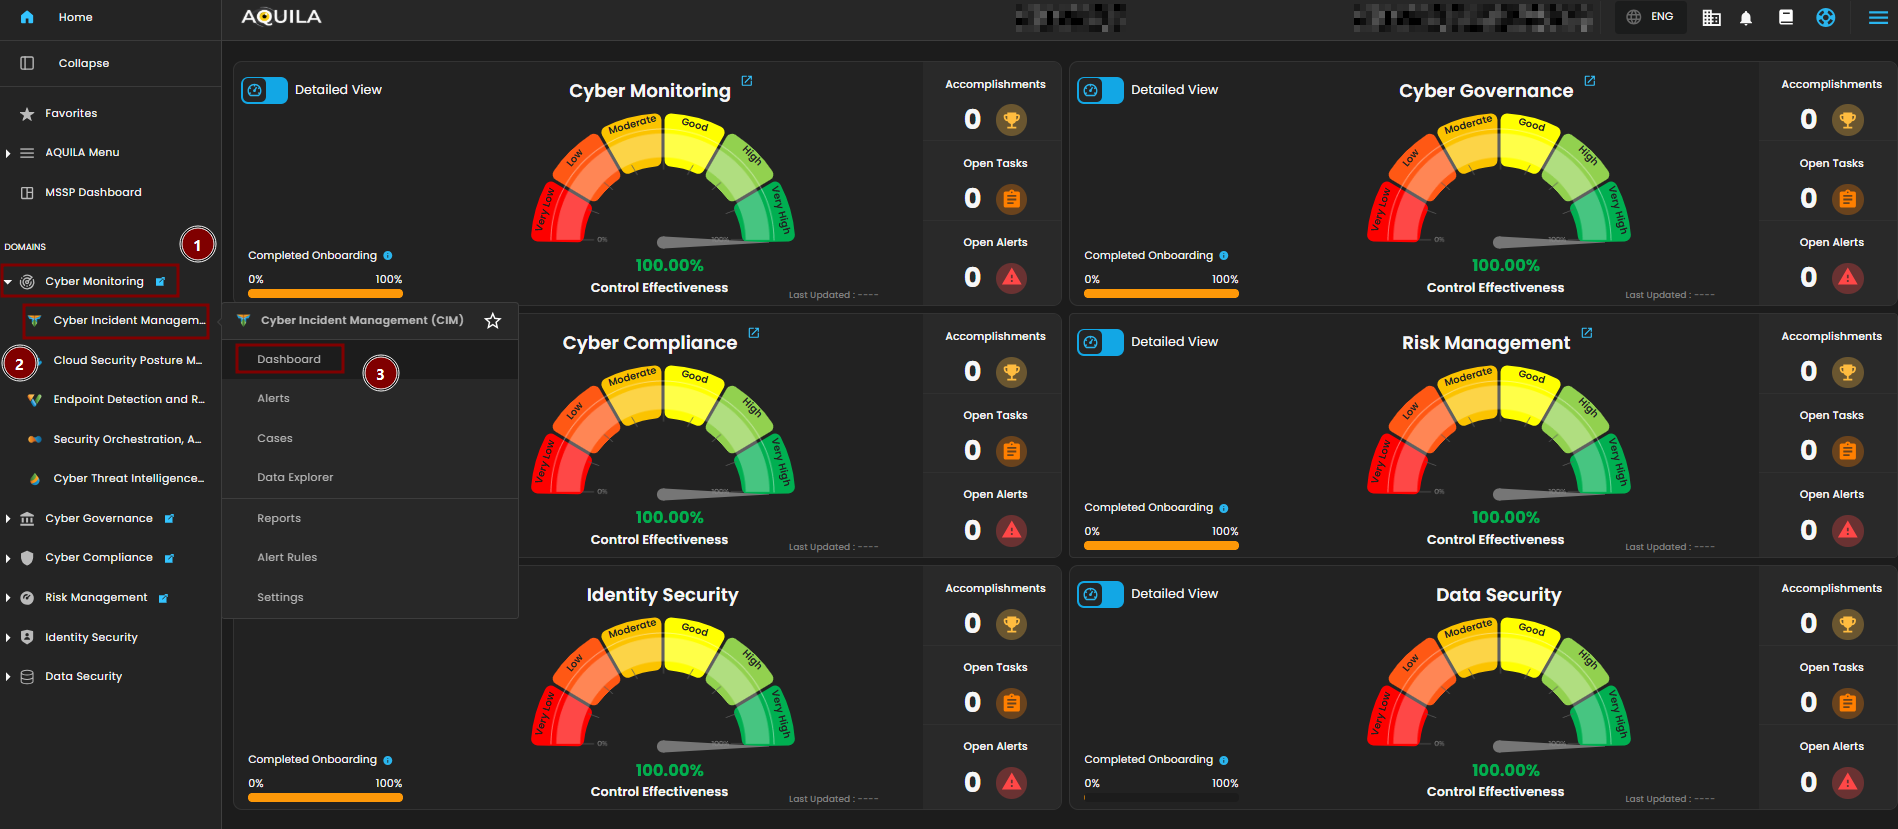
Cyber Incident Management (CIM) Dashboard
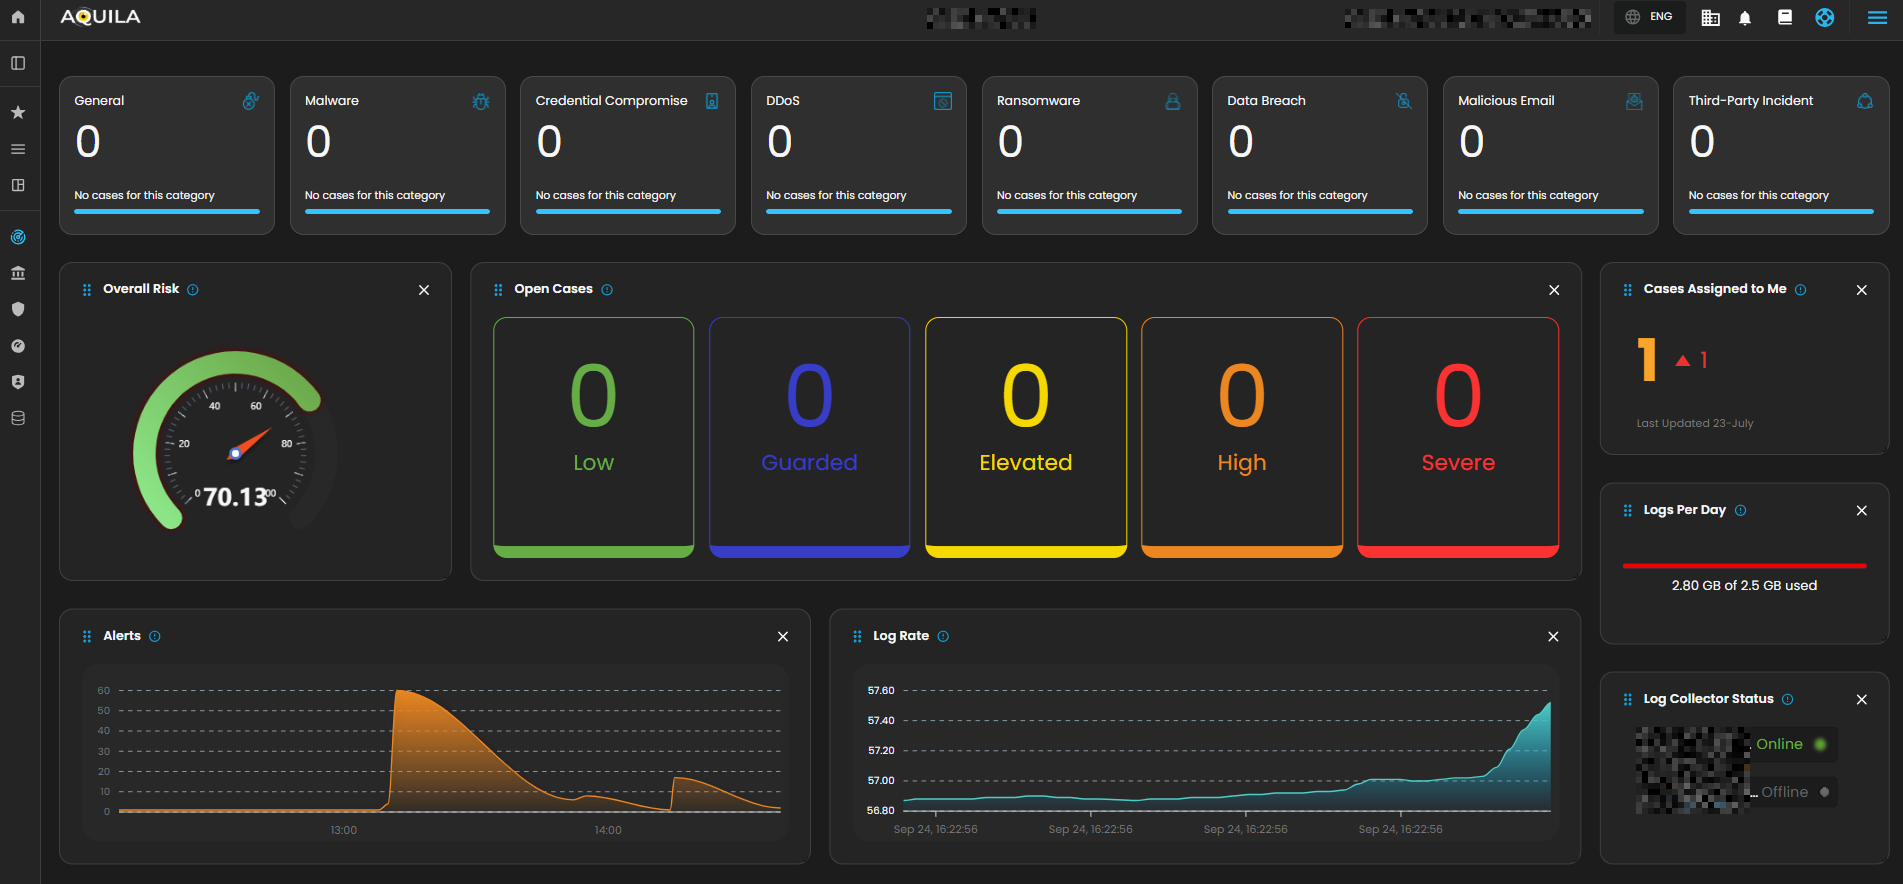
The Main Dashboard serves as the central hub for viewing all critical and relevant data associated with this module. It provides a consolidated interface where key metrics, updates, and operational insights are displayed for quick reference and effective monitoring.
Case Categories
This panel displays and categorizes all cases within your environment that are currently open or in progress. It presents a structured view based on case categories, offering a clear summary of ongoing activity. This allows for efficient tracking, prioritization, and management of active investigations.

Upon selecting a category, a new window will automatically open, displaying all cases associated with the selected category.
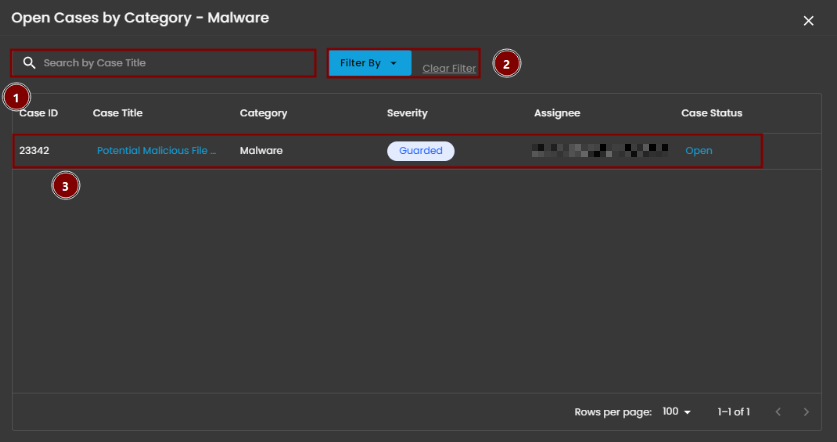
- Search Bar: The search bar enables users to locate a specific case by entering the exact case title. Simply type the desired title into the search field to quickly retrieve relevant results.
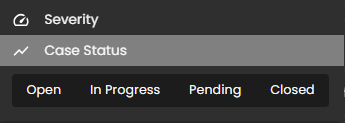
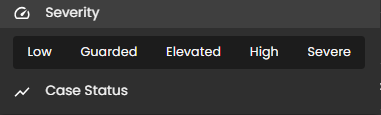
- Filter By & Clear Filter: This feature enables users to refine the list of cases by applying filters based on Severity and Case Status. Use the Filter By option to display only the cases that match specific criteria. To remove all applied filters and return to the full list of cases, use the Clear Filter option.

- Case Details: To access the investigation section of a case, double-click on the case entry. This action will automatically redirect you to the detailed investigation interface for further analysis and review.

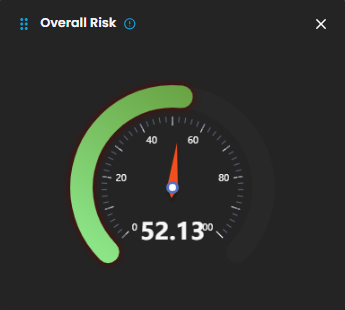
Overall Risk
Displays system risk severity levels on a scale from Low to Severe (0 - 100), explaining the rationale behind risk classifications and showing the highest severity level present in the system. Clicking on the gauge allows you to view more details about.

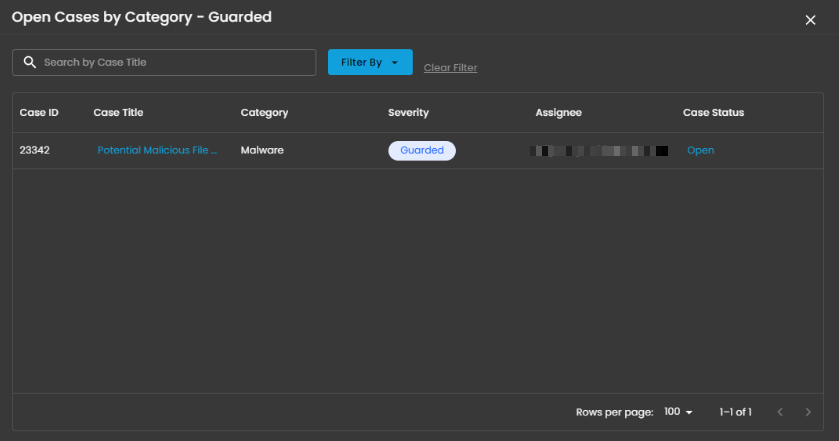
Open Cases
Displays the total number of open cyber incident cases, categorized by severity, that are currently being investigated.
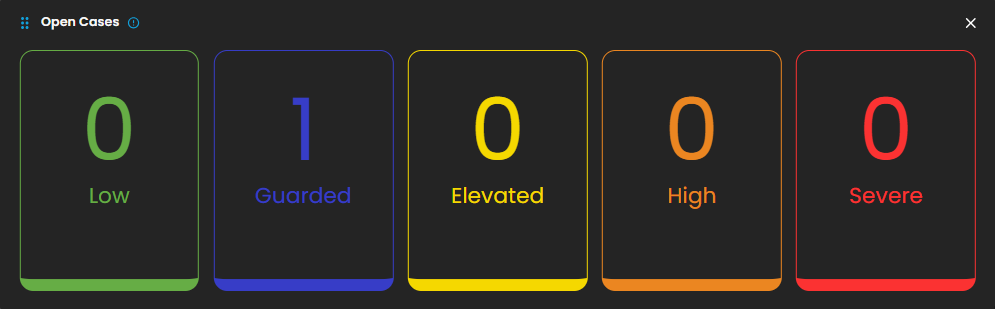
When you click on a category, you will see all the cases that fall under that severity level. For example, as shown in the image above, selecting the “Guarded Severity” category will display all cases labeled as guarded severity.
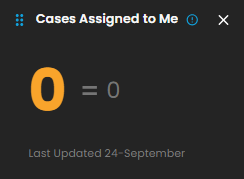
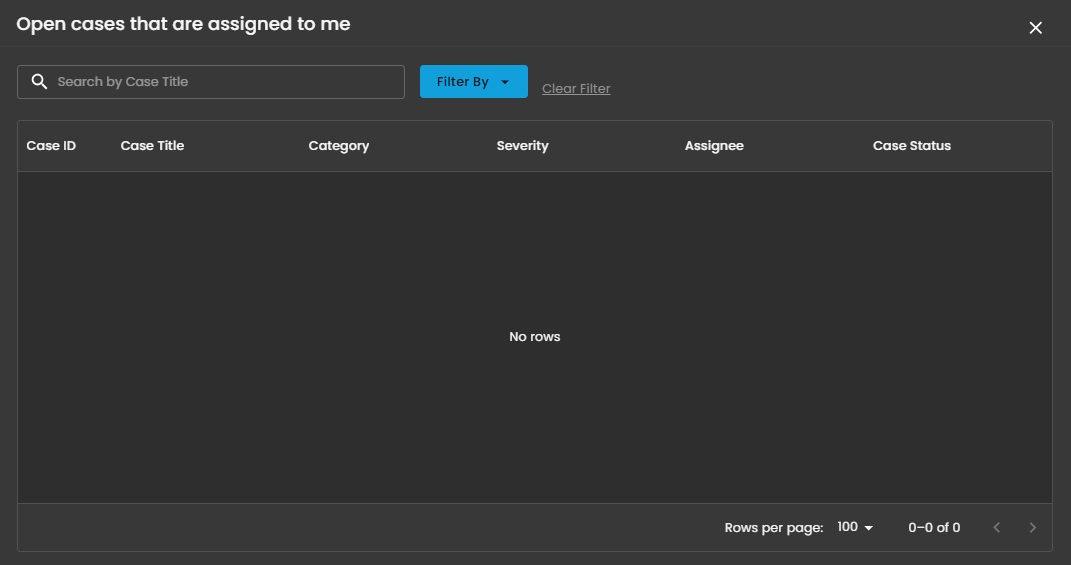
Cases Assigned to Me
Shows the number of cyber incident cases specifically assigned to you for investigation and resolution. Clicking on it will open up a small window that will show all the cases assigned under you.
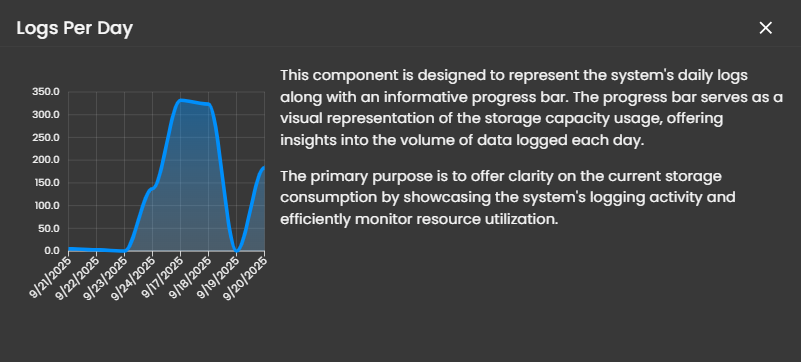
Logs Per Day
Displays daily system logs with a progress bar that tracks storage capacity usage, providing clear insights into daily logging volume and resource consumption.
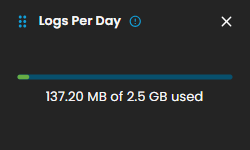
When you click on it, a small window will appear displaying a graph.
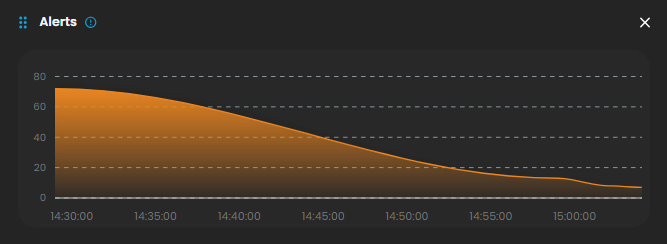
Alerts
Display the trends of the detections generated by the system, highlighting potential security incidents that require immediate attention. Clicking on it will open up a small window that will show all the alerts that was recently triggered.
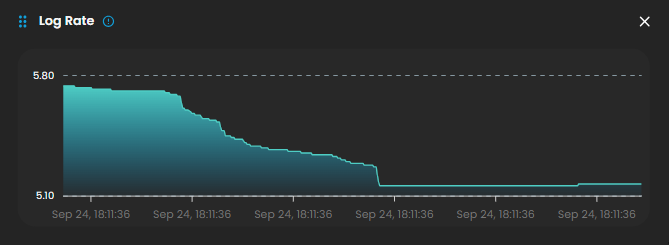
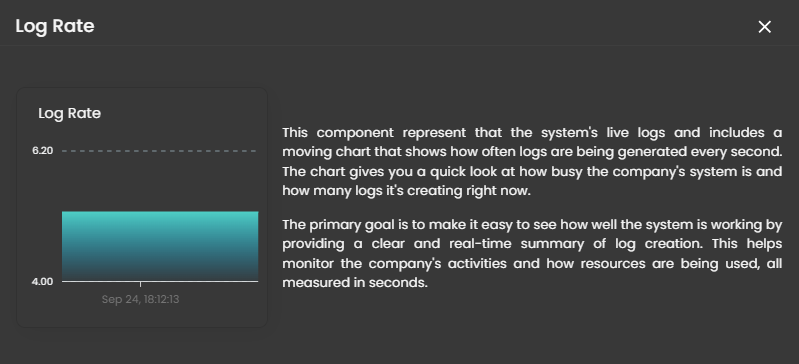
Log Rate
A real-time visualization to display system log generation frequency per second through a dynamic chart, enabling instant monitoring of system activity and resource utilization. Clicking on it will open up a small window that will show the detailed explanation.
Log Collector Status
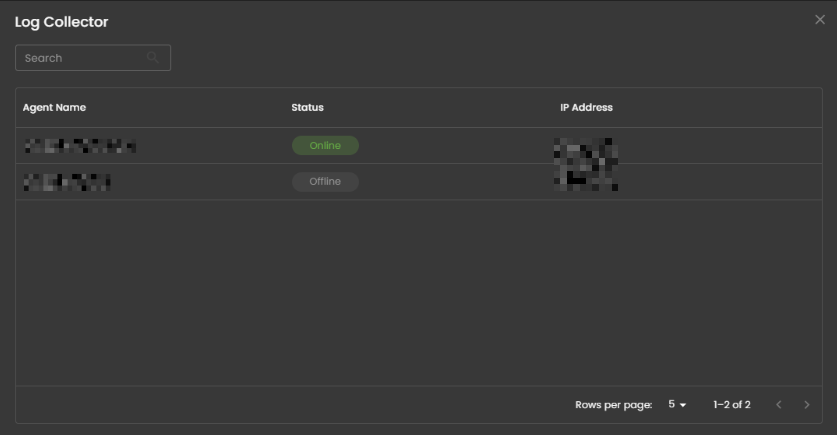
Indicates the current status of the log collector, ensuring that logs are being collected and monitored for any suspicious activity.

When you click on it, a small window will appear showing all installed log collectors along with their current status.
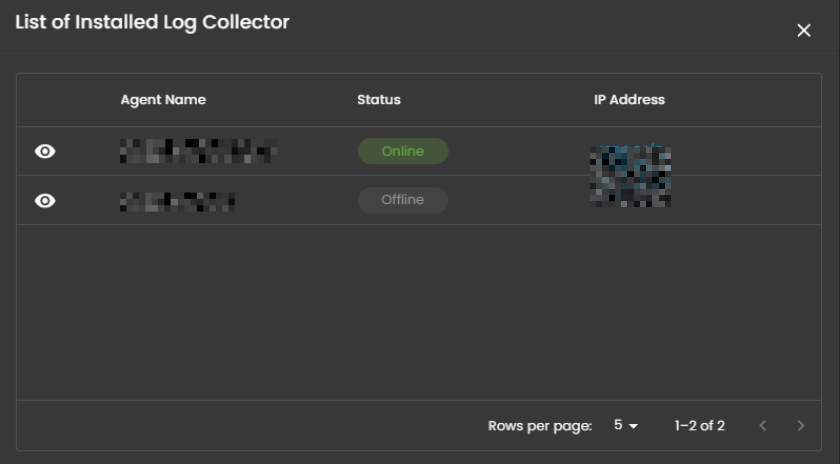
Click the eye icon next to the log collector name to go to the Log Collector List page.

________________________________________________________________________________________________________________________________________________
Cyber Incident Management (CIM): Alerts
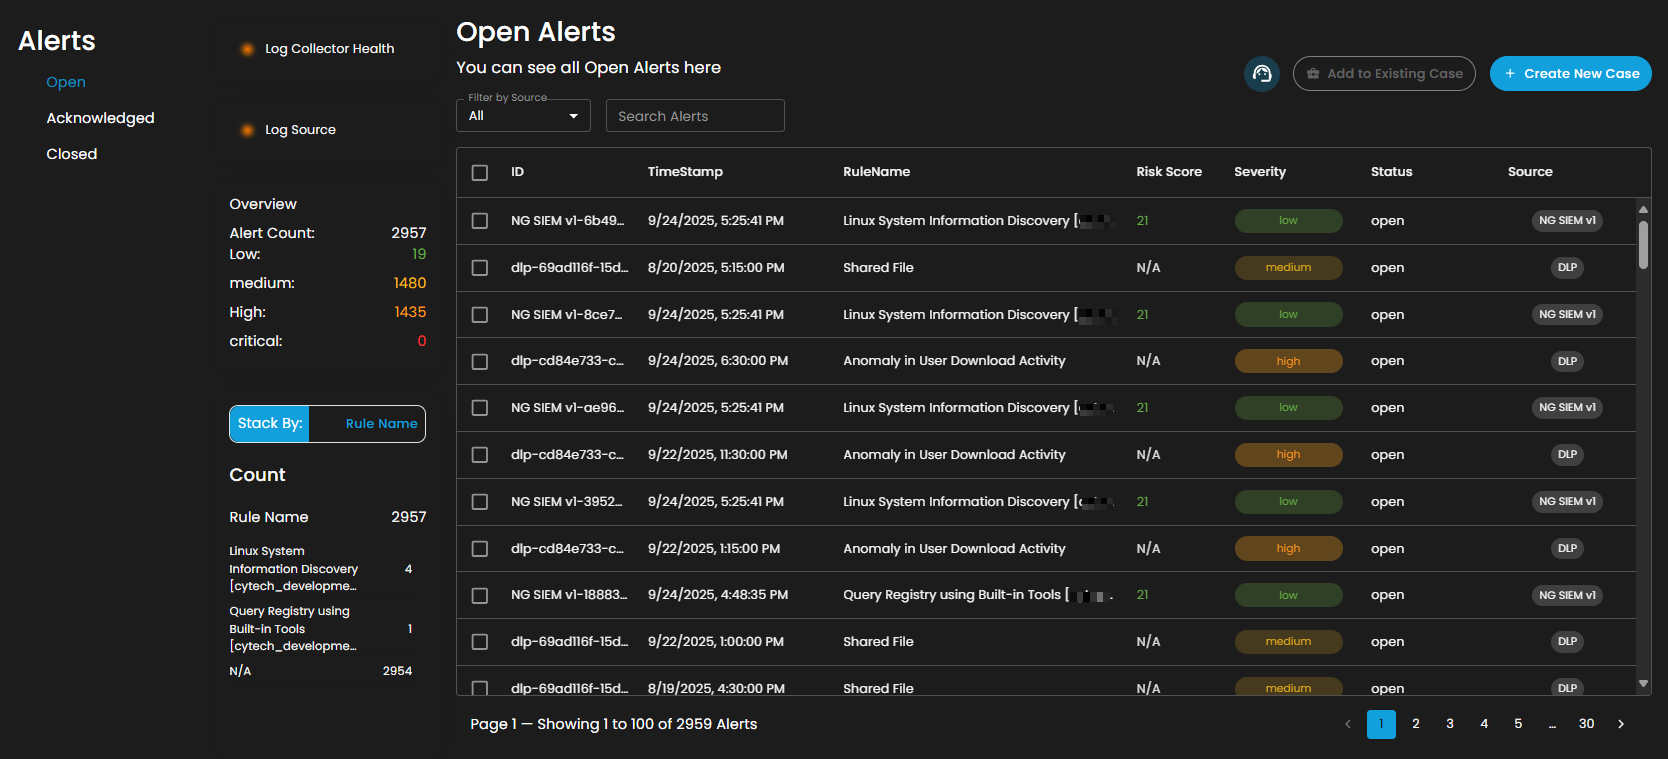
Alerts Dashboard is a tool that provides real-time security alerts and notifications. It provides a unified view of different types of alerts, categorizing them by severity and type, and displays critical details such as the source of the alert, affected assets, and relevant information. This dashboard enables security teams to quickly assess, prioritize, and respond to potential threats by offering comprehensive insights and plays a crucial role in enhancing situational awareness and streamlining the incident response process.
Alerts Status Types
Open Alerts: Alerts awaiting assignment to an analyst for further investigation.
Acknowledged Alerts: Alerts currently in progress and assigned to an analyst for resolution.

Closed Alerts: Alerts that have been successfully resolved and closed.

Log Collector Health
Indicates the current status of the log collector, ensuring that logs are being collected and monitored for any suspicious activity.

When you click on it, a small window will appear showing all installed log collectors along with their current status.
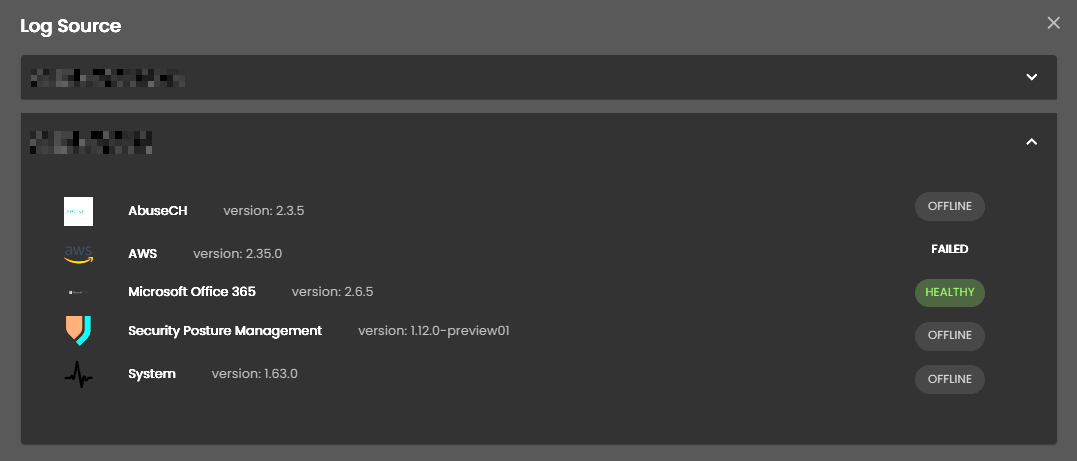
Log Source
These are the various systems, applications, or devices that generate data sent into AQUILA for indexing, storage, and analysis. These sources provide visibility across infrastructure, applications, and security operations.

When selected, a dialog window is displayed showing all installed log collectors. You can switch between collectors to view the integrated log sources associated with each one, along with their respective versions and current status, including whether log ingestion is functioning properly.

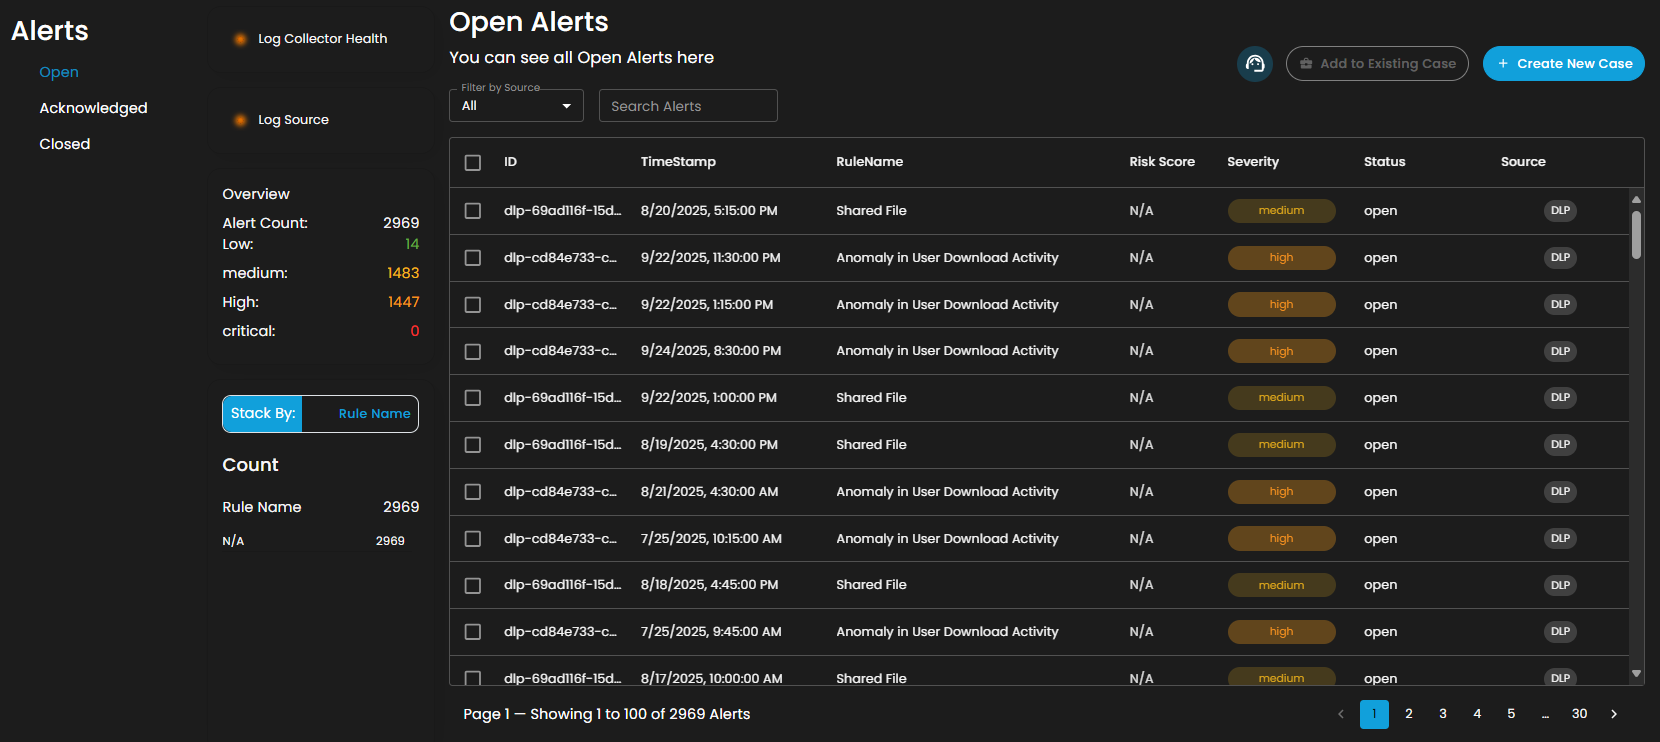
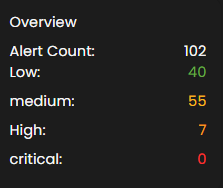
Overview
It provides an overview of alert counts categorized by status type, including the total number of alerts and their distribution across severity levels.
Stack By Rule Name
This view displays a summary of alerts grouped by their corresponding detection rules. At the top of the panel, the total number of alerts is presented. Below this, each rule is listed alongside the count of alerts it has generated. Users can scroll through the list to view additional rules when the number of entries exceeds the visible space. This view enables quick identification of which detection rules are generating the highest volume of alerts, supporting prioritization and investigation activities.

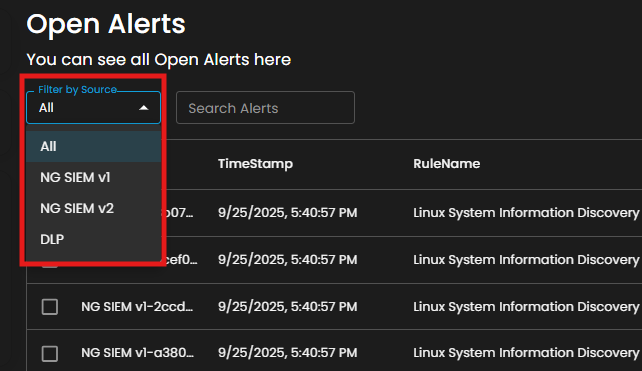
Filter by Source and Search box
Filter by Source: This dropdown menu allows users to filter alerts based on their originating source. Selecting a specific source will limit the displayed alerts to only those generated by the chosen system or log source, while the default All option displays alerts from every available source.
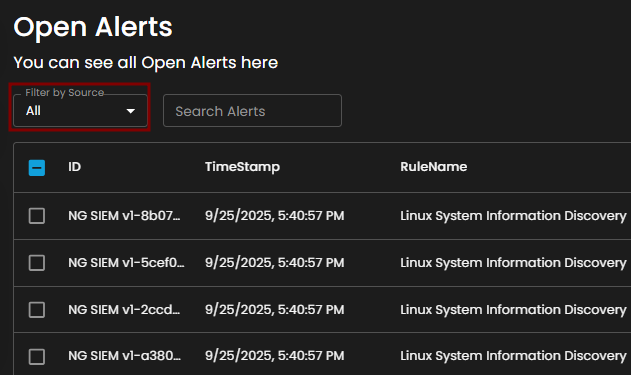
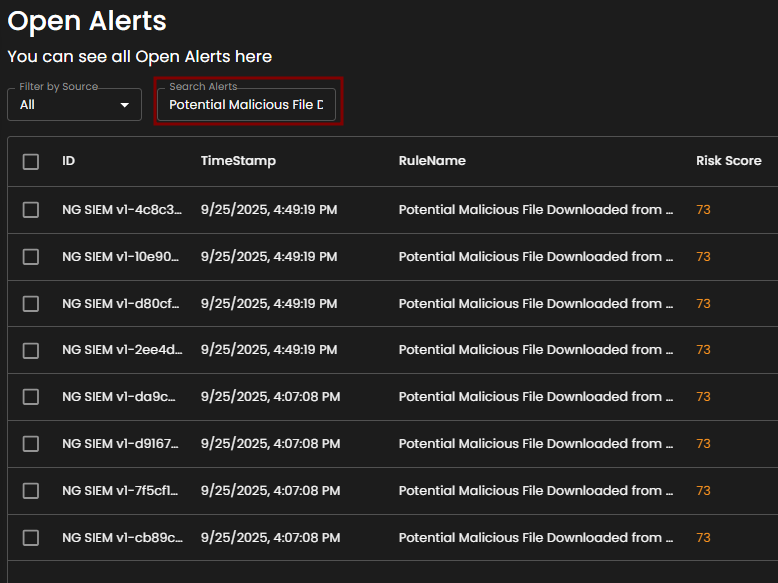
Search Alerts: This text-based search field enables users to query alerts by keywords, rule names, IDs, or other relevant attributes. Entering a search term dynamically filters the alert list, allowing users to quickly identify and focus on alerts of interest.
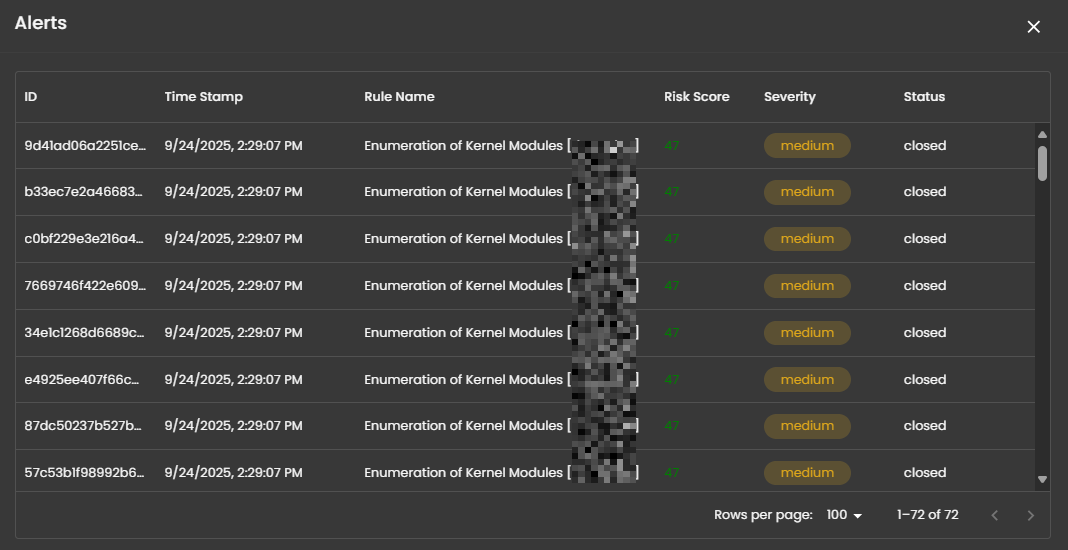
Alerts Information
Alerts Table provides a detailed view of all alerts, organized in a tabular format for efficient monitoring and analysis. Each entry contains the following fields:
-
ID: A unique identifier automatically assigned to each alert.
-
Timestamp: The date and time the alert was generated, displayed in a standardized format.
-
Rule Name: The detection rule that triggered the alert, enabling correlation with specific monitoring logic.
-
Risk Score: A numerical value representing the assessed risk level of the alert.
-
Severity: The severity classification (e.g., low, medium, high, critical) that contextualizes the potential impact of the event.
-
Status: The current workflow state of the alert (e.g., open, acknowledged, closed).
-
Source: The originating source of logs that produced the alert.
The table supports pagination to manage larger datasets, with navigation controls located at the bottom of the view. This ensures users can efficiently browse and review alerts when the total number exceeds the displayed entries per page.

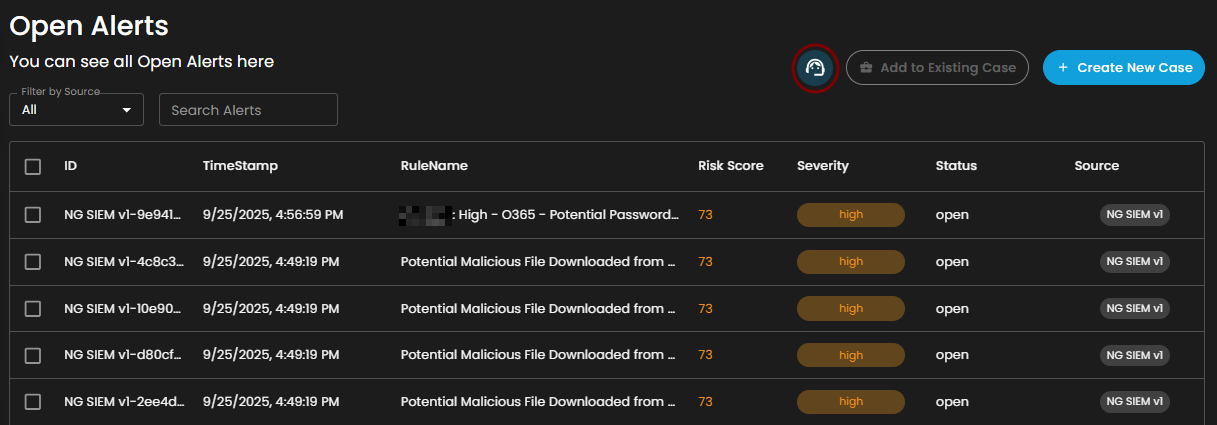
Create a Case
Case Creation involves initiating a new incident case when a security alert is detected. This process includes documenting key details about the alert, categorizing and prioritizing the case based on its severity and impact, and tracking all investigation and response activities. By creating a case, security teams can organize and manage the incident comprehensively, ensuring that all related actions and communications are centralized, which facilitates effective resolution and improves overall incident handling.
To create a case, you can opt to choose either to create a case from the Alerts Dashboard or the Case Management Dashboard.
To create a case:
- Select an alert
- Click the create new case button as shown below
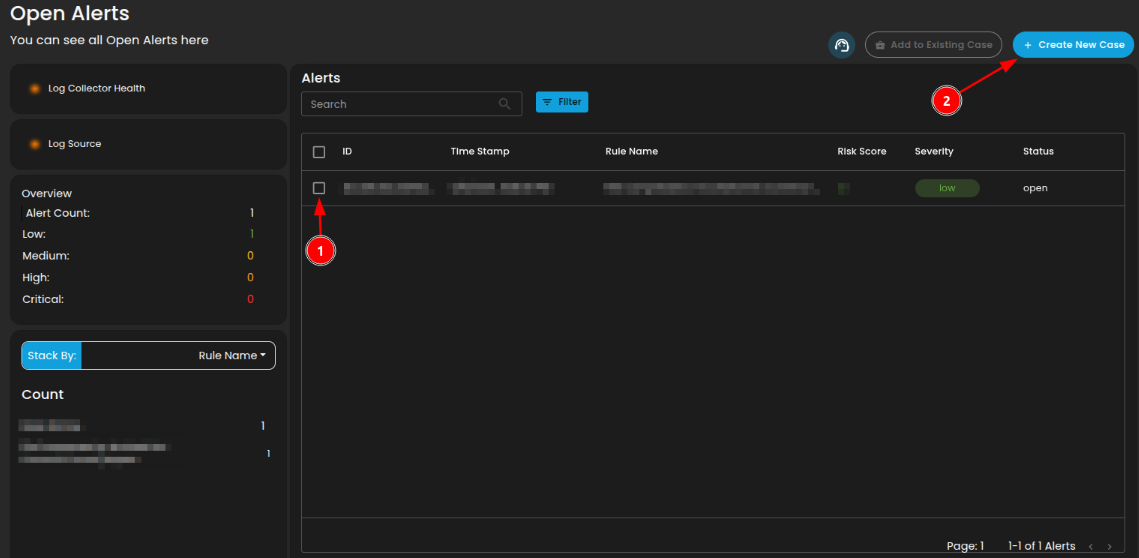
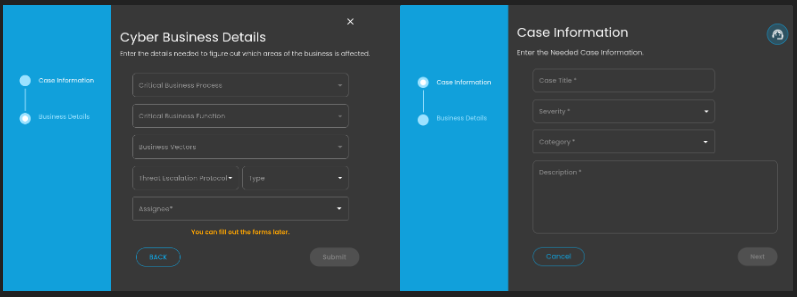
Doing so will show a modal where information is required to create a case for investigation
Once a case has been successfully created, it will show in the Case Management Dashboard as shown below.
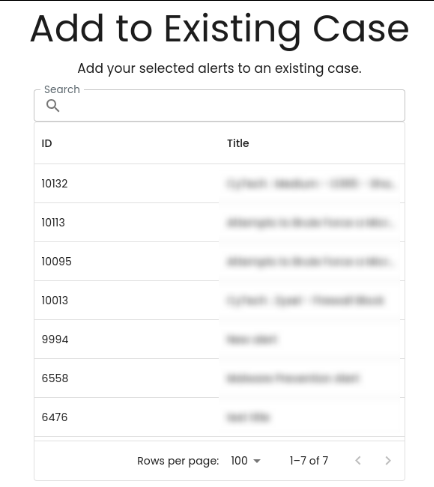
Add Alerts to an Existing Case
This feature allows security teams to associate a new alert with an ongoing or previously created incident case. By adding a new alert to an existing case, teams can streamline their investigation and response efforts, correlate related data, and avoid duplicating efforts.
Steps to take:
- To add to an existing case, navigate to the Alerts Dashboard
- Select an alert and click the add to existing case button as shown below

3. Select which existing case is relevant to the alert to add it as an existing case.
Support Assistance
-
Submit a Request: Clients may create and submit a new support request or error report by providing the necessary details regarding the issue encountered.
-
Search Existing Tickets: Clients can query and review tickets they have previously submitted, allowing them to track the status and resolution progress of ongoing requests.
This feature ensures that users can promptly report errors and access updates on existing support cases without leaving the Alerts interface.
________________________________________________________________________________________________________________________________________________
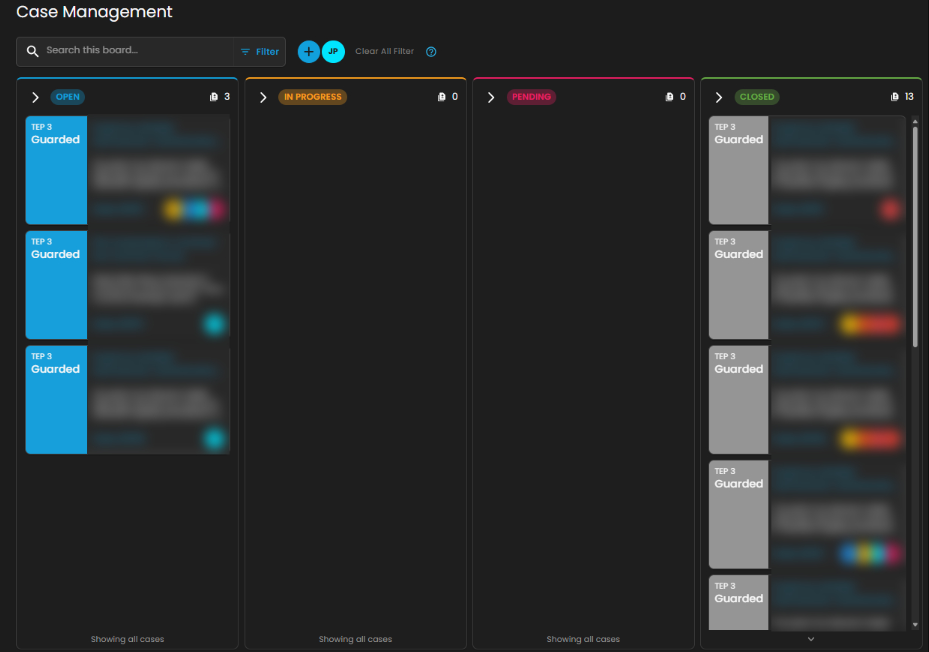
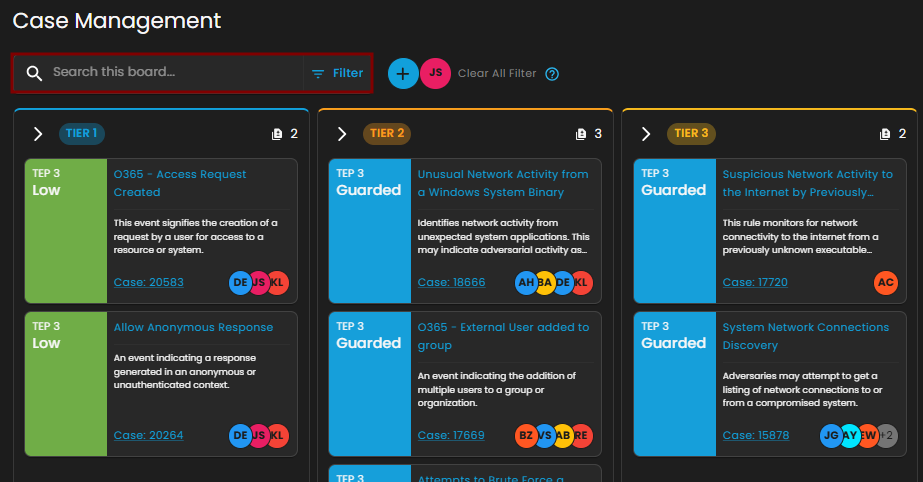
Cyber Incident Management (CIM): Cases
Case Management Dashboard is a tool that provides a comprehensive overview of security incidents. It offers detailed insights into active and past incidents, including their status, severity, and timeline. The dashboard facilitates investigation and response by integrating real-time alerts, threat intelligence, and collaboration features, while also tracking performance metrics and compliance. This centralized approach enhances the efficiency of managing and resolving security incidents, ensuring timely and effective responses to mitigate risks and improve overall security posture.

Workflow Stages
-
Tier 1 – Initial Triage Cases
-
SOC Role: Tier 1 Analyst (Junior Analyst / Alert Triage).
-
Purpose: These cases represent low-level alerts or first-line detections that require quick review and initial triage.
-
Activities:
-
Validate whether the alert is a false positive or true positive.
-
Collect basic context (e.g., user, host, timestamp, IP address).
-
Escalate to Tier 2 if suspicious behavior is confirmed.
-
-
Example from Dashboard:
-
O365 – Access Request Created (Low severity).
-
-
Outcome: Often resolved at Tier 1 if clearly benign, otherwise escalated.
-
-
Tier 2 – Investigation Cases
-
SOC Role: Tier 2 Analyst (Intermediate / Incident Responder).
-
Purpose: These are guarded alerts requiring deeper investigation and contextual analysis.
-
Activities:
-
Correlate the alert with other logs or events (threat hunting, SIEM searches).
-
Investigate user behavior, process execution, network activity.
-
Assess potential adversary techniques (e.g., MITRE ATT&CK mapping).
-
-
Example from Dashboard:
-
Unusual Network Activity from a Windows System Binary.
-
Attempts to Brute Force Microsoft 365 User Account.
-
-
Outcome: If confirmed malicious, escalated to Tier 3 for containment and response.
-
-
Tier 3 – Advanced Investigation / Threat Containment
-
SOC Role: Tier 3 Analyst (Senior Incident Responder / Threat Hunter).
-
Purpose: These are high-complexity or high-risk cases requiring advanced analysis and incident response expertise.
-
Activities:
-
Perform in-depth forensic analysis.
-
Identify persistence, lateral movement, or exfiltration attempts.
-
Contain compromised systems or accounts.
-
Recommend remediation actions (patching, isolating endpoints, resetting credentials).
-
-
Example from Dashboard:
-
Suspicious Network Activity to Internet by Unknown Executable.
-
System Network Connections Discovery.
-
-
Outcome: Leads to confirmed incident reports, escalation to management, or remediation workflows.
-
-
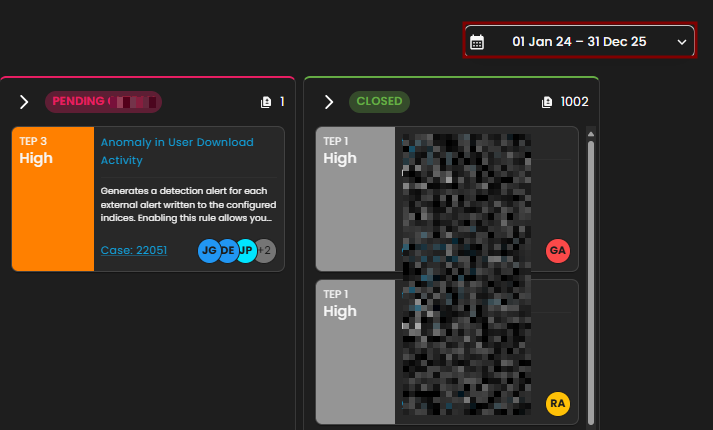
Pending – Escalated to Vendor/Support
-
SOC Role: Escalation Analysts / Vendor Support.
-
Purpose: Cases flagged here are awaiting validation or support from the vendor. This stage ensures:
-
Validation of unusual detections.
-
Vendor-side investigation (e.g., signature tuning, false positive confirmation).
-
Guidance from product experts.
-
-
Example from Dashboard:
-
Anomaly in User Download Activity (High severity) pending Client validation.
-
-
Outcome: Case is updated and either closed, tuned, or sent back to SOC for action.
-
-
Closed – Resolved or Dismissed Cases
-
SOC Role: Any Tier but validated and approved before closure.
-
Purpose: Contains all cases that are resolved, dismissed as false positives, or remediated.
-
Activities:
-
Document final analysis and resolution steps.
-
Mark case as False Positive, True Positive – Remediated, or Informational.
-
Archive for compliance, auditing, and reporting.
-
-
Outcome: Closes the incident lifecycle. Closed cases can still be reviewed for reporting and lessons learned.
-
Operational Workflow in SOC Terms
-
Detection → Tier 1 triages incoming alerts.
-
Validation → Tier 2 investigates and correlates data.
-
Escalation → Tier 3 performs deep analysis and containment.
-
External Escalation → Pending for vendor validation/support.
-
Closure → Closed with full documentation and resolution notes.
Search and Date Filtering
The Case Management interface provides filtering and search capabilities to streamline case navigation and improve analyst efficiency. These functions enable analysts to quickly locate specific cases or limit the view to a defined time range.
Search Bar
-
Location: Positioned at the top-left of the Case Management interface.
-
Purpose: Enables analysts to perform keyword-based searches across all available cases within the board.
-
Functionality:
-
Accepts free-text input such as case IDs, rule names, case titles, or descriptive terms.
-
Returns a filtered set of cases that match the entered criteria.
-
Supports rapid retrieval of specific cases without manual scrolling through case columns.
-
-
Use Case in SOC Operations:
-
Analysts can locate a case associated with a particular user or alert type during triage.
-
Facilitates targeted investigation by narrowing down large datasets to a manageable subset.
-
Date Filter
-
Location: Displayed in the top-right section of the Case Management interface, adjacent to the “Create New Case” button.
-
Purpose: Allows analysts to filter cases based on a specified date range.
-
Functionality:
-
Provides a selectable calendar input with predefined and custom ranges (e.g., “01 Jan 24 – 31 Dec 25”).
-
Adjusts the case board to display only cases that fall within the chosen timeframe.
-
Ensures time-specific investigations can be conducted efficiently.
-
-
Use Case in SOC Operations:
-
Supports incident review during a specified monitoring period (e.g., weekly/monthly threat activity reviews).
-
Enables correlation of cases to a known attack campaign or investigation window.
-
Assists with compliance reporting by extracting cases within regulatory audit timelines.
-
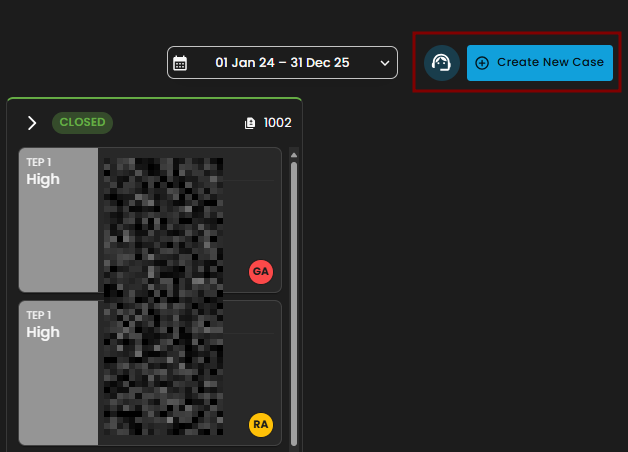
Create New Case and Support
The Case Management interface includes two primary action buttons located at the top-right of the screen: Create New Case and Support. These options enable analysts to initiate new investigations and provide clients with direct access to technical support resources when required.
Create New Case
-
Purpose: Enables analysts to manually initiate and document a new security case.
-
Functionality:
-
When selected, the system displays a form where analysts can input case details, including title, description, severity, and assigned users.
-
Once submitted, the new case appears within the appropriate case column (e.g., Tier 1) for tracking and escalation.
-
-
Use Case in SOC Operations:
-
Allows analysts to proactively log incidents that may not have been automatically generated by alerts.
-
Facilitates documentation of investigations that originate from external intelligence sources, manual threat hunting, or analyst observations.
-
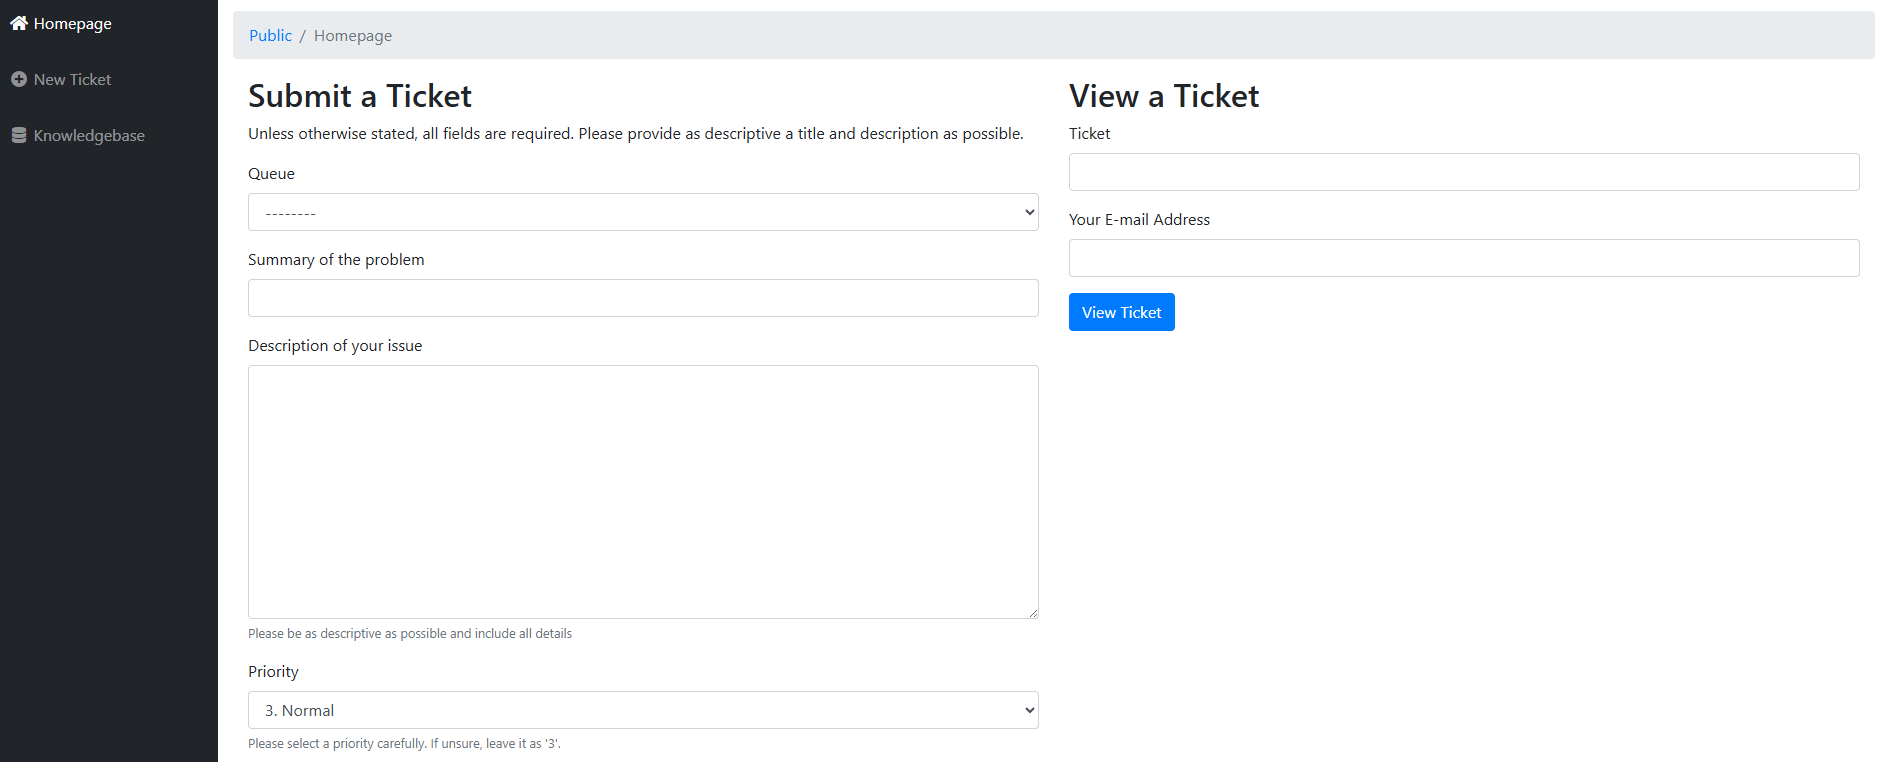
Support
-
Purpose: Provides clients with direct access to the support portal for issue resolution and ticket management.
-
Functionality:
-
When selected, the client is redirected to the Support page.
-
The Support page provides two primary options:
-
Submit a New Ticket – Allows clients to report errors, technical issues, or product-related concerns.
-
Search Existing Tickets – Enables clients to view and track the status of tickets they have previously submitted.
-
-
-
Use Case for Clients:
-
Allows clients to escalate platform issues or request assistance directly from support.
-
Provides visibility into both new and ongoing tickets for efficient follow-up.
-
Ensures that clients can maintain continuity of operations by receiving timely support when technical difficulties arise.
-
________________________________________________________________________________________________________________________________________________
Cyber Incident Management (CIM): Data Explorer
The Data Explorer feature provides a unified view of log ingestion and event details. It combines visual analytics and tabular data to help clients track log volumes, search for specific events, and analyze data patterns over time.
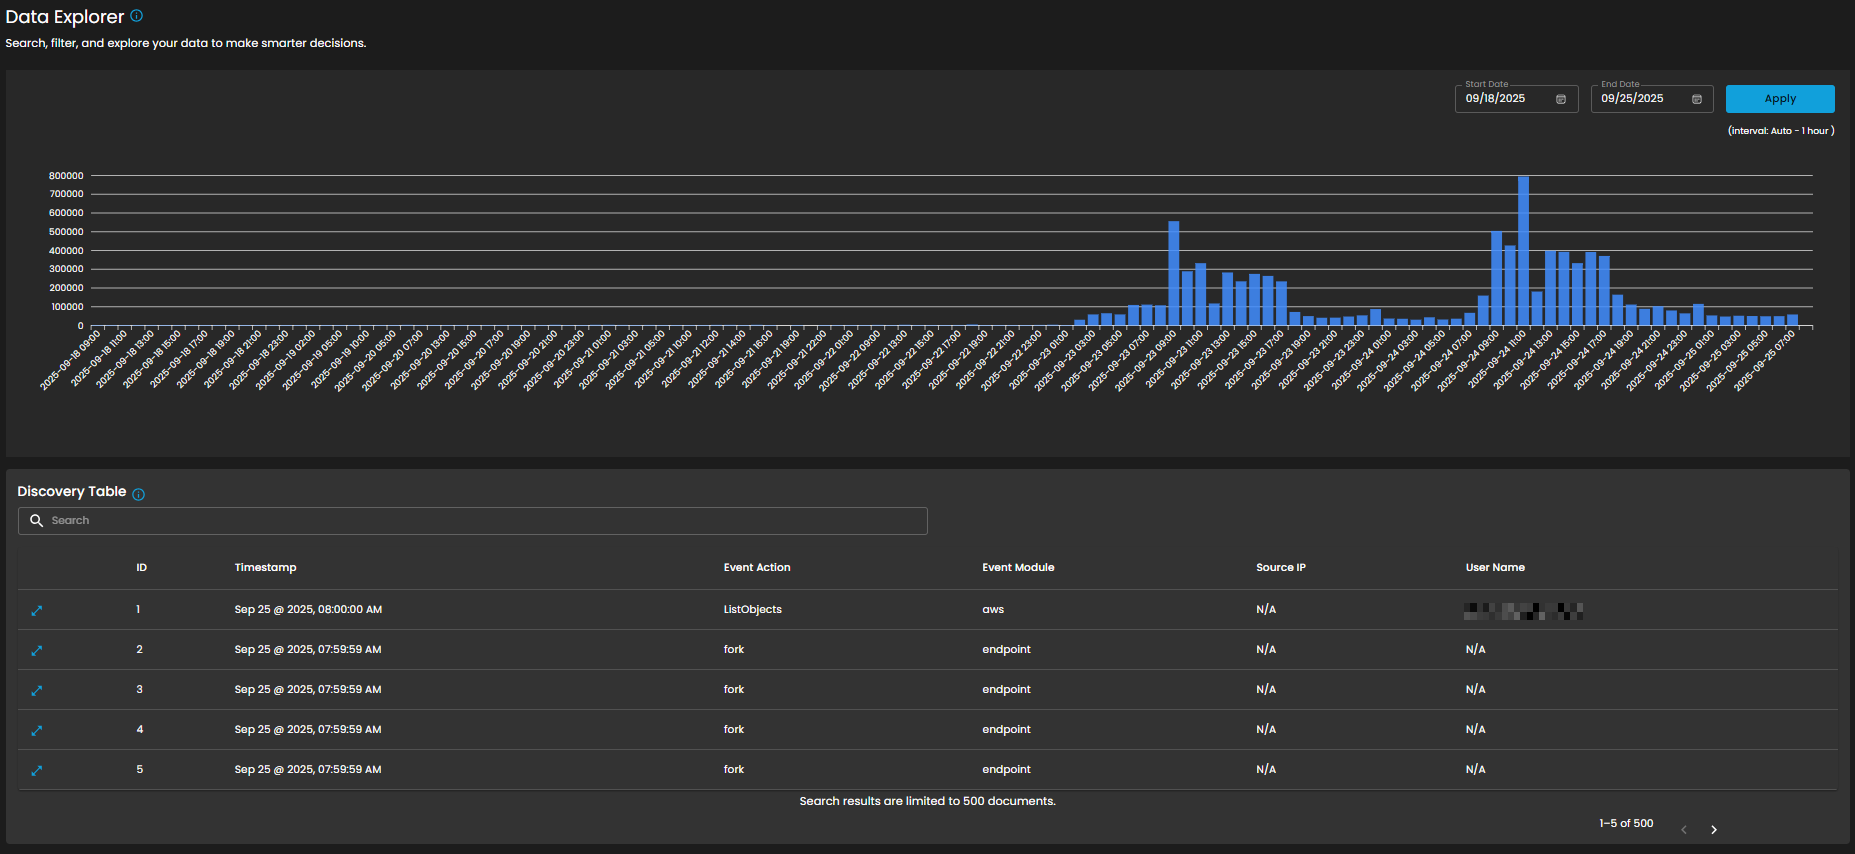
Log Consumption Chart
Displays the volume of logs ingested per hour within a selected timeframe, enabling quick identification of activity spikes, anomalies, and ingestion trends.
Components
- Date Range Selector
- Start Date
- End Date
- Apply Button: Refreshes the chart according to the selected timeframe.
- Interval Note: (interval: Auto – 1 hour) – data points are grouped per one-hour intervals.

Discovery Table
Provides detailed, event-level visibility into ingested logs for analysts. Displays logs that contain comprehensive records of activities and events, enabling analysts to search, filter, and review specific entries for investigation, correlation, and reporting.
Components
- Search Bar: Allows keyword-based filtering across event records.
- Tabular Columns:
-
ID – Unique identifier for each record.
-
Timestamp – Exact date and time the event occurred (e.g., Sep 25, 2025, 07:59:59 AM).
-
Event Action – Action performed within the event (e.g., ListObjects, fork).
-
Event Module – Source module of the event (e.g., aws, endpoint).
-
Source IP – Origin IP of the event.
-
User Name – User associated with the event.
-
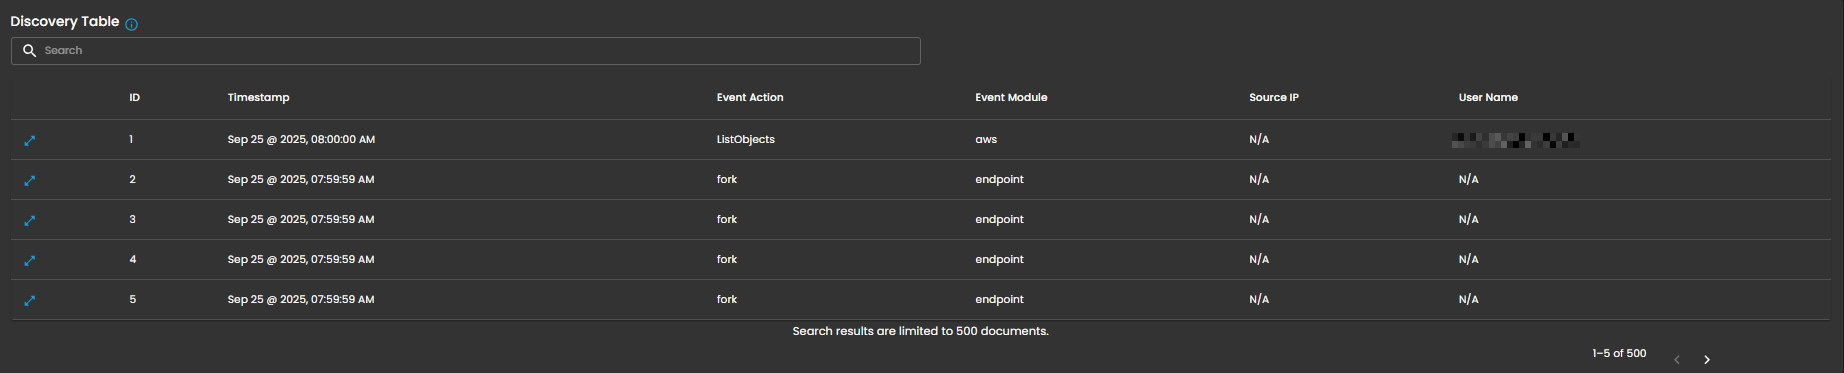
Functional Insights
Correlation Between Chart and Table
- The chart provides an aggregated, volume-based overview of logs.
- The discovery table provides granular event details, allowing analysts to trace which specific actions contributed to spikes in log activity.
Analyst Use Case
- Analysts can monitor ingestion volumes, then drill down into specific events for deeper investigation.
- Example: A spike in logs on 09/24/2025 11:00 may be investigated by reviewing the detailed event records in the table.
________________________________________________________________________________________________________________________________________________
Cyber Incident Management (CIM): Reports
The Reports Dashboard provides a centralized interface for monitoring, analyzing, and reviewing security tickets and alert activity within a defined date range. It consolidates data into visual charts and categorized metrics, enabling analysts to evaluate incident trends, ticket statuses, and alert sources for more effective decision-making.
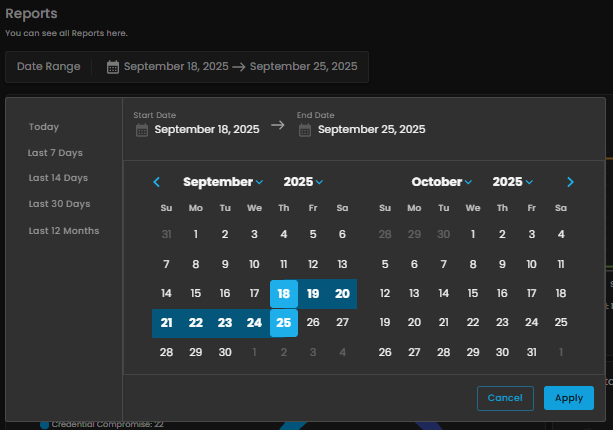
Date Range Selector
Defines the reporting period for all displayed metrics.
Functionality:
-
When the user clicks on the Date Range field, a calendar pop-up appears.
-
The calendar allows analysts to specify both Start Date and End Date.
-
Predefined quick ranges are available for convenience:
-
Today
-
Last 7 Days
-
Last 14 Days
-
Last 30 Days
-
Last 12 Months
-
-
Users can also select custom ranges directly from the calendar by clicking the desired start and end dates.
-
Once the range is selected, the analyst can either:
-
Apply → Confirm and refresh dashboard data.
-
Cancel → Exit without changes.
-
Operational Insight:
-
Enables analysts to generate time-bound reports for specific investigations (e.g., reviewing alerts during a known phishing campaign window).
-
Quick ranges are useful for standard reporting periods (weekly, monthly, quarterly).
-
Custom ranges support flexibility when investigating incidents that cross standard reporting boundaries.
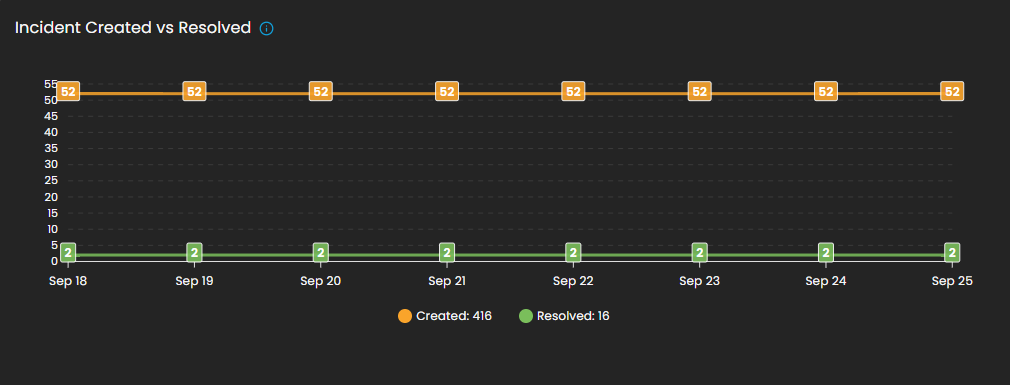
Incident Created vs Resolved
This graph shows the number of incidents created vs. resolved, depending on the selected date timeline.
-
Visualization: Line chart with two metrics:
-
Created (orange line): Total number of incidents raised during the reporting period.
-
Resolved (green line): Total number of incidents successfully closed.
-
-
Purpose: Enables analysts to assess case resolution efficiency compared to incident creation rates.
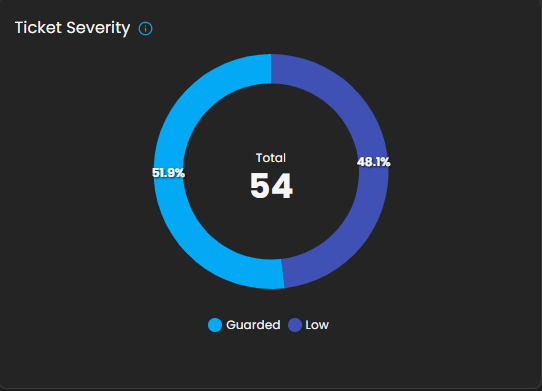
Ticket Severity
This graph displays the distribution of tickets by severity level.
-
Visualization: Donut chart with severity distribution.
-
Categories Displayed:
-
Guarded
-
Low
-
-
Purpose: Summarizes the severity levels of tickets to help analysts prioritize workload.
-
Operational Insight: A higher proportion of “Guarded” severity tickets may signal elevated but manageable risks, requiring proactive monitoring.
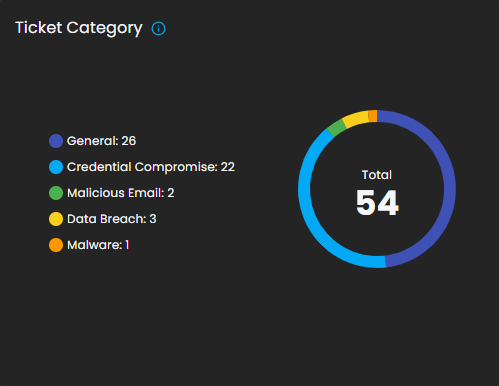
Ticket Category
Breaks down tickets based on their assigned category.
-
Visualization: Donut chart displaying distribution across categories.
-
Categories:
-
General
-
Credential Compromise
-
Malicious Email
-
Data Breach
-
Malware
-
-
Purpose: Provides analysts with visibility into the types of threats most frequently encountered.
Ticket Status
This graph visualizes the current status of tickets to track resolution progress.
-
Visualization: Bar chart of ticket states.
-
Statuses Monitored:
-
Open
-
Pending
-
In Progress
-
Closed
-
-
Purpose: Tracks current case lifecycles, supporting workload balancing and resolution monitoring.

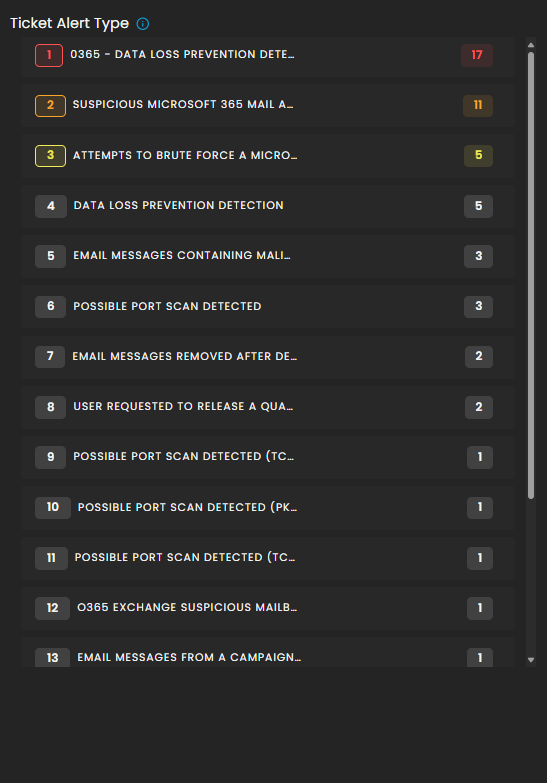
Ticket Alert Type
Provides a categorized breakdown of security alerts raised within the system. This helps analysts quickly identify the most frequent or severe types of alerts for prioritization and incident response. The feature also groups tickets by alert type and sorts them based on count, enabling analysts to focus on the most prevalent threats first.
Functionality
-
Each alert type is listed in descending order of volume.
-
A numerical badge beside each type shows the number of tickets generated.
Analyst Use Case
-
Prioritization: Analysts can quickly spot which alert categories are most frequent and critical.
-
Trend Identification: Helps SOC teams track recurring threats, such as repeated port scan attempts or ongoing phishing campaigns.
-
Investigation Focus: Guides where resources should be allocated for further log analysis and incident response.
-
Escalation Decisioning: High-volume or high-severity alert types can be escalated to Tier 2 or Tier 3 SOC analysts.
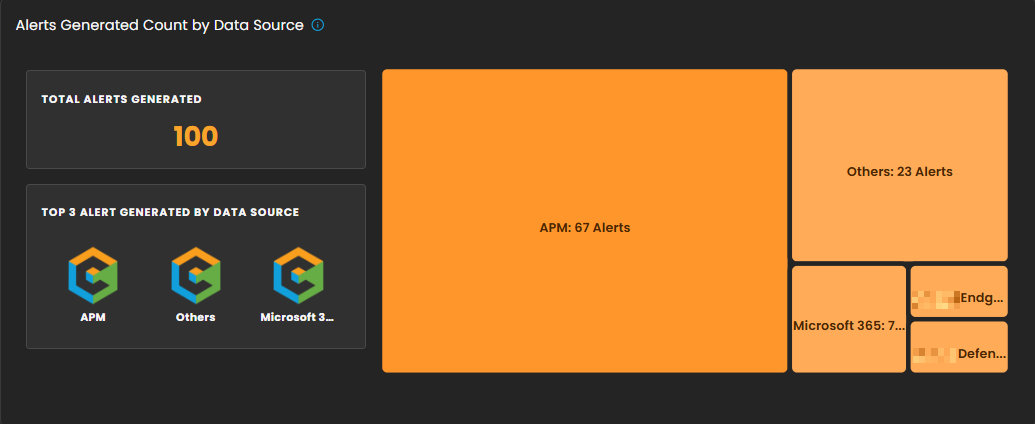
Alerts Generated Count by Data Source
This section provides a breakdown of security alerts based on their originating data sources. It enables analysts to identify which systems or platforms are contributing the highest number of alerts, supporting more targeted investigation and resource allocation.
Components
-
Total Alerts Generated
Displays the overall count of alerts detected within the selected date range. In the example shown, a total of 100 alerts were generated. -
Top 3 Alert Sources
Highlights the three primary data sources that generated the most alerts, allowing analysts to quickly focus on the most active or risky environments. -
Treemap Visualization
Graphically represents the distribution of alerts by data source. Each block corresponds to a data source, with the block size proportional to the alert count.-
Example: APM generated the highest number of alerts (67).
-
Others contributed 23 alerts.
-
Additional sources, including Microsoft 365, Endpoint, and Defender, are shown with smaller proportional segments.
-
Analyst Use Case
-
Prioritize monitoring efforts on high-volume sources such as APM.
-
Identify unusual spikes in alerts from less active sources.
-
Allocate investigative resources efficiently across multiple platforms.