CyTech AQUILA - Cyber Incident Management (CIM) Module
Overview:
Cyber Incident Management (CIM) is the end-to-end process of preparing for, detecting, analyzing, responding to, and recovering from cybersecurity incidents (such as malware infections, data breaches, insider threats, or DDoS attacks).
The goal is to minimize damage, reduce recovery time, and prevent future incidents.
Key Features:
- Dashboard - Real-time view of alerts, cases, and overall security status.
- Alerts - Notifications when suspicious activity is detected.
- Cases - Track and manage incidents from start to finish.
- Data Explorer - Investigate logs and find root causes.
- Reports - Summaries for management, compliance, and lessons learned.
- Alert Rules - Define what should trigger an alert (custom detection logic).
- Settings - Configure integrations, access, and workflows.
Pre-requisites:
- Access to CyTech - AQUILA
-
Only users assigned the "Owner" or "Admin" role can access the Log Collector installation resources within the platform.
-
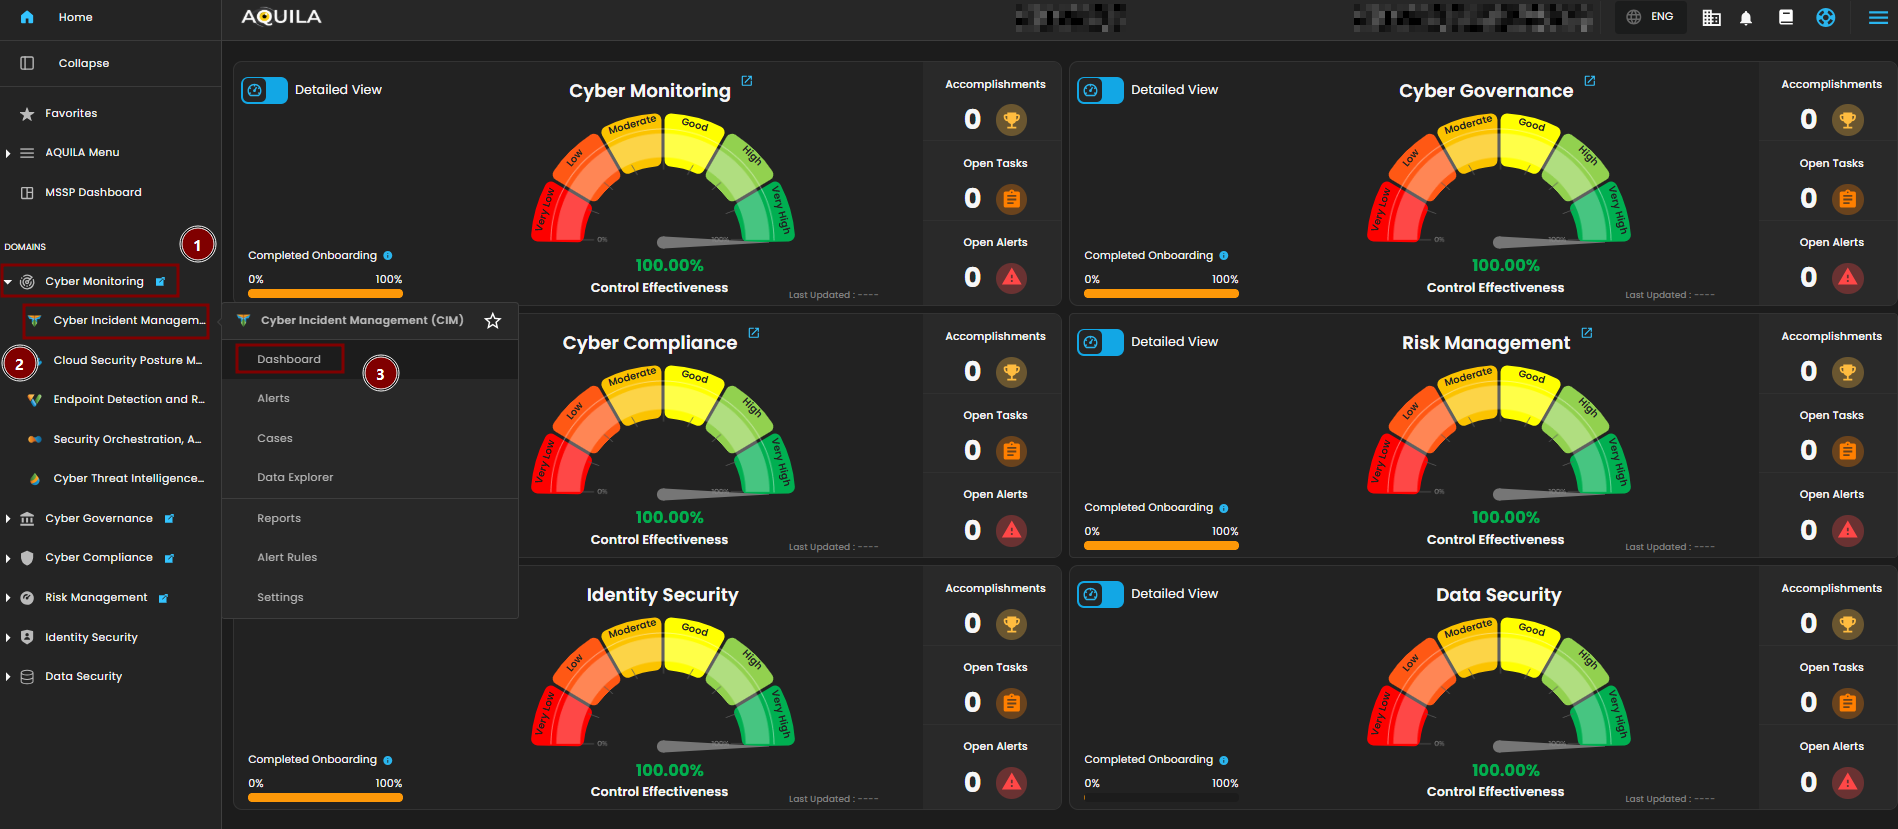
Step 1: Log in to CyTech - AQUILA. click here --> AQUILACYBER.ai
Step 2: In the left column click Cyber Monitoring -> Cyber Incident Management (CIM) -> Dashboard
Cyber Incident Management (CIM) Dashboard
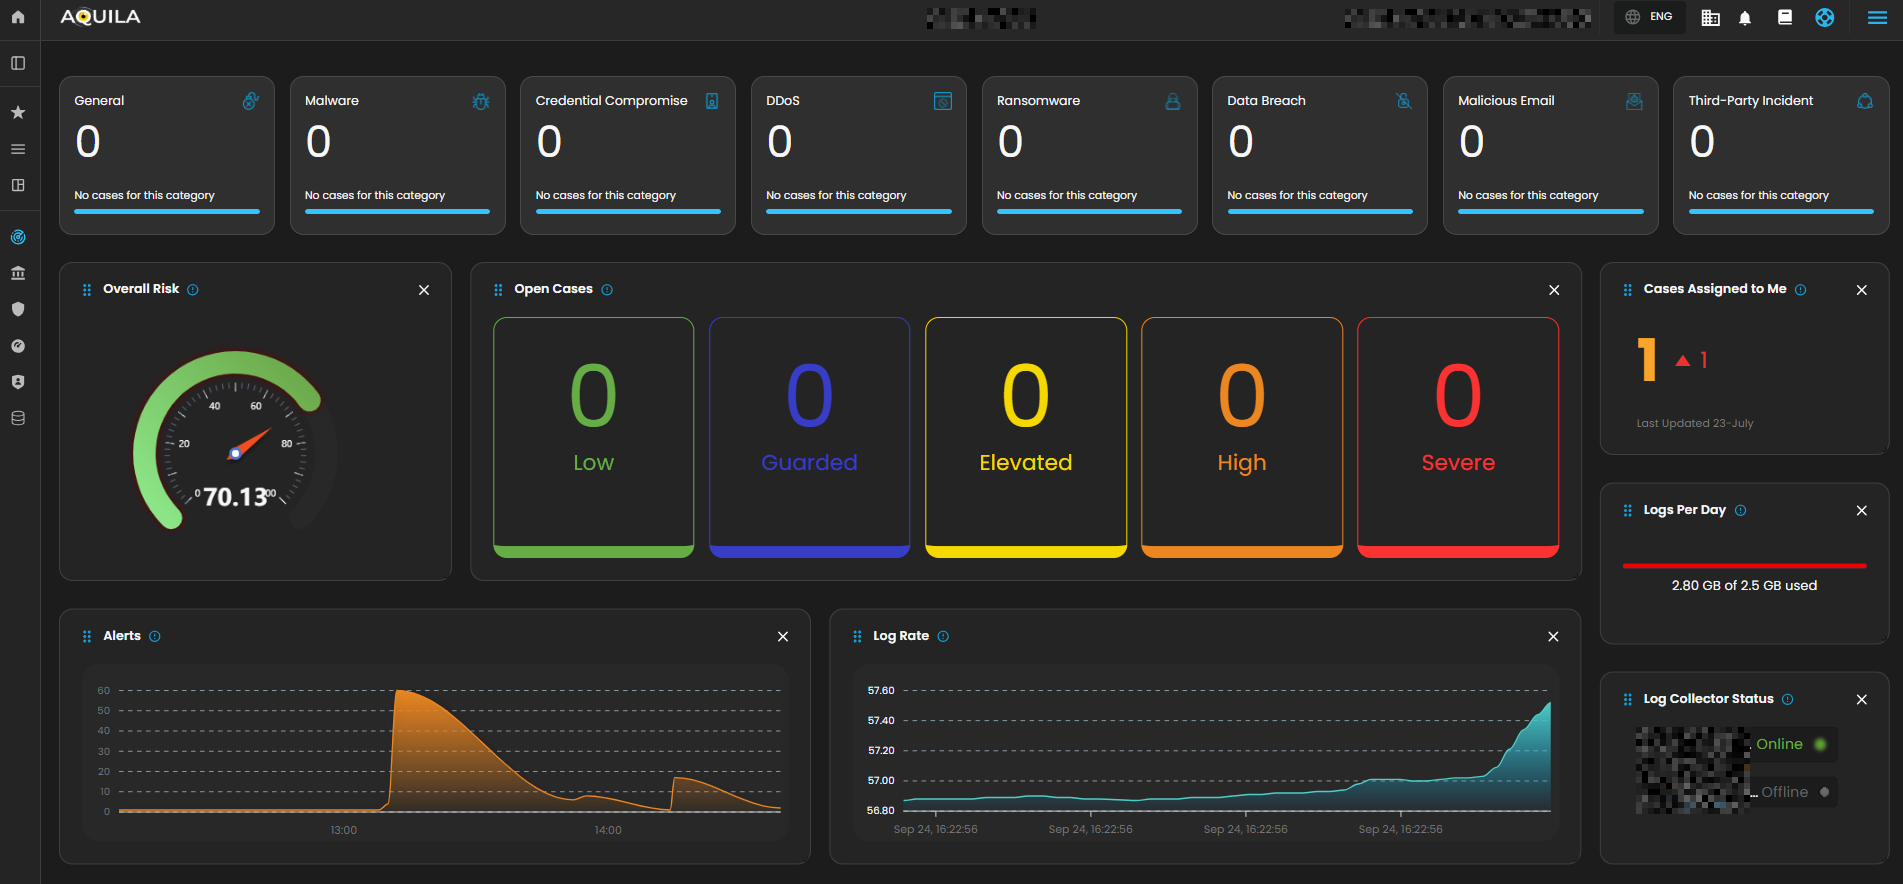
The Main Dashboard serves as the central hub for viewing all critical and relevant data associated with this module. It provides a consolidated interface where key metrics, updates, and operational insights are displayed for quick reference and effective monitoring.
Case Categories
This panel displays and categorizes all cases within your environment that are currently open or in progress. It presents a structured view based on case categories, offering a clear summary of ongoing activity. This allows for efficient tracking, prioritization, and management of active investigations.

Upon selecting a category, a new window will automatically open, displaying all cases associated with the selected category.
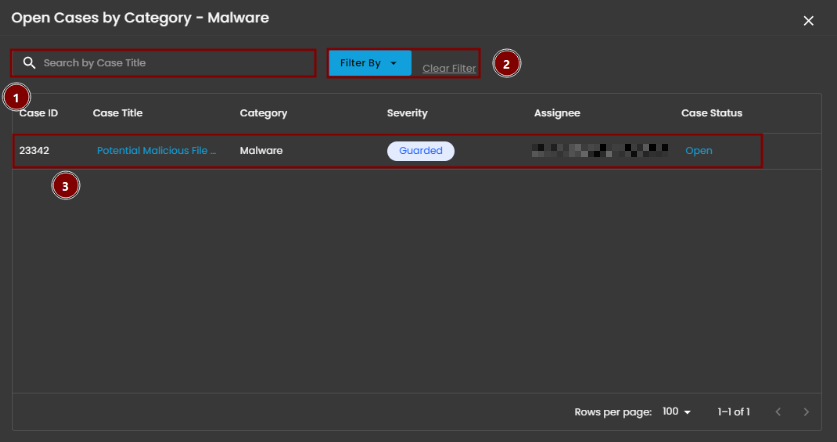
- Search Bar: The search bar enables users to locate a specific case by entering the exact case title. Simply type the desired title into the search field to quickly retrieve relevant results.
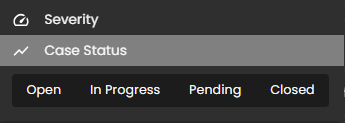
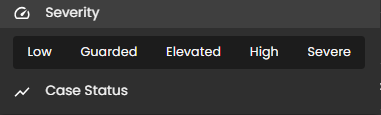
- Filter By & Clear Filter: This feature enables users to refine the list of cases by applying filters based on Severity and Case Status. Use the Filter By option to display only the cases that match specific criteria. To remove all applied filters and return to the full list of cases, use the Clear Filter option.

- Case Details: To access the investigation section of a case, double-click on the case entry. This action will automatically redirect you to the detailed investigation interface for further analysis and review.

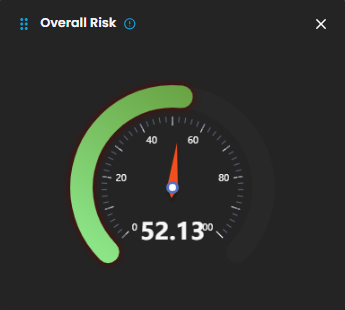
Overall Risk
Displays system risk severity levels on a scale from Low to Severe (0 - 100), explaining the rationale behind risk classifications and showing the highest severity level present in the system. Clicking on the gauge allows you to view more details about.

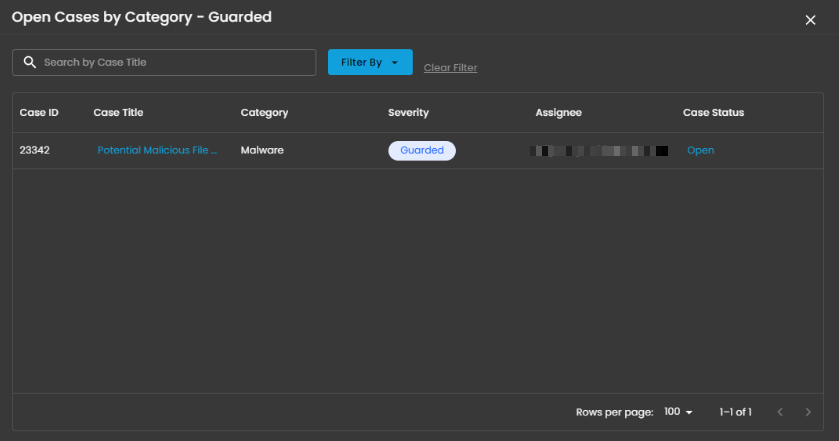
Open Cases
Displays the total number of open cyber incident cases, categorized by severity, that are currently being investigated.
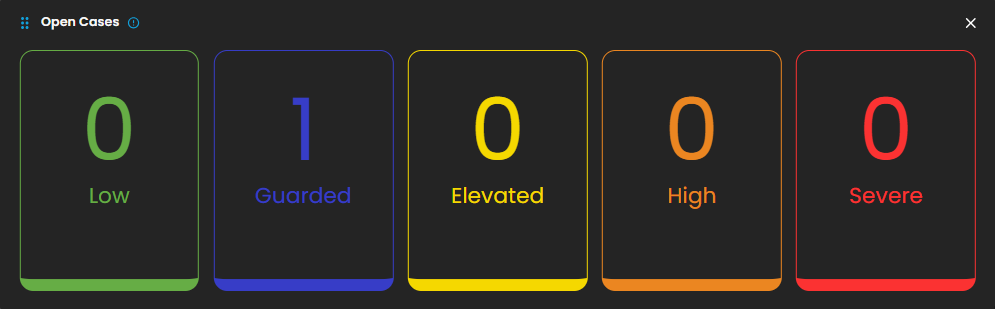
When you click on a category, you will see all the cases that fall under that severity level. For example, as shown in the image above, selecting the “Guarded Severity” category will display all cases labeled as guarded severity.
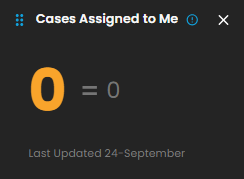
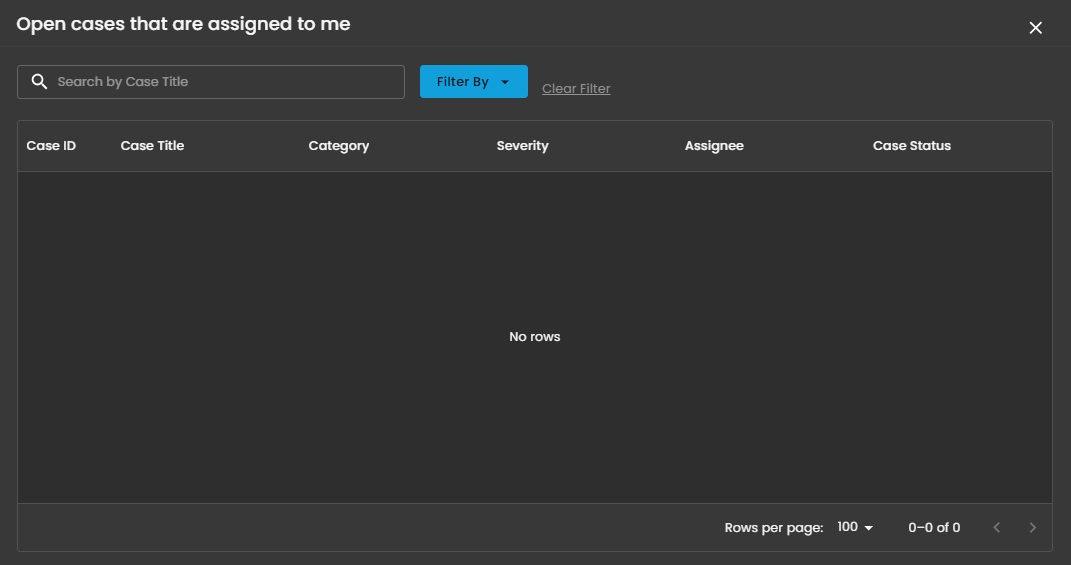
Cases Assigned to Me
Shows the number of cyber incident cases specifically assigned to you for investigation and resolution. Clicking on it will open up a small window that will show all the cases assigned under you.
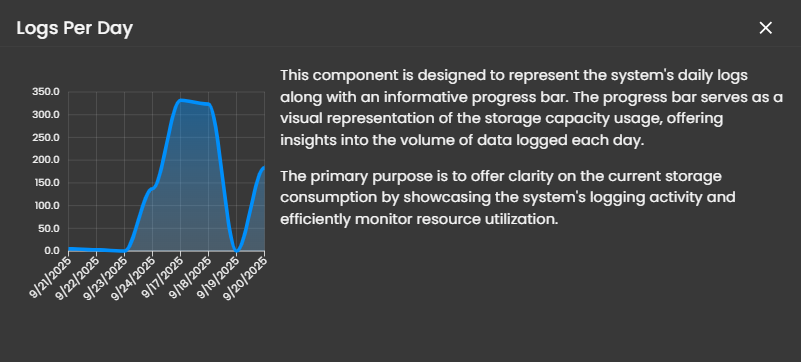
Logs Per Day
Displays daily system logs with a progress bar that tracks storage capacity usage, providing clear insights into daily logging volume and resource consumption.
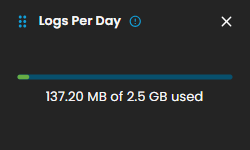
When you click on it, a small window will appear displaying a graph.
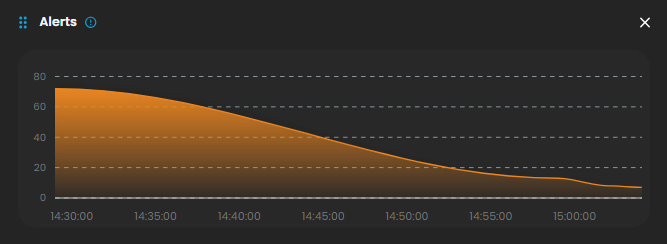
Alerts
Display the trends of the detections generated by the system, highlighting potential security incidents that require immediate attention. Clicking on it will open up a small window that will show all the alerts that was recently triggered.
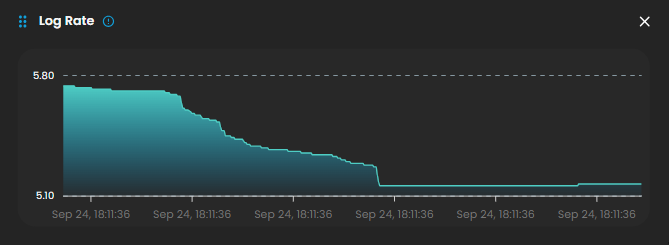
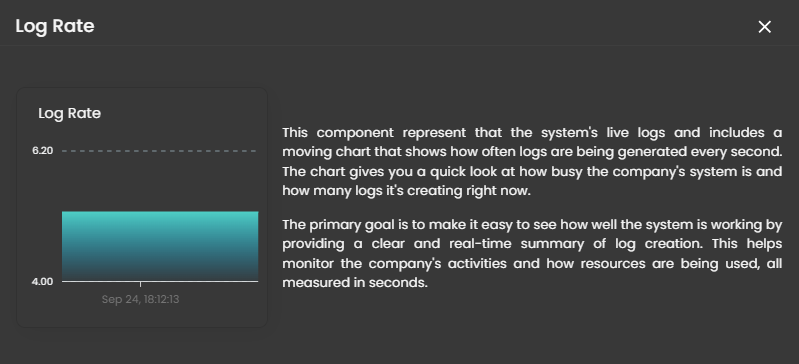
Log Rate
A real-time visualization to display system log generation frequency per second through a dynamic chart, enabling instant monitoring of system activity and resource utilization. Clicking on it will open up a small window that will show the detailed explanation.
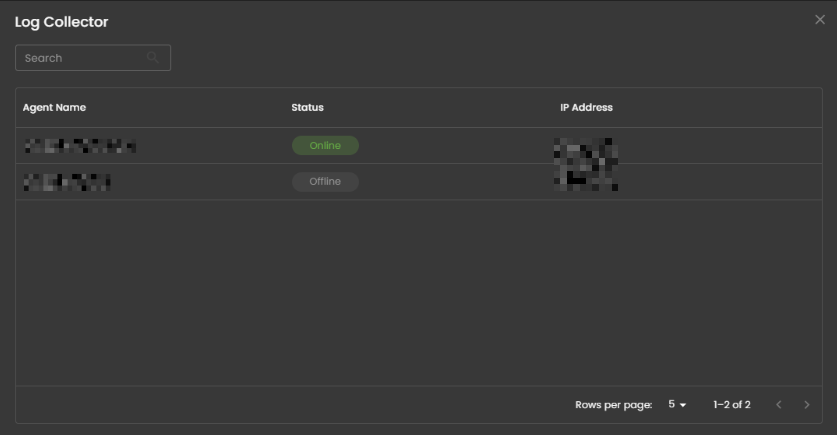
Log Collector Status
Indicates the current status of the log collector, ensuring that logs are being collected and monitored for any suspicious activity.

When you click on it, a small window will appear showing all installed log collectors along with their current status.
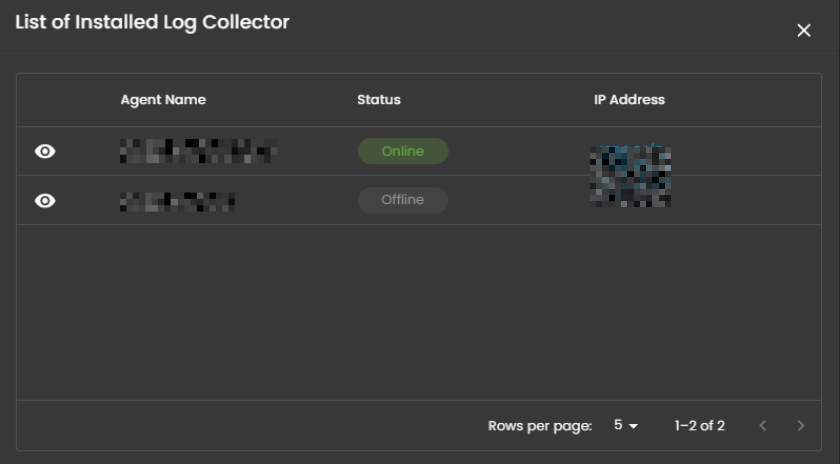
Click the eye icon next to the log collector name to go to the Log Collector List page.

________________________________________________________________________________________________________________________________________________
Cyber Incident Management (CIM) Alerts
Alerts Dashboard is a tool that provides real-time security alerts and notifications. It provides a unified view of different types of alerts, categorizing them by severity and type, and displays critical details such as the source of the alert, affected assets, and relevant information. This dashboard enables security teams to quickly assess, prioritize, and respond to potential threats by offering comprehensive insights and plays a crucial role in enhancing situational awareness and streamlining the incident response process.
Alerts Status Types
Open Alerts: Alerts awaiting assignment to an analyst for further investigation.
Acknowledged Alerts: Alerts currently in progress and assigned to an analyst for resolution.

Closed Alerts: Alerts that have been successfully resolved and closed.

Log Collector Health
Indicates the current status of the log collector, ensuring that logs are being collected and monitored for any suspicious activity.

When you click on it, a small window will appear showing all installed log collectors along with their current status.
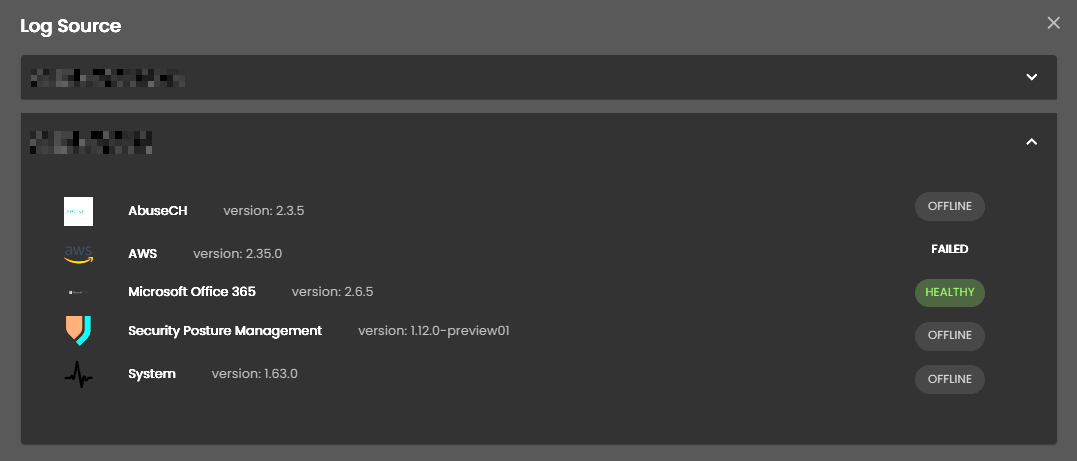
Log Source
These are the various systems, applications, or devices that generate data sent into AQUILA for indexing, storage, and analysis. These sources provide visibility across infrastructure, applications, and security operations.

When selected, a dialog window is displayed showing all installed log collectors. You can switch between collectors to view the integrated log sources associated with each one, along with their respective versions and current status, including whether log ingestion is functioning properly.

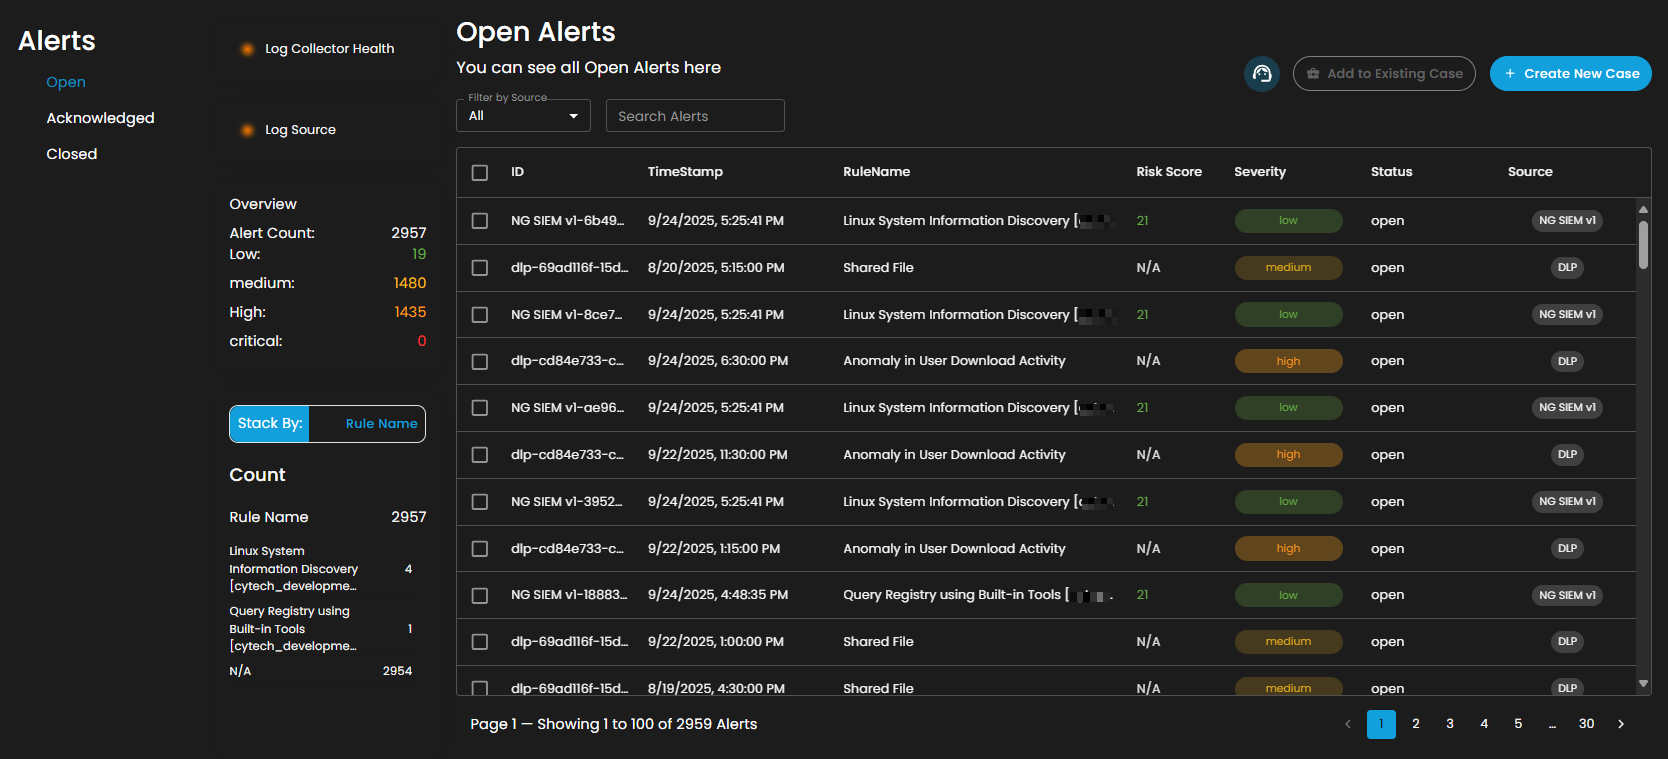
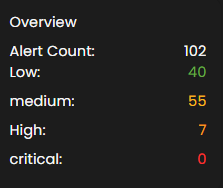
Overview
It provides an overview of alert counts categorized by status type, including the total number of alerts and their distribution across severity levels.
Stack By Rule Name
This view displays a summary of alerts grouped by their corresponding detection rules. At the top of the panel, the total number of alerts is presented. Below this, each rule is listed alongside the count of alerts it has generated. Users can scroll through the list to view additional rules when the number of entries exceeds the visible space. This view enables quick identification of which detection rules are generating the highest volume of alerts, supporting prioritization and investigation activities.

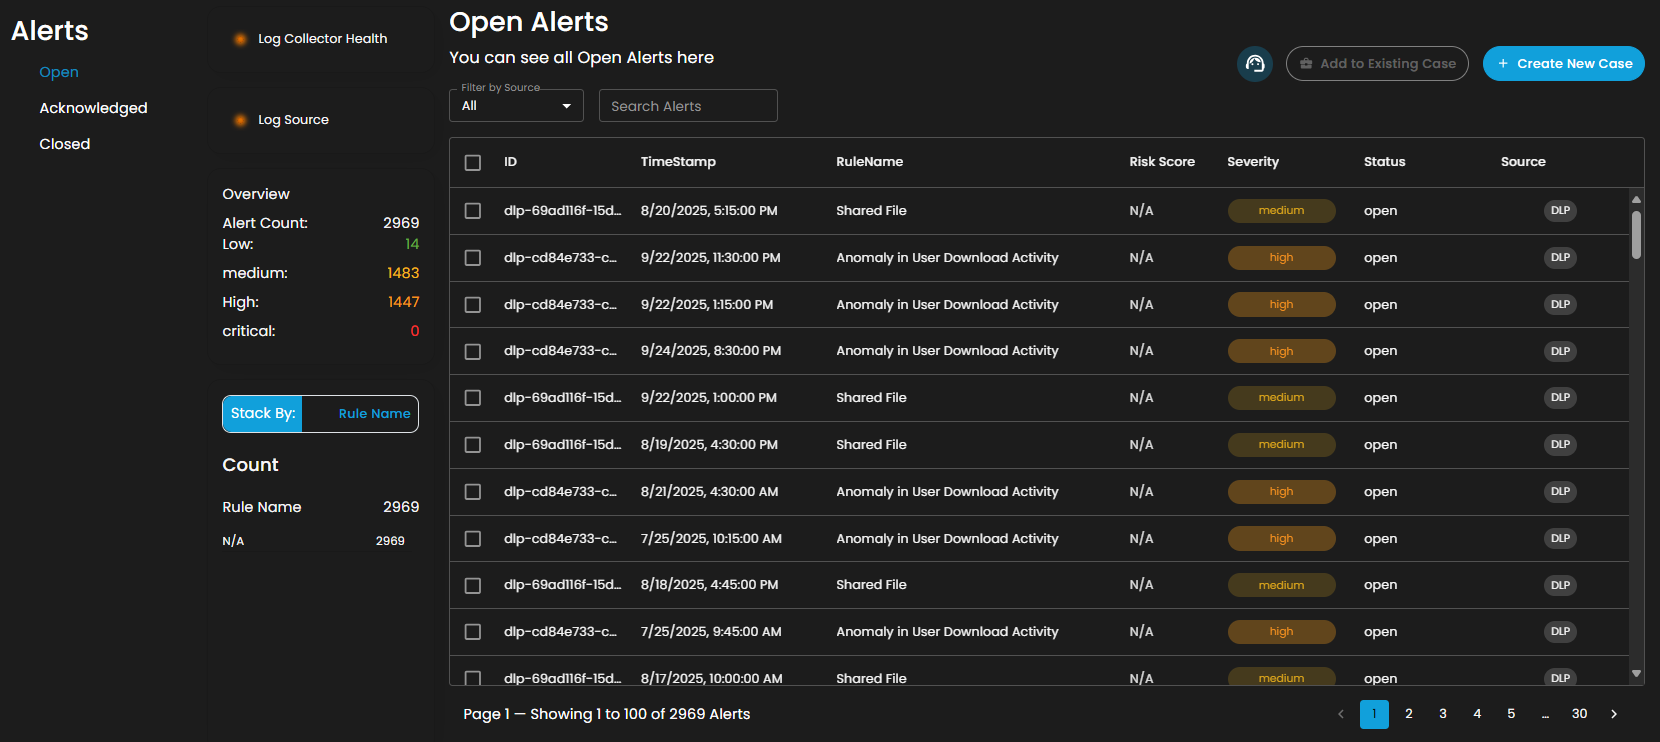
Filter by Source and Search box
Filter by Source: This dropdown menu allows users to filter alerts based on their originating source. Selecting a specific source will limit the displayed alerts to only those generated by the chosen system or log source, while the default All option displays alerts from every available source.
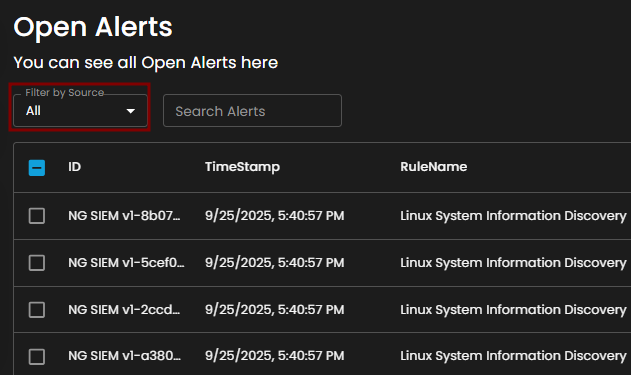
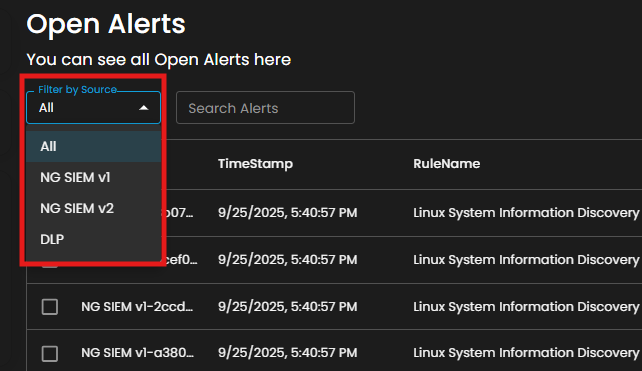
Search Alerts: This text-based search field enables users to query alerts by keywords, rule names, IDs, or other relevant attributes. Entering a search term dynamically filters the alert list, allowing users to quickly identify and focus on alerts of interest.
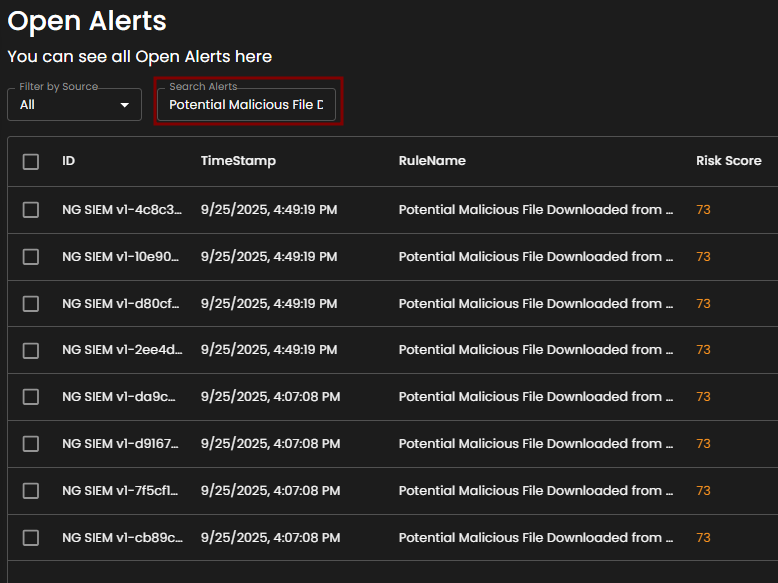
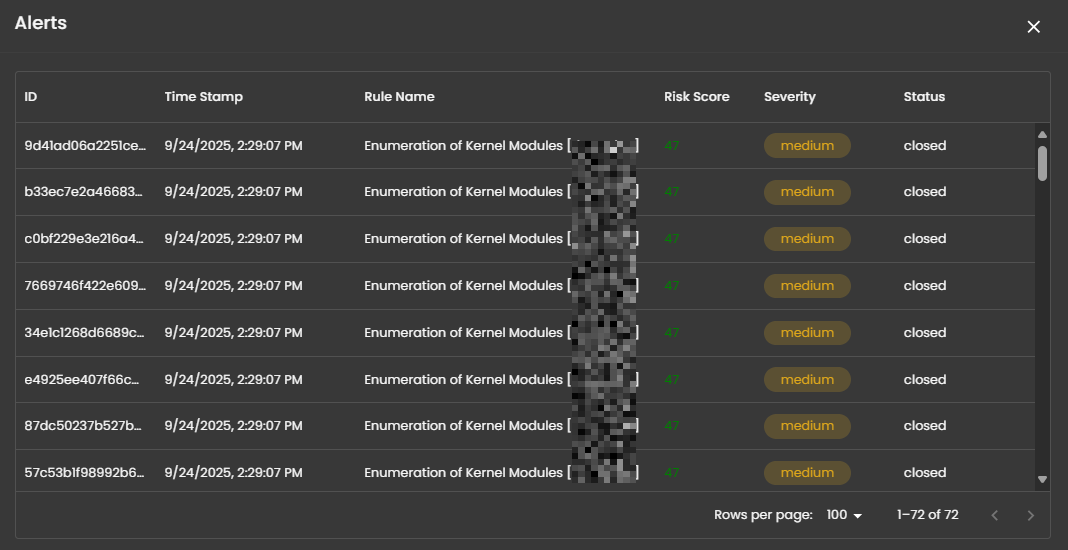
Alerts Information
Alerts Table provides a detailed view of all alerts, organized in a tabular format for efficient monitoring and analysis. Each entry contains the following fields:
-
ID: A unique identifier automatically assigned to each alert.
-
Timestamp: The date and time the alert was generated, displayed in a standardized format.
-
Rule Name: The detection rule that triggered the alert, enabling correlation with specific monitoring logic.
-
Risk Score: A numerical value representing the assessed risk level of the alert.
-
Severity: The severity classification (e.g., low, medium, high, critical) that contextualizes the potential impact of the event.
-
Status: The current workflow state of the alert (e.g., open, acknowledged, closed).
-
Source: The originating source of logs that produced the alert.
The table supports pagination to manage larger datasets, with navigation controls located at the bottom of the view. This ensures users can efficiently browse and review alerts when the total number exceeds the displayed entries per page.

Create a Case
Case Creation involves initiating a new incident case when a security alert is detected. This process includes documenting key details about the alert, categorizing and prioritizing the case based on its severity and impact, and tracking all investigation and response activities. By creating a case, security teams can organize and manage the incident comprehensively, ensuring that all related actions and communications are centralized, which facilitates effective resolution and improves overall incident handling.
To create a case, you can opt to choose either to create a case from the Alerts Dashboard or the Case Management Dashboard.
To create a case:
- Select an alert
- Click the create new case button as shown below
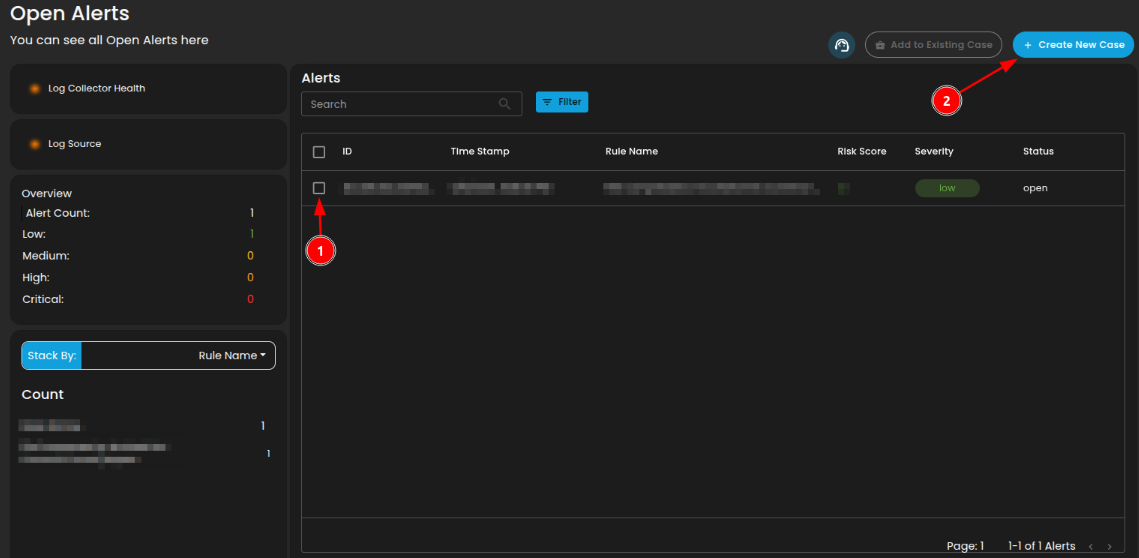
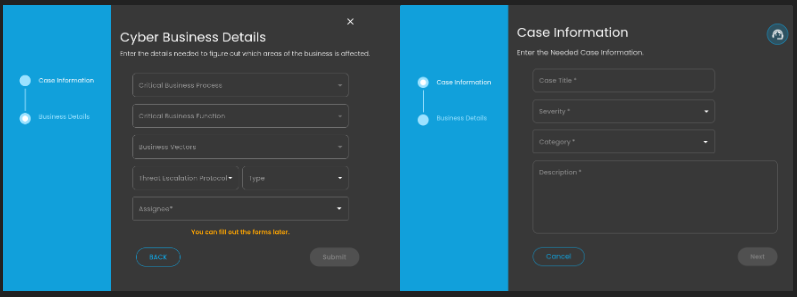
Doing so will show a modal where information is required to create a case for investigation