AQUILA - Nginx Integration (Ubuntu or Linux Platform)
Overview
The Nginx Integration provides comprehensive monitoring and observability for Nginx servers, enabling visibility into both logs and metrics data. This integration ensures effective tracking of server performance, user activity, and error occurrences, supporting proactive management and troubleshooting of Nginx environments.
It collects two main types of data:
-
Logs — Capture and record events occurring within the Nginx server. These include access logs (client requests) and error logs (issues encountered during request handling). Log data helps in auditing activities, identifying issues, and analyzing request patterns.
-
Metrics — Provide real-time performance insights into Nginx server operations. Metrics include details such as the total number of active client connections, connection states, request counts, and other performance indicators essential for capacity planning and system optimization.
By utilizing this integration, administrators gain visibility into both operational and performance aspects of Nginx, enabling effective monitoring, troubleshooting, and optimization of web infrastructure.
Prerequisites
Before setting up the Nginx Integration, ensure that the following requirements are met:
-
Nginx Server Installed and Running
-
A functioning Nginx server must be installed on your host system.
-
Verify that the Nginx service is active and accessible.
-
-
Access Permissions
-
Administrative or root privileges are required to configure log file paths and enable the Nginx status module.
-
Read permissions must be granted for Nginx log files (e.g.,
access.loganderror.log).
-
-
Nginx Status Module Enabled
-
The stub_status module should be enabled to allow collection of server metrics such as active connections and request rates.
-
Add or verify the following configuration in your Nginx configuration file (usually located in
/etc/nginx/sites-enabled/default.conf):
-
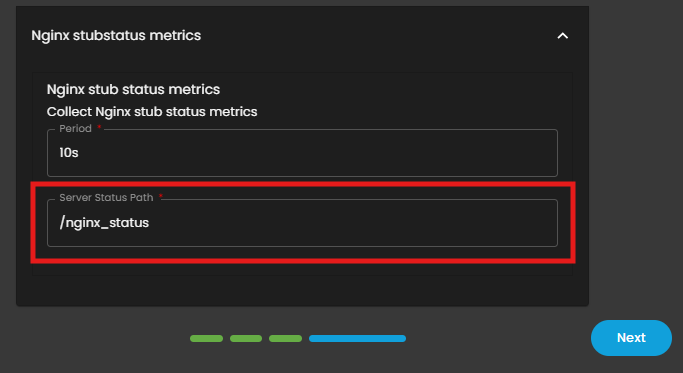
location /nginx_status {
    stub_status on;
    access_log off;
    allow 127.0.0.1;    # restrict access as needed
    allow <Network_IP>;
    deny all;
}- Restart Nginx after making changes:
sudo systemctl restart nginx4. Network Connectivity
- Ensure that the system where monitoring is configured can connect to the Nginx host via the appropriate network ports (typically port 80 or 443).
5. Log File Availability
- Confirm that standard Nginx log files are present in their default or custom locations:
- Access logs:
/var/log/nginx/access.log - Error logs:
/var/log/nginx/error.log
- Access logs:
Step 1: Install Log Collector Agent
On the device where Nginx Server is installed, you must also install the AQUILA Log Collector Agent. This agent is responsible for collecting the Nginx access and error logs and forwarding them to AQUILA for processing.
Please refer to the official manuals for installing the AQUILA Log Collector Agent on different operating systems:
Ensure that after installation, the Log Collector service is running properly.
Step 2: Integrate Nginx on AQUILA
-
Log in to the AQUILA site.
-
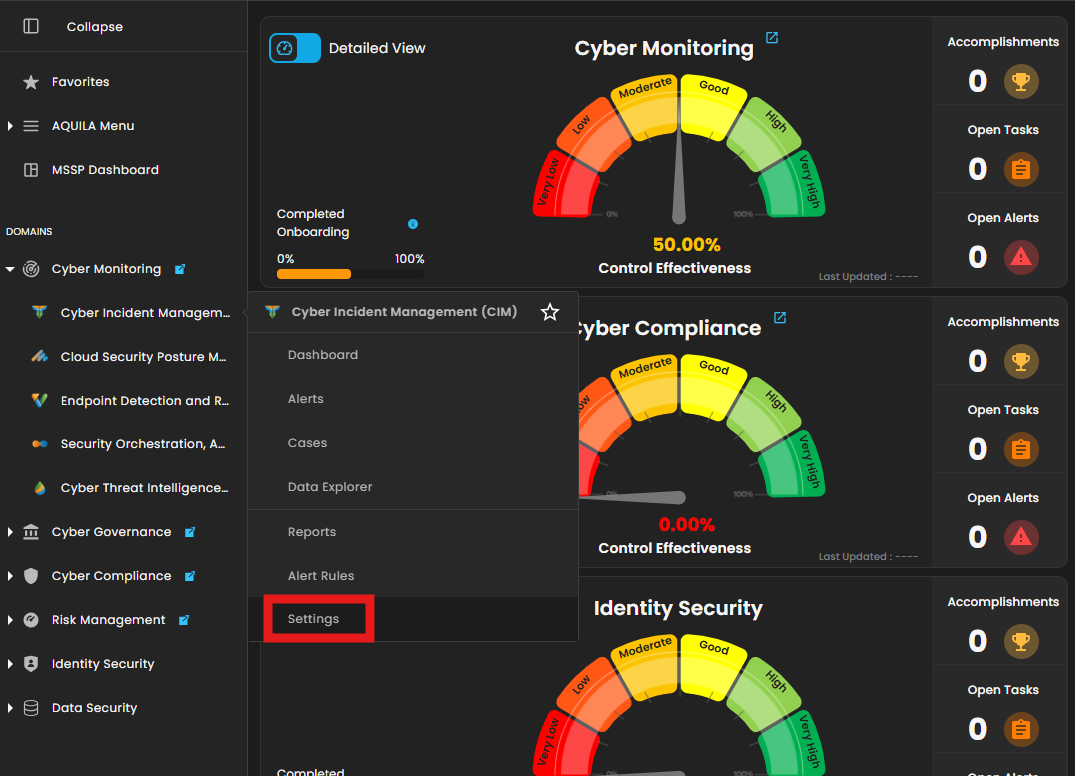
Navigate to Cyber Monitoring → Cyber Incident Management (CIM) → Settings.
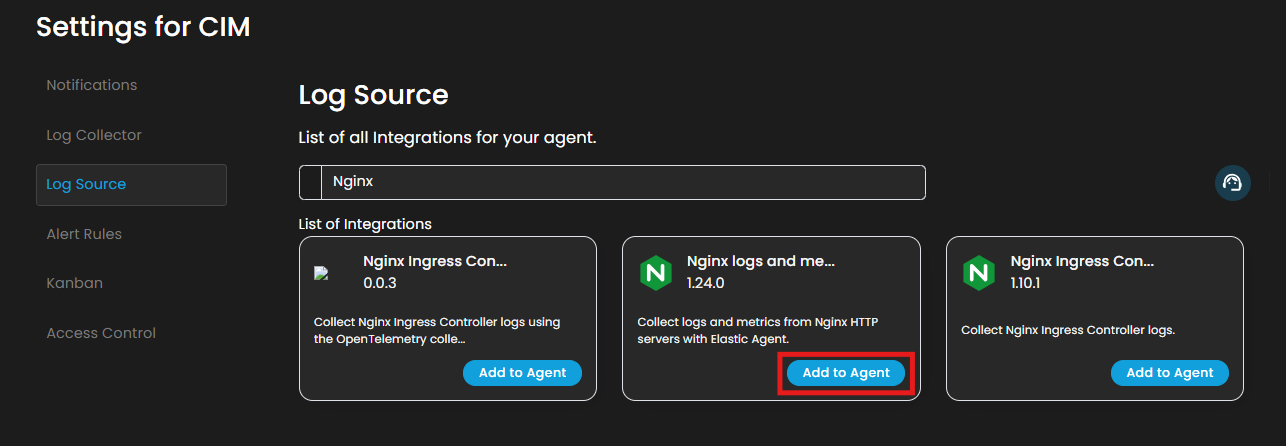
3. In Settings for CIM, go to Log Source. In the Search Integration textbox, type "Nginx" and choose Nginx logs and metrics and then click Add to Agent.
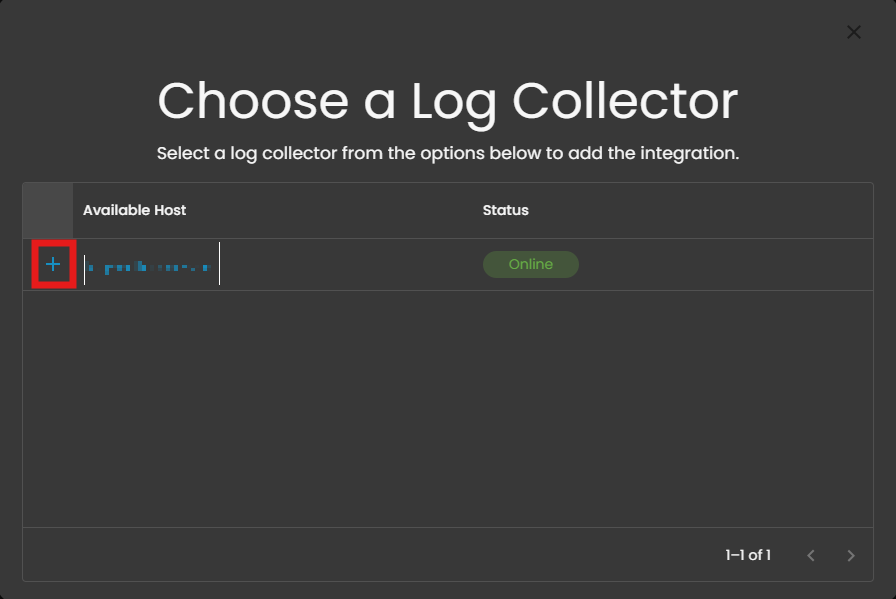
4. Choose the Log Collector that was installed earlier and click the + button.
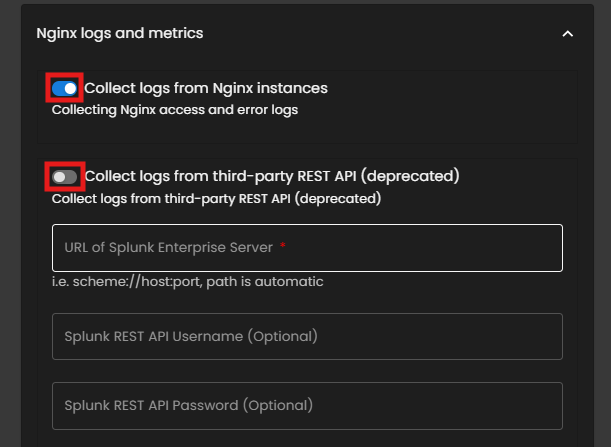
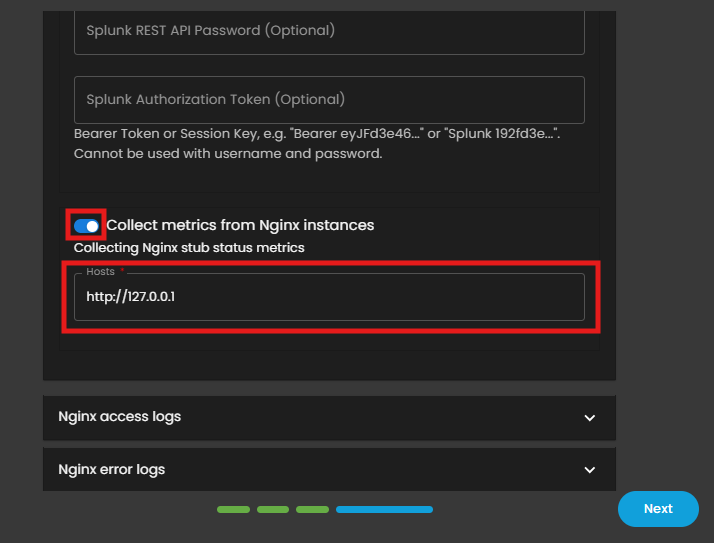
5. In the Nginx Logs and Metrics section, disable the option to Collect logs from third-party REST APIs, and ensure that Collect logs from Nginx instances remains enabled.
6. Scroll down and ensure that Collect metrics from Nginx instances is enabled. In the Hosts field, enter the Loopback IP address of the device where both the Nginx Server and Log Collector Agent are installed. By default, this address is 127.0.0.1, unless it has been modified.
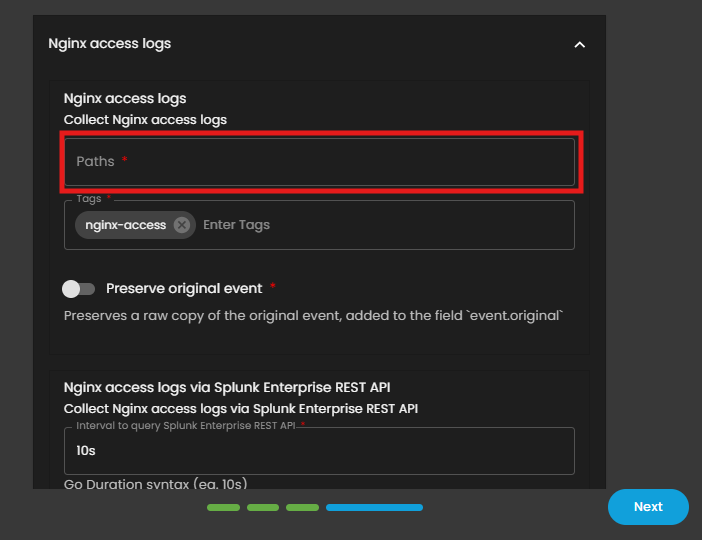
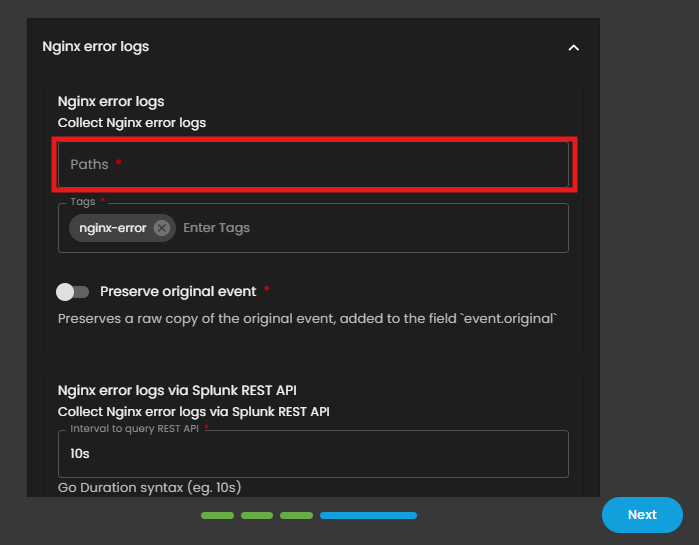
7. For the following log types, specify the exact file paths:
-
Access Logs: e.g.,
/var/log/nginx/access.log* -
Error Logs: e.g.,
/var/log/nginx/error.log*
Note: Ensure that each path ends with an asterisk (*) to include all relevant log files.
8. Once all paths and tags have been entered, click Next to continue.
9. Wait for the Successful window to display, this will confirm the successful integration.
If you need further assistance, kindly contact our support at support@cytechint.com for prompt assistance and guidance.