User and Entity Behavior Analysis (UEBA)
Overview
This system is designed to monitor user behavior, detect anomalies, and track authentication activities to ensure the security of your environment. It provides a comprehensive view of risky users, anomaly detection trends, and authentication attempts, allowing you to identify and respond to potential security threats in real time. The dashboard offers a detailed breakdown of user activity, anomaly severity, and geographical distribution of anomalies, all while tracking critical events and user behaviors over time.
Key Features
-
Top Risky Users:
-
Displays a list of users ranked by risk scores, identifying those with the highest likelihood of abnormal behavior or security risk.
-
Each user is associated with their risk score and the timestamp of their last activity.
-
-
Authentication Monitoring:
-
Tracks the number of successful and failed authentication attempts, helping to identify potential login issues or unauthorized access attempts.
-
Provides overall user statistics, such as the total number of users and the frequency of authentication events.
-
-
Anomaly Detection:
-
Shows detected anomalies, categorized by severity (Critical, Major, Minor, etc.).
-
The system presents anomalies in both a timeline view and a geographical map, helping you spot unusual activity across different locations.
-
Displays a breakdown of anomalies by job and source IP address to assist in pinpointing the origin of issues.
-
-
Anomalies by Severity:
-
The severity of detected anomalies is visually represented, allowing you to prioritize issues based on their criticality.
-
Currently, no anomalies are detected, but the system can provide detailed reports when irregularities occur.
-
-
Anomaly Timeline:
-
Tracks the occurrence of anomalies over time, offering insights into patterns and trends.
-
A timeline helps visualize any spikes or shifts in anomaly occurrences, highlighting potential periods of increased risk.
-
-
User Activity Monitoring:
-
Offers a timeline-based view of user activity and anomaly occurrences over specific time periods, assisting in the detection of abnormal behaviors over time.
-
To navigate to Unified Compliance Blueprint module, please follow the instructions below:
Step 1: Log in to CyTech - AQUILA: usdc.cytechint.io
Step 2: Click on Identity Security
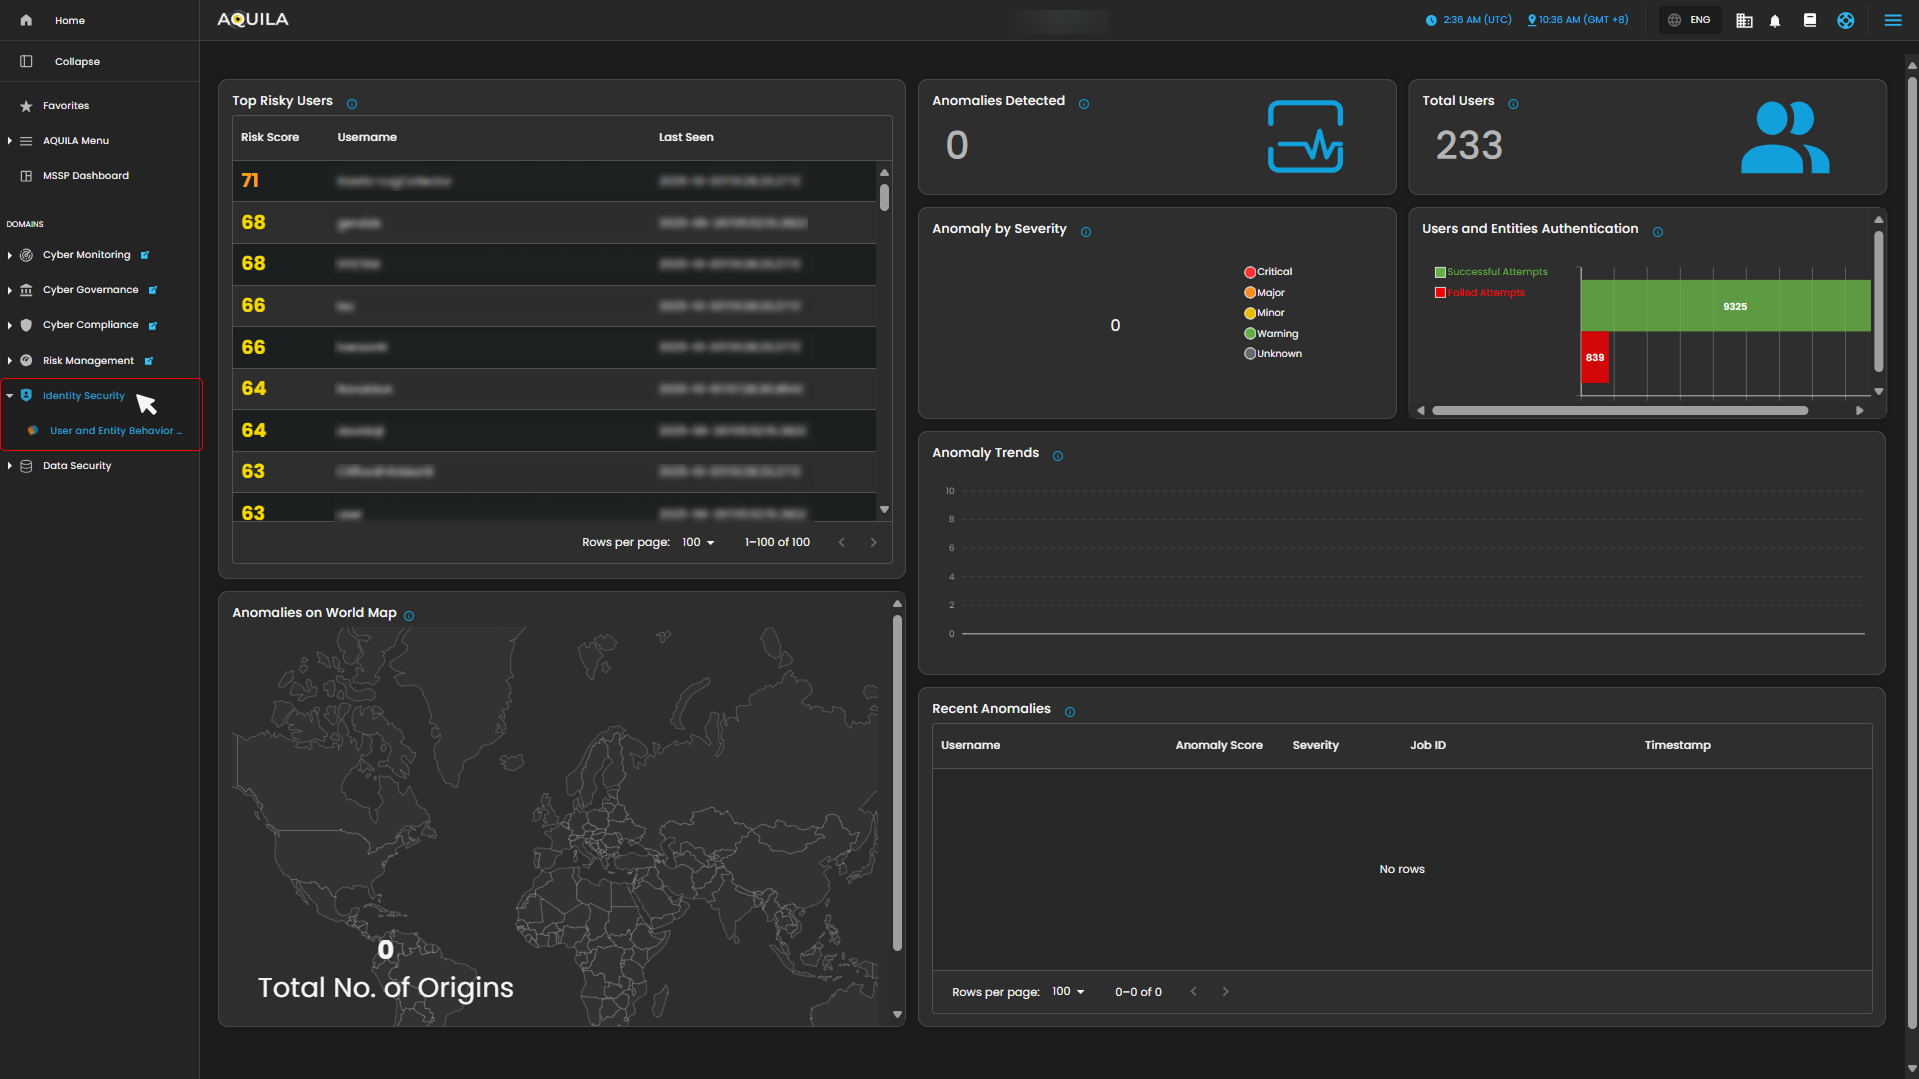
Figure 1. Overview
Step 3: Hover into leftmost panel to view all the Identity Security sections. This Process is applicable in all navigating into a Module.
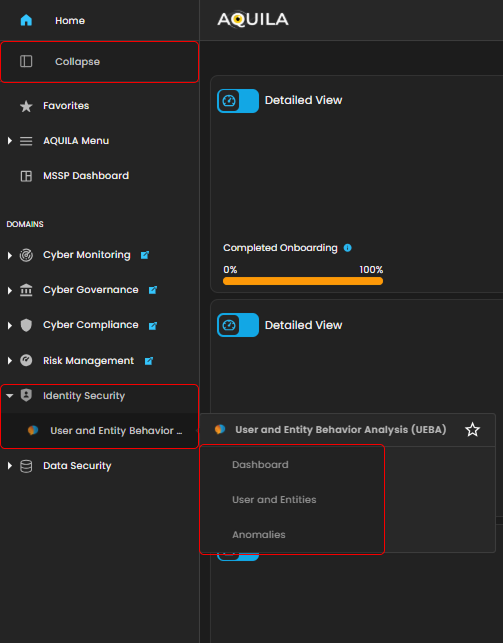
Figure 1.1 Identity Security Navigation
Dashboard
This dashboard is designed for monitoring user activity, identifying risky behavior, and tracking security-related anomalies. It provides key metrics, including the riskiest users, total user statistics, authentication attempts, and geographical distribution of anomalies. The current data shows no detected anomalies and a low number of failed authentication attempts.
1. Top Risky Users
This panel shows a ranked list of users with the highest risk scores. Each entry displays the user’s risk score, username, and the last time they were seen active. This helps quickly identify which accounts may need closer monitoring.
2. User and Anomaly Summary
-
-
Anomalies Detected: Shows the total number of anomalies flagged in the system.
-
Total Users: Displays the total number of registered users in the environment.
-
User Authentication Attempts: A bar graph that compares successful vs. failed login attempts, giving a quick snapshot of login activity and potential suspicious access attempts.
-
Anomaly by Severity: Categorizes anomalies (Critical, Major, Minor, Warning, Unknown) for easier prioritization.
-
3. Anomalies on World Map
A world map showing the origins of detected anomalies. This visualization makes it easy to see if threats are coming from specific regions or globally distributed.
4. Anomaly Trends and Recent Anomalies
-
-
Anomaly Trends: A timeline graph showing how anomalies develop over time, which helps spot unusual spikes.
-
Recent Anomalies: A detailed log listing the most recent anomalies with information like username, anomaly score, severity, job ID, and timestamp.
-
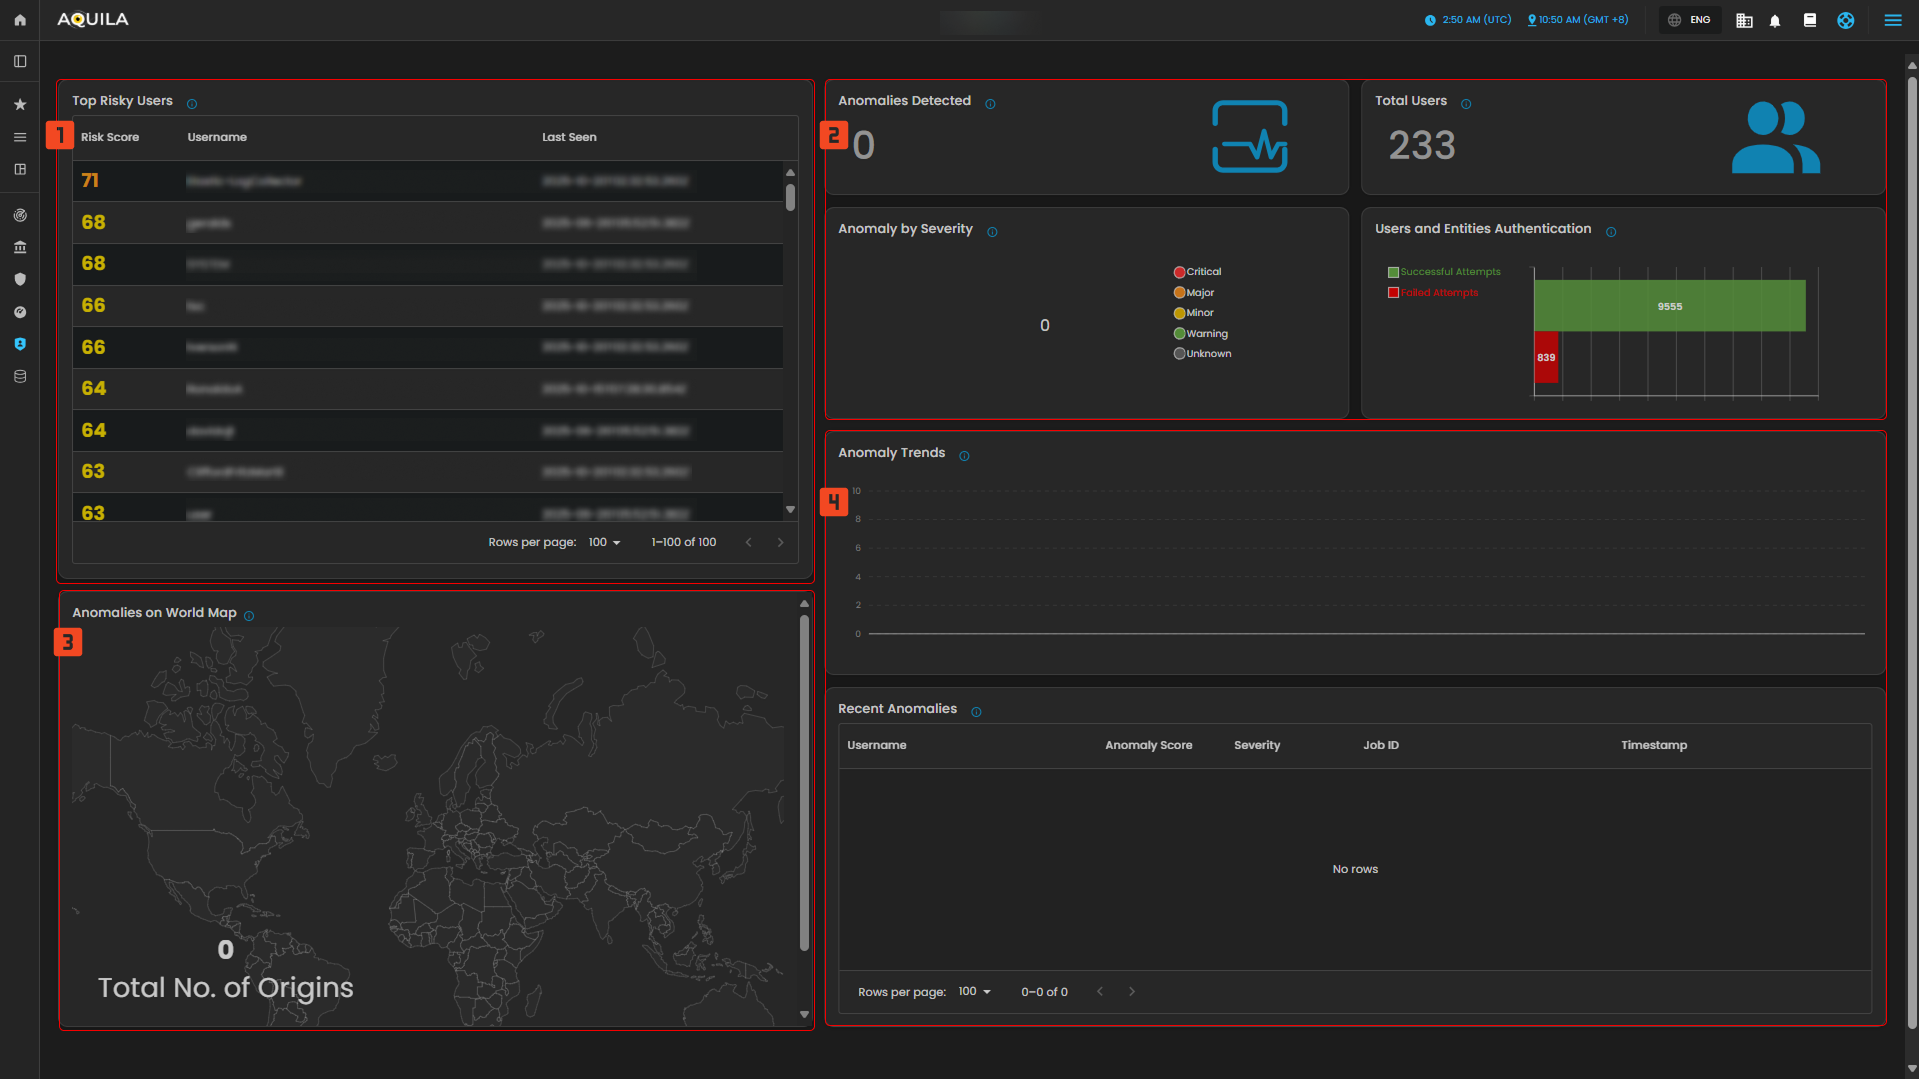
Figure 2. Identity Security - Dashboard
Users and Entity
This image emphasizes user-level analysis, with detailed views of user risk scores, the severity of anomalies detected, and how anomalies have evolved over time. The timeline shows an increase in anomalies, particularly in early October, and there is a noticeable gap between users with more and fewer anomalies.
1. Users
- This part shows a list of users that has higher risk score or lower risk score depending on the filter.
2. Users By Severity & Users by Timeline
- This panel shows a classification of users based on the severity of their anomalous activities and users by timeline shows a chronological distribution of users and their anomalous activities.
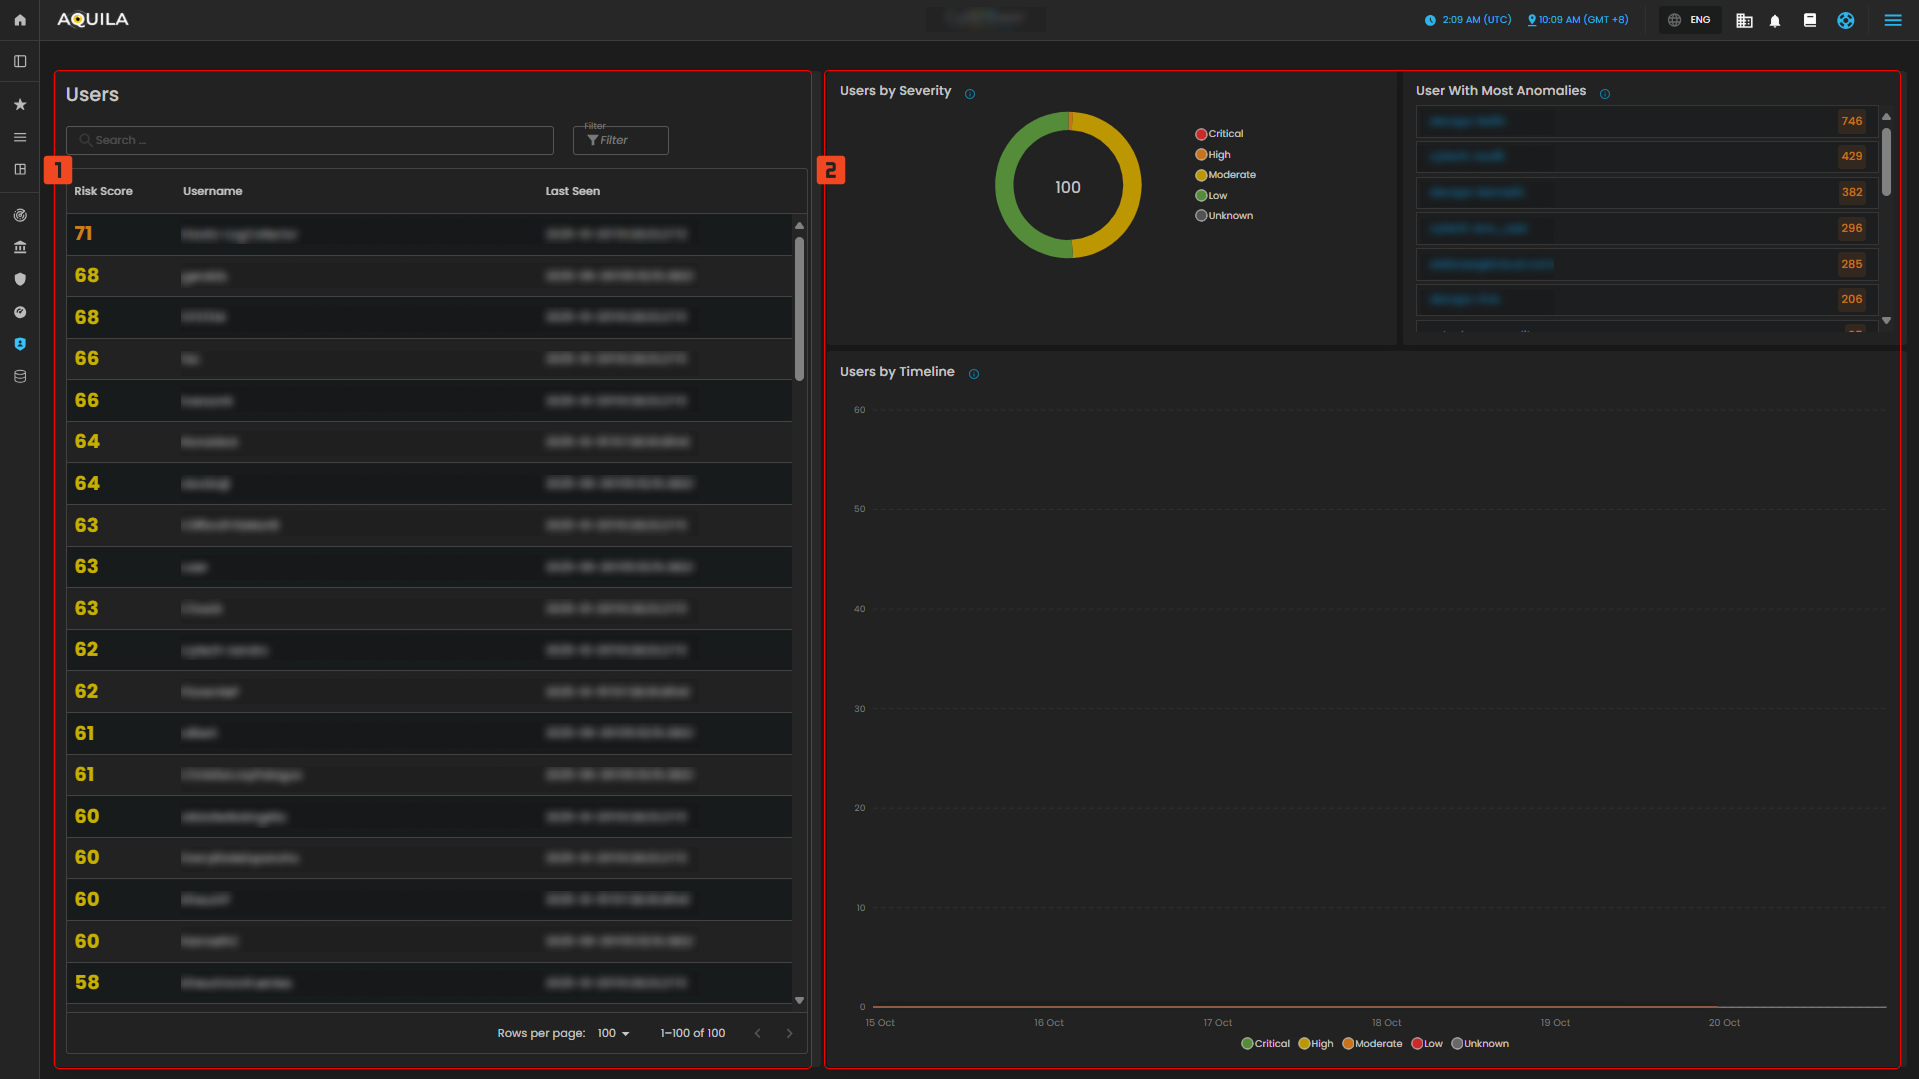
Figure 3. Identity Security - Users and Entities
To navigate to the Anomalies sub-module, click the left-side panel where Identity Security is located, then hover over Identity Security. Identity Security (Domain) → User and Entity Behavior Analysis (Module) → Anomalies (Sub-module).
Anomalies
This image provides an overview of anomaly detection, categorized by severity, source IP, and job. However, no anomalies have been detected in the system at the moment, as indicated by the absence of data in all sections. The system appears to be idle in terms of any current anomaly detection.
1. Anomaly by Severity
- Categorization of Anomalies Based on Their Severity Levels
- Critical
- Major
- Minor
- Warning
- Unknown
2. Top Anomaly Source IP
- Graph of Source IP Addresses Responsible for the Highest Number of Anomalies
3. Anomaly by Job
- Categorization of Anomalies Based on Detection Rules
4. Anomalies
- Displays a list of detected anomalies based on unusual patterns or behaviors identified during system monitoring. Use this view to investigate potential security or performance issues
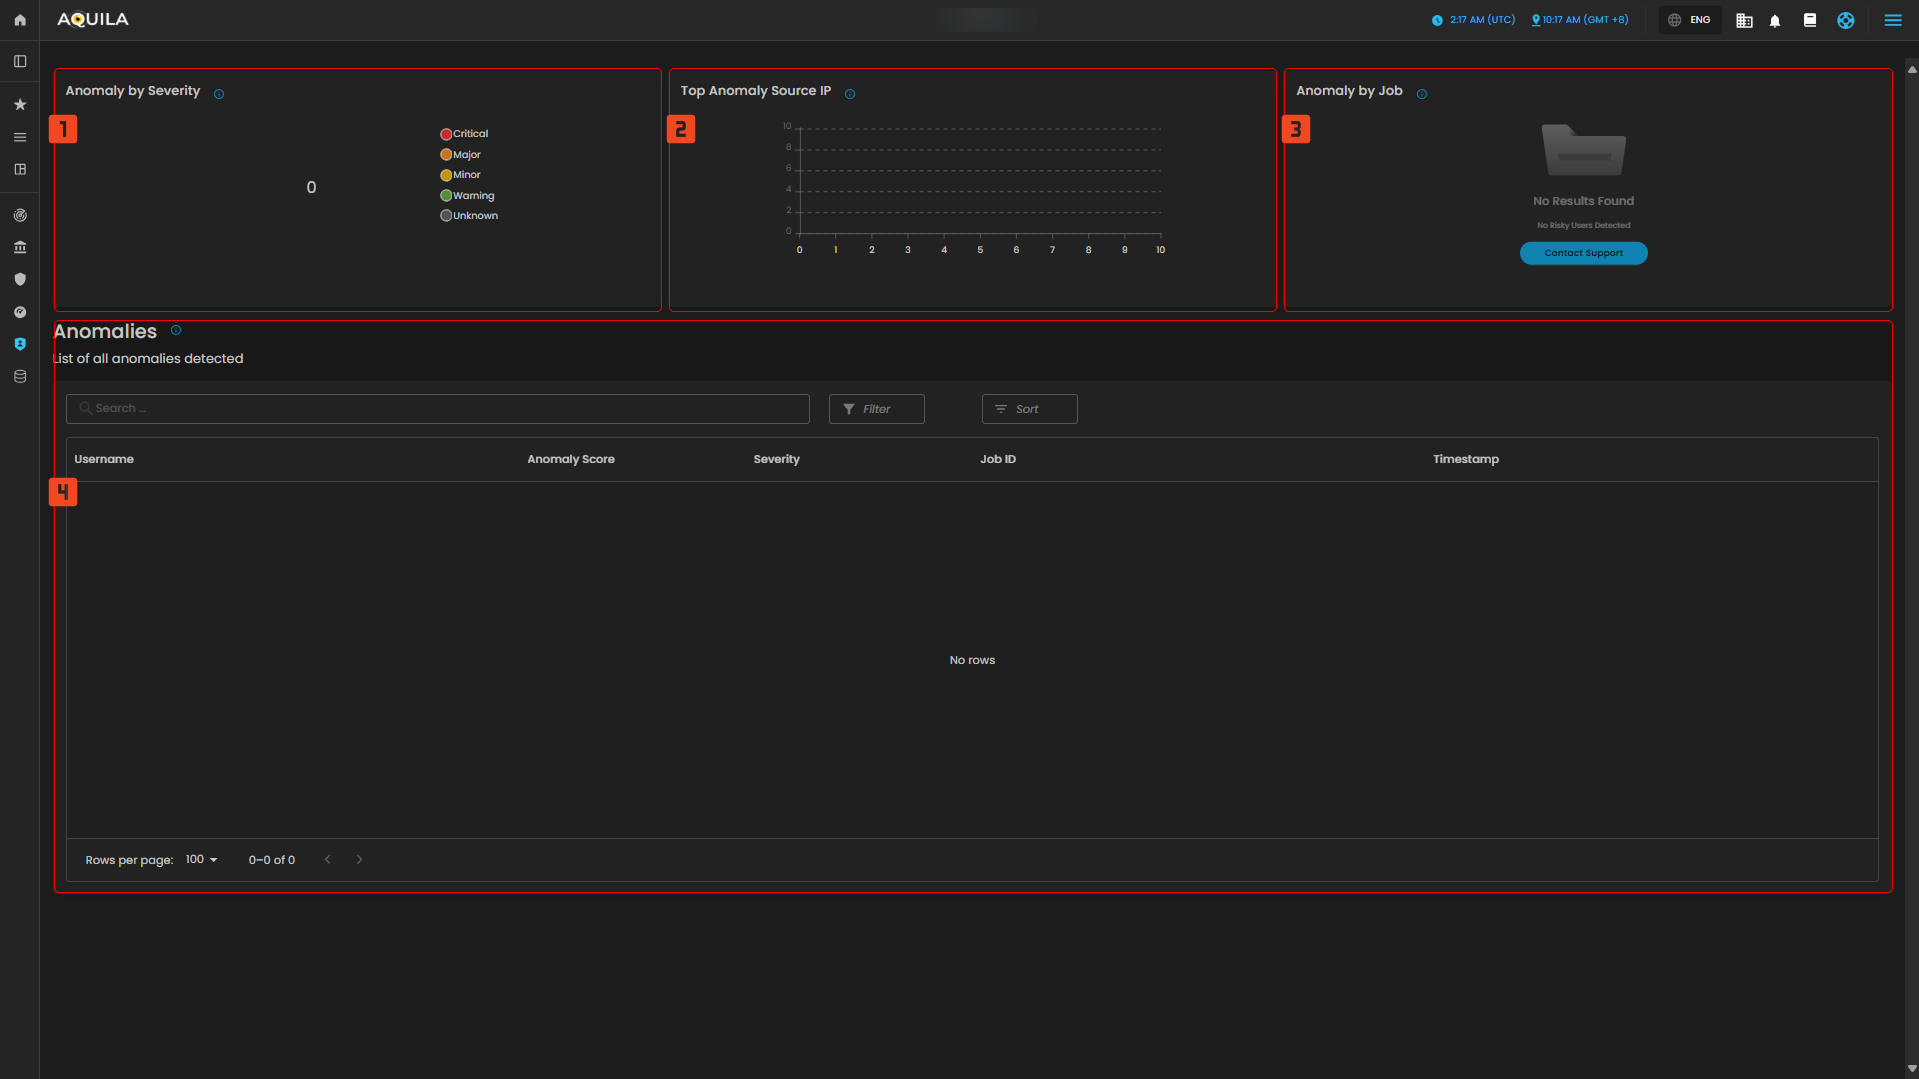
Figure 4. Identity Security - Anomalies
Conclusion
The system provides comprehensive monitoring of user behavior, authentication attempts, and anomaly detection to ensure security. It tracks and ranks users by their risk scores, highlighting potential threats based on abnormal activities. The system also monitors authentication attempts, showing statistics for both successful and failed logins. Currently, there are no detected anomalies, as indicated by the system's zero anomaly count, and there are no critical alerts. Anomalies are categorized by severity, source IP, and job, but no results have been found so far. The system is designed to detect unusual behavior patterns over time, with trends and insights available for review. Although no issues are present at the moment, the system remains vigilant, offering ongoing monitoring for any emerging threats in the future.
If you need further assistance, kindly contact support@cytechint.com for prompt assistance and guidance.
No comments to display
No comments to display