Cyber Annual Workplan
Overview:
The Cyber Annual Workplan Module Dashboard provides a comprehensive view of all ongoing cybersecurity-related tasks and projects for the year. It helps track and manage key milestones, project deadlines, and progress. This ensures that all cyber initiatives are on schedule and aligned with security objectives.
Key Features:
-
Gantt Chart: Visual representation of all cybersecurity tasks over the course of the year, showing progress and deadlines.
-
Task Status Overview: Real-time overview of task statuses, such as new, ongoing, completed, and overdue tasks.
-
Workspaces Overview: Categorization of tasks and projects into specific workspaces for easy management and navigation.
-
Calendar Overview: Visual calendar view to display upcoming deadlines, key milestones, and scheduled project reviews.
-
Progress Tracking: Monitors the completion rate of each task and shows overall project progress.

Figure 1. Overview
Step 3: Choose Cyber Annual Workplan.

Figure 1.1 Cyber Governance Dashboard
Step 4: Hover into leftmost panel to view all the Cyber Governance sections. This Process is applicable in all navigating into a Module.

Figure 1.2 Cyber Governance Navigation
Cyber Annual Workplan Dashboard
In the Cyber Annual Workplan Dashboard, you can track and manage ongoing tasks and projects related to cybersecurity and compliance initiatives. The dashboard includes multiple sections to give you a comprehensive view of task status, progress, and upcoming milestones.

Figure 2. Cyber Annual Workplan Dashboard
- Task Gantt Chart:
- This visual timeline shows the start and end dates of each task, as well as the current progress of each project. The Gantt chart is color-coded to indicate the status of tasks (e.g., completed, in progress, pending).
- Overall Task Progress:
- Displays a circular progress bar showing the overall completion of all tasks and projects within the module. This provides a quick visual indicator of how much work has been completed relative to the total work.
- Task and Projects Overview:
- Lists active tasks and projects, their assigned team members, and important details like due dates and priority. This section provides an organized view of what’s in progress, what’s upcoming, and who is responsible for each task.
- Task Status Overview:
- This widget shows a snapshot of all the tasks in progress, categorizing them by their current status: New Tasks, Unassigned Tasks, Urgent Tasks, etc.
- Workspaces Overview:
- The dashboard also highlights workspaces organized by specific focus areas like Security Compliance, Privacy Compliance, and Cloud Security Posture Management. Each workspace contains projects related to that specific area and provides an easy way to navigate and manage tasks related to these areas.
- Calendar Overview:
- This section displays a calendar with upcoming milestones, deadlines, and task occurrences. Tasks are color-coded based on their status and priority, helping you quickly identify important events and deadlines.
Workspace
The Workspace presents all active cybersecurity-related tasks in a list format. This allows users to view essential task details, such as task titles, assignees, priority, estimated costs, statuses, and key deadlines. The dashboard offers an intuitive way to manage the tasks and monitor their progress throughout the year.
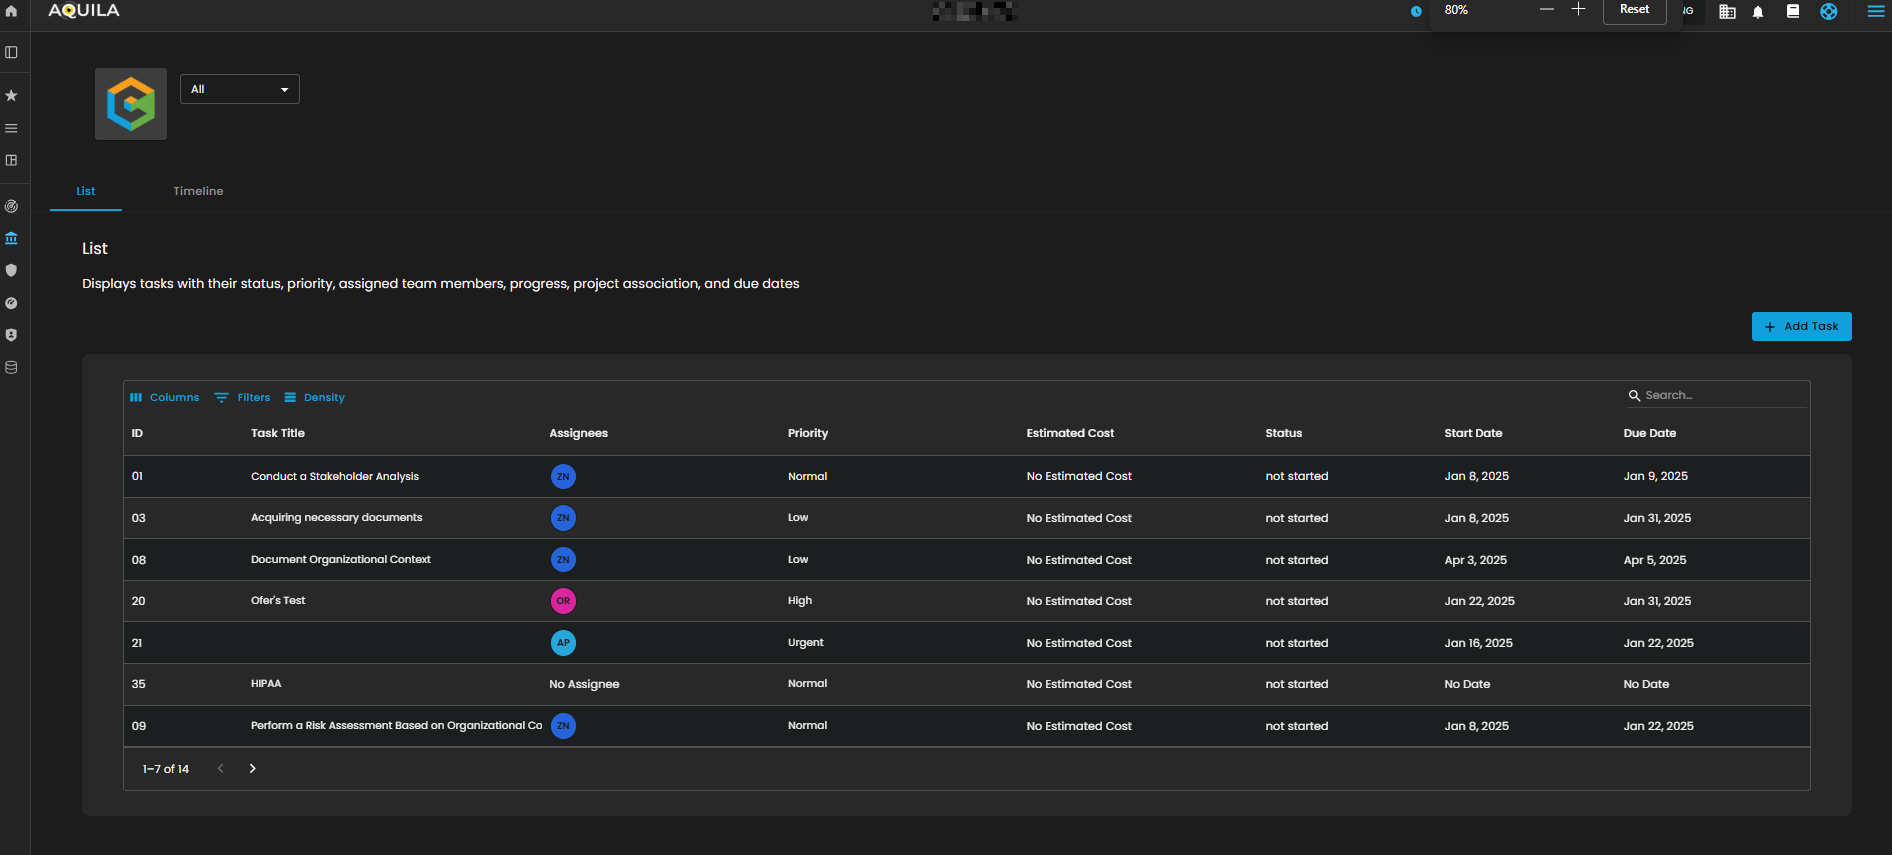
Figure 3. Workspace
List

Figure 3.1 Workspace List View
1. List View (Tab Selection):
- This section gives you the option to view tasks either in a List View or Timeline View. The List View is the default and displays all tasks with their essential details such as status, priority, assignees, and due dates. It's a quick way to check task details in a tabular format.
3. Task Table:
- The Task Table displays a list of tasks with key details such as the Task Title, Assignees, Priority, Estimated Cost, Status, Start Date, and Due Date. This table provides a quick overview of task progress, helping users track who is responsible, the urgency, and when each task is expected to be completed.
Project & Task
The Project & Task section is where you would click to add a task

Figure 3.1.1 Project & Task
4. Project:
- A project typically has a defined start and end date, requires cross-functional collaboration, and may involve external stakeholders. It is generally larger in scope and demands more resources. Projects are designed to achieve broader objectives and often require coordination between multiple teams or departments.
5. Task:
- A task is generally smaller in scope, fits within specific time frames, and requires fewer resources than a project. It is usually simpler and more focused, often completed by an individual or a smaller group. Tasks are either part of a larger project or standalone, but they typically have a narrower focus and shorter duration.
Project Details Form

Figure 3.1.2 Project Details Form
6. Project Details Form:
- The Project Details Form allows you to add or edit a project. You’ll enter the Project Title and a brief Description. Then, select the Project Owner (who manages the project) and the Accountable person (who ensures the project’s success). You’ll set the Start Date and End Date, choose the Priority, and update the Status. You can also note the Complexity, provide an Estimated Cost, and set the project to Repeat Every if needed, with specific start and end dates.
Task Details Form

Figure 3.1.3 Task Details Form
7. Task Details Form:
- The Task Details Form is used to add or edit a task within a project. You’ll enter the Task Title and Description, assign an Assignee, and select the Accountable person. You’ll set the Start Date and End Date, choose the Priority, and update the Status. You can also note the Complexity, provide an Estimated Cost, and set the task to Repeat Every with start and end dates if applicable.

Figure 3.2 Workspace Timeline View
8. Task Filter (Dropdown):
- Located at the top of the dashboard, the Task Filter Dropdown enables users to filter the displayed tasks. You can select different criteria, such as viewing all tasks or narrowing the list down to specific project types or categories. This feature allows for a more focused view depending on your needs.
9. Timeline View (Tab Selection):
- The List View allows users to view all tasks in a tabular format. This view gives a quick overview of the task names, start and end dates, and allows users to track the progress of each task. The Timeline View is also available here, which presents tasks over time in a visual timeline format.
10. Task Timeline:
- The Task Timeline section is the visual representation of the tasks across a calendar view. Each task is represented as a horizontal bar that spans the days it is scheduled to be worked on. The timeline shows tasks like "Conduct a Stakeholder" and "Perform a Risk Assessment", which are color-coded blue across their respective dates.
- Task Duration: The tasks span from January 8th to January 30th, and the duration is visually represented as the length of the blue bars across the calendar.
- Assigned Team Members: Although not explicitly shown, team members can be implied by the tasks listed, with each task tracking its start and end dates to help visualize progress over time.
If you need further assistance, kindly contact our support at support@cytechint.com for prompt assistance and guidance.