CyTech AQUILA - Cyber Incident Management (CIM): Settings
This page allows users to configure and manage notification settings within the CIM (Cyber Intelligence Management) solution. The interface is organized into multiple sections for streamlined navigation and tailored notification management.
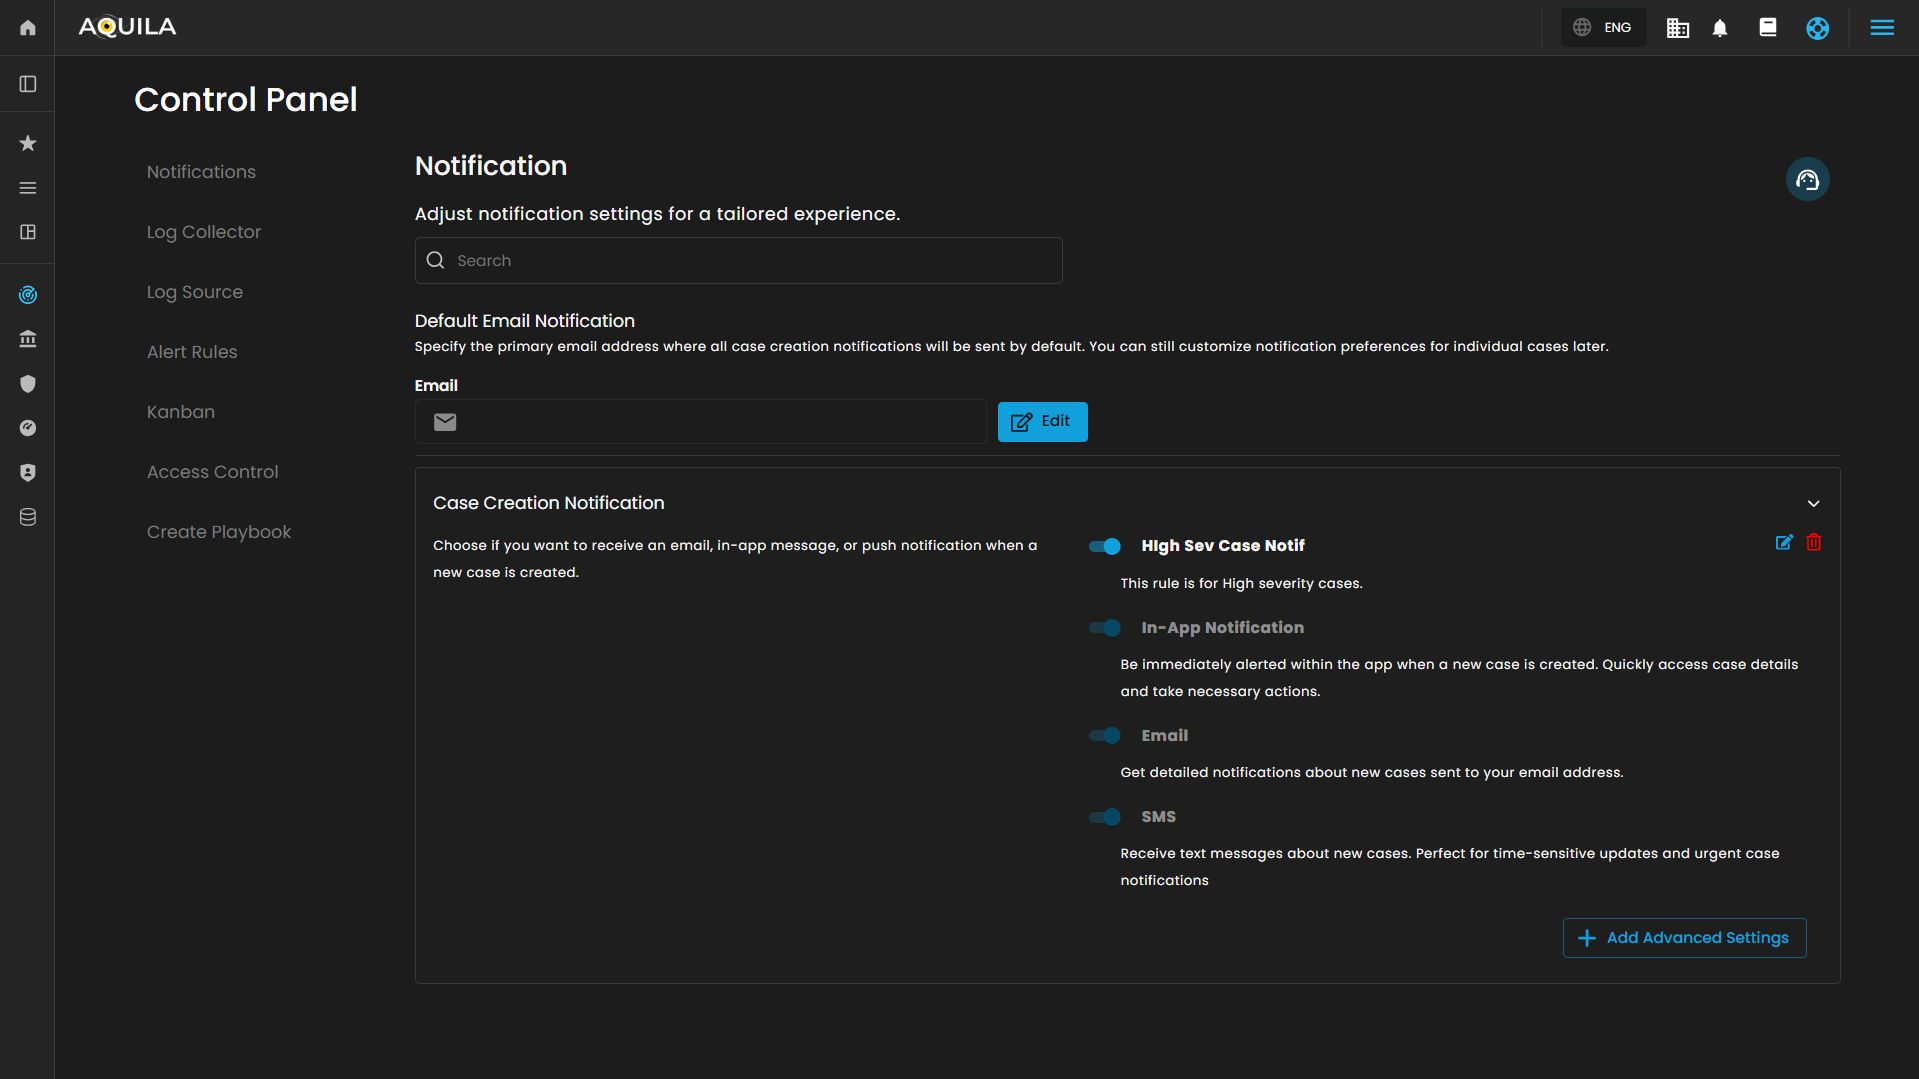
Notification
This main section allows for adjustment of general notification settings:
-
Search Bar: A search field to quickly locate specific notification settings or preferences.

- Default Email Notification
-
Description: Specifies the primary email address where all case creation notifications will be sent by default. This setting does not restrict customization for individual case notifications.

-
Email Input Field: Placeholder text "example@domain.com" indicates where the default email address is entered.

-
Edit Button: Allows editing and saving of the default email address for notifications.

-



Case Creation Notification
This sub-section outlines options for notifications when a new case is created:
-
Description: Users can choose notification channels for receiving alerts related to case creation.
- Notification Types:
-
In-App Notification: Alerts are immediately displayed within the application. Users can quickly access new case details and take required actions.

-
Email: Detailed notifications about newly created cases are sent to the designated email address.

-
SMS: Text message alerts are dispatched for new cases. This channel is recommended for time-sensitive and urgent updates.

-
-
Switches: Each notification method has a toggle switch for enabling or disabling the specific notification type.
-
Advanced Settings: A button labeled "Add Advanced Settings" provides access to Configure Rule pop up when clicked.



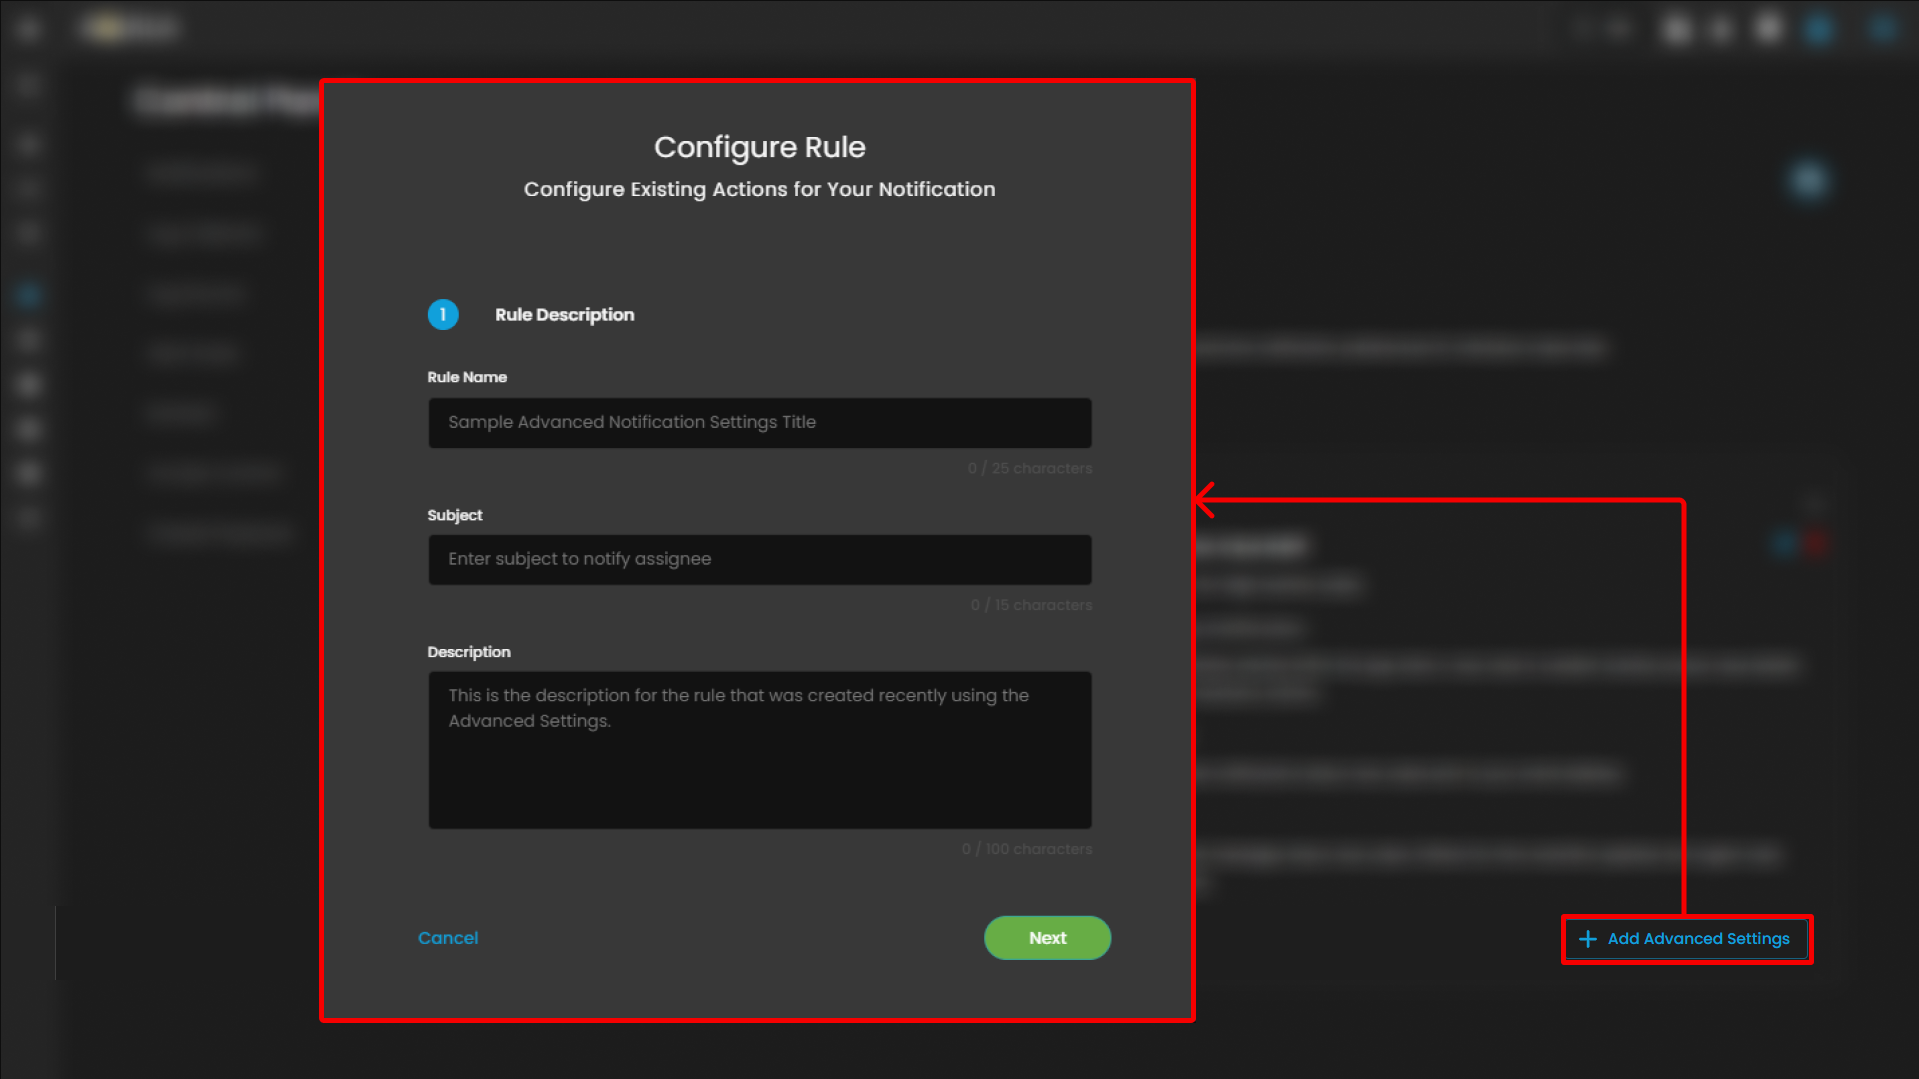
Notification Action Configuration
This page is used to configure the details for an existing action in a notification rule within the CIM (Cyber Intelligence Management) system. The user is guided through defining core attributes of the notification action, enabling efficient management and customization.
Rule Name
-
Purpose: Enter the specific name for the notification rule. Example given is "Sample Advanced Notification Settings Title".
-
Character Limit: Allows up to 25 characters, shown as a counter.
Subject
-
Purpose: Specify a concise subject line for the notification, intended to notify the assigned recipient.
-
Character Limit: 15 characters, displayed as a counter.
Description
-
Purpose: Provide a detailed description of the rule. This field is for explanatory text supporting clarity on the rule's intent and function.
-
Character Limit: 100 characters, indicated below the field.
Clicking Next will redirect you to the second page of the configuration.
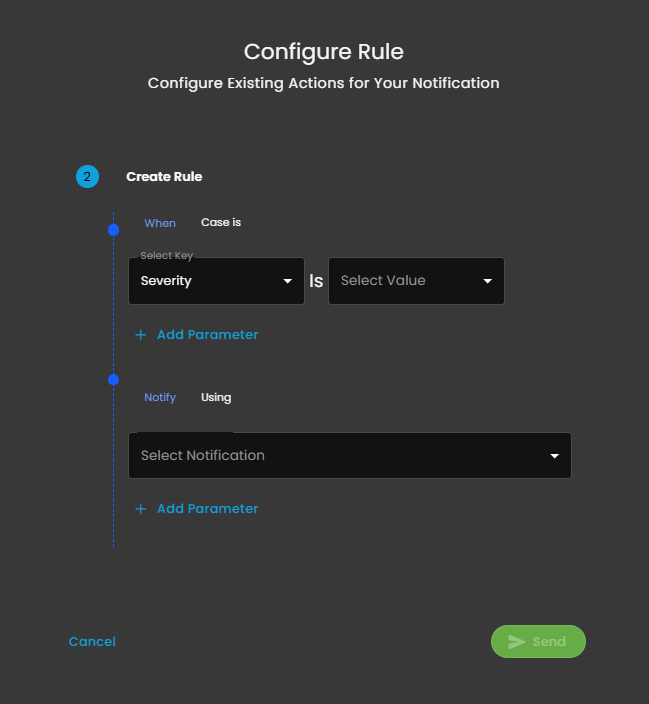
Notification Rule Creation
This interface is the second step in the process of configuring actions for a notification rule within the CIM platform. It enables administrators to define the specific conditions under which notifications should be sent, as well as the corresponding notification methods.
Rule Condition Configuration
- When Case is
-
Select Key: Dropdown to choose a case attribute to evaluate; shown as "Severity".
-
Is: Operator for comparison.
-
Select Value: Dropdown to specify the value for the selected key.
-
-
Add Parameter: Option to increase rule complexity by adding additional parameters for multi-conditional logic.
Notification Action Specification
- Notify Using
-
Select Notification: Dropdown list for choosing the desired notification channel (e.g., email, in-app, SMS).
-
-
Add Parameter: Option to customize or refine notification actions with additional parameters.
Support Section
-
Purpose: Provides users with quick access to support resources, assistance, or help documentation related to the Cyber Intelligence Management (CIM) system.
-
Functionality: Typically, clicking this icon would open a support menu, chat widget, or redirect to a help center where users can submit support tickets, search FAQs, or get live assistance.
-
Accessibility: Its prominent placement ensures immediate visibility for users needing assistance without navigating away from the current workspace or settings page.
Log Collector List
The Log Collector List interface provides administrators with a centralized view for managing and monitoring log collectors. This section is part of the Settings for CIM (Cyber Incident Management) module and enables easy configuration, visibility, and operational control of log collectors.
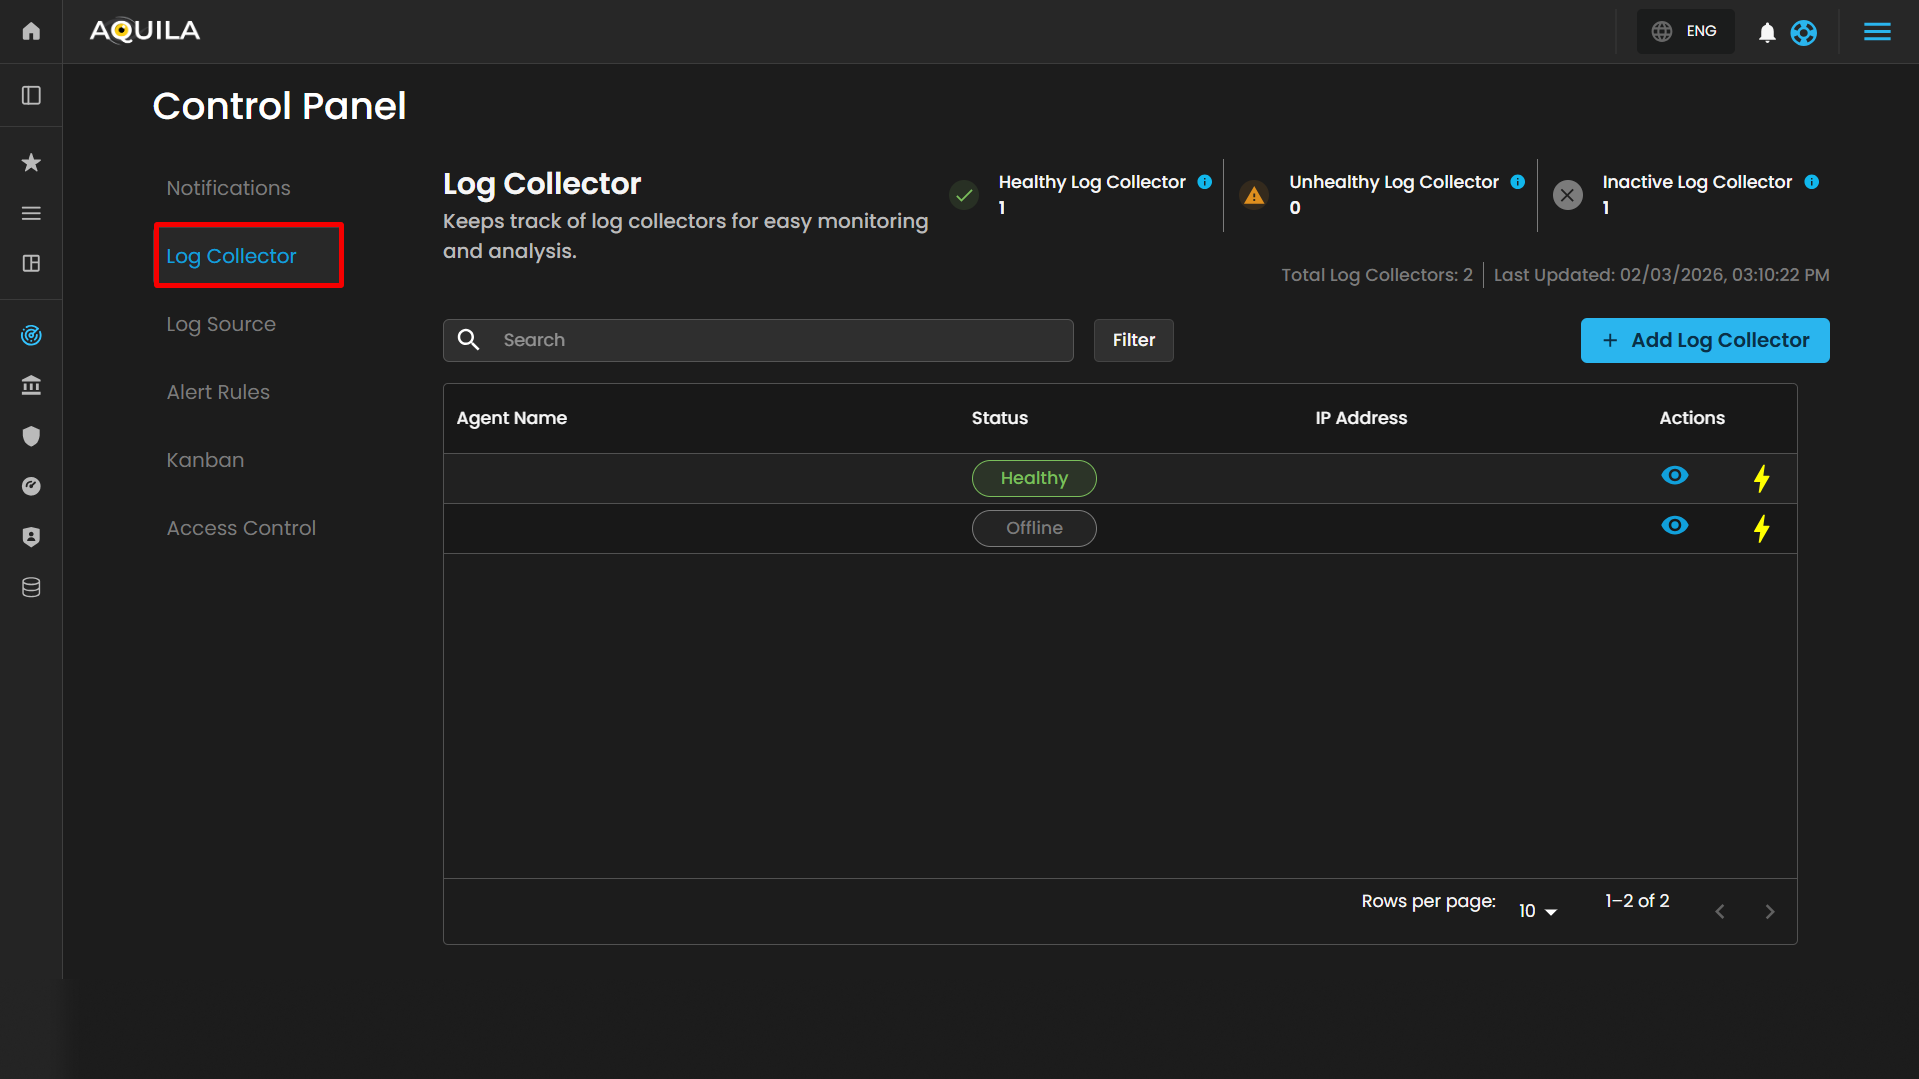
Action Controls
- Add Log Collector (button): Located on the upper-right corner. This allows administrators to register a new log collector agent into the system.

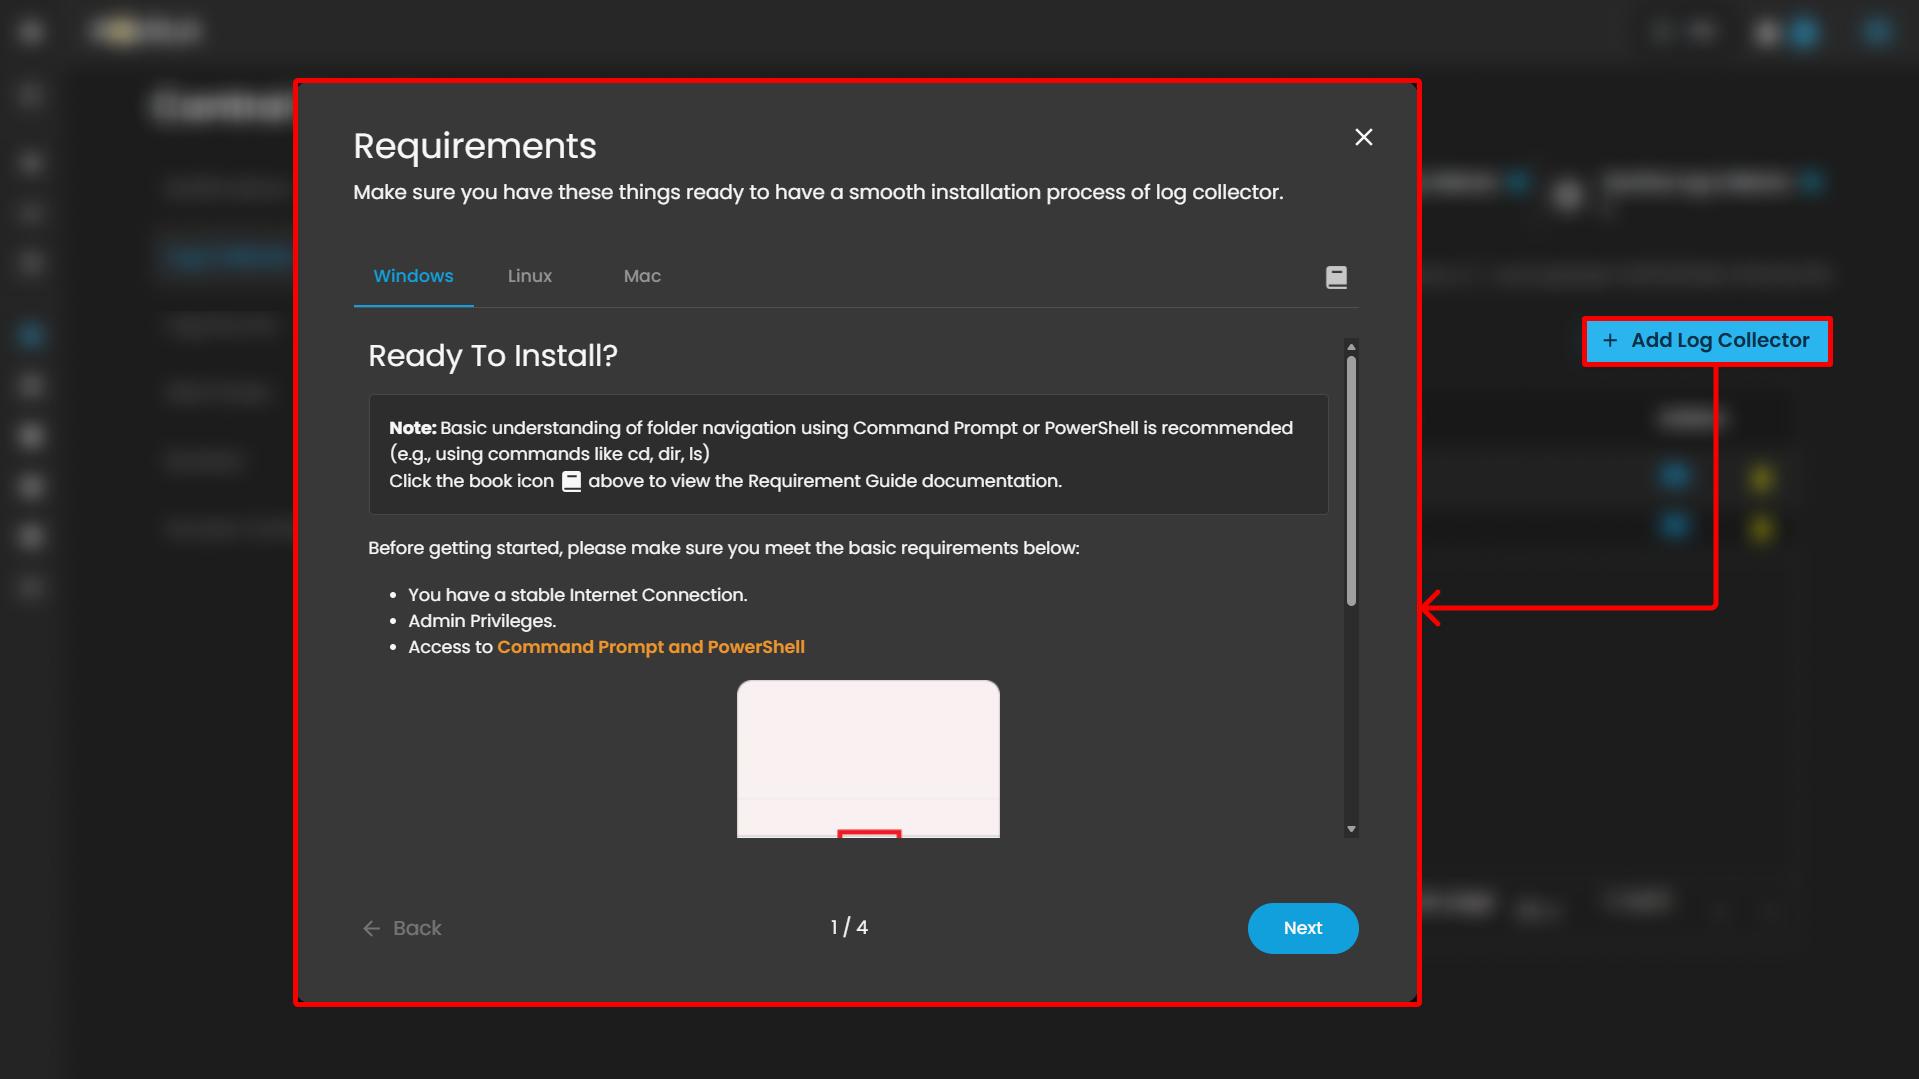
To learn more about "Add Log Collector" please refer to this link.
Windows Log Collector Installation: Log Collector Installa... | AQUILA Documentations
Linux Log Collector Installation: Log Collector Installa... | AQUILA Documentations
Mac Log Collector Installation: Log Collector Installa... | AQUILA Documentations
Log Collector Table
The main section of the page displays a table of log collectors, providing key operational details:
| Column | Description |
| Agent Name |
Displays the name of the log collector agent. Clickable for detailed view. Example: HYDRA-DC. |
| Status | Indicates whether the log collector is currently online or offline. Example: Offline. |
| IP Address |
Shows the network address assigned to the log collector. |
- View Icon: Located on the left side of each row, enabling quick inspection of collector details. When clicking it redirects you to the page where all the log sources was integrated on the specific log collector.

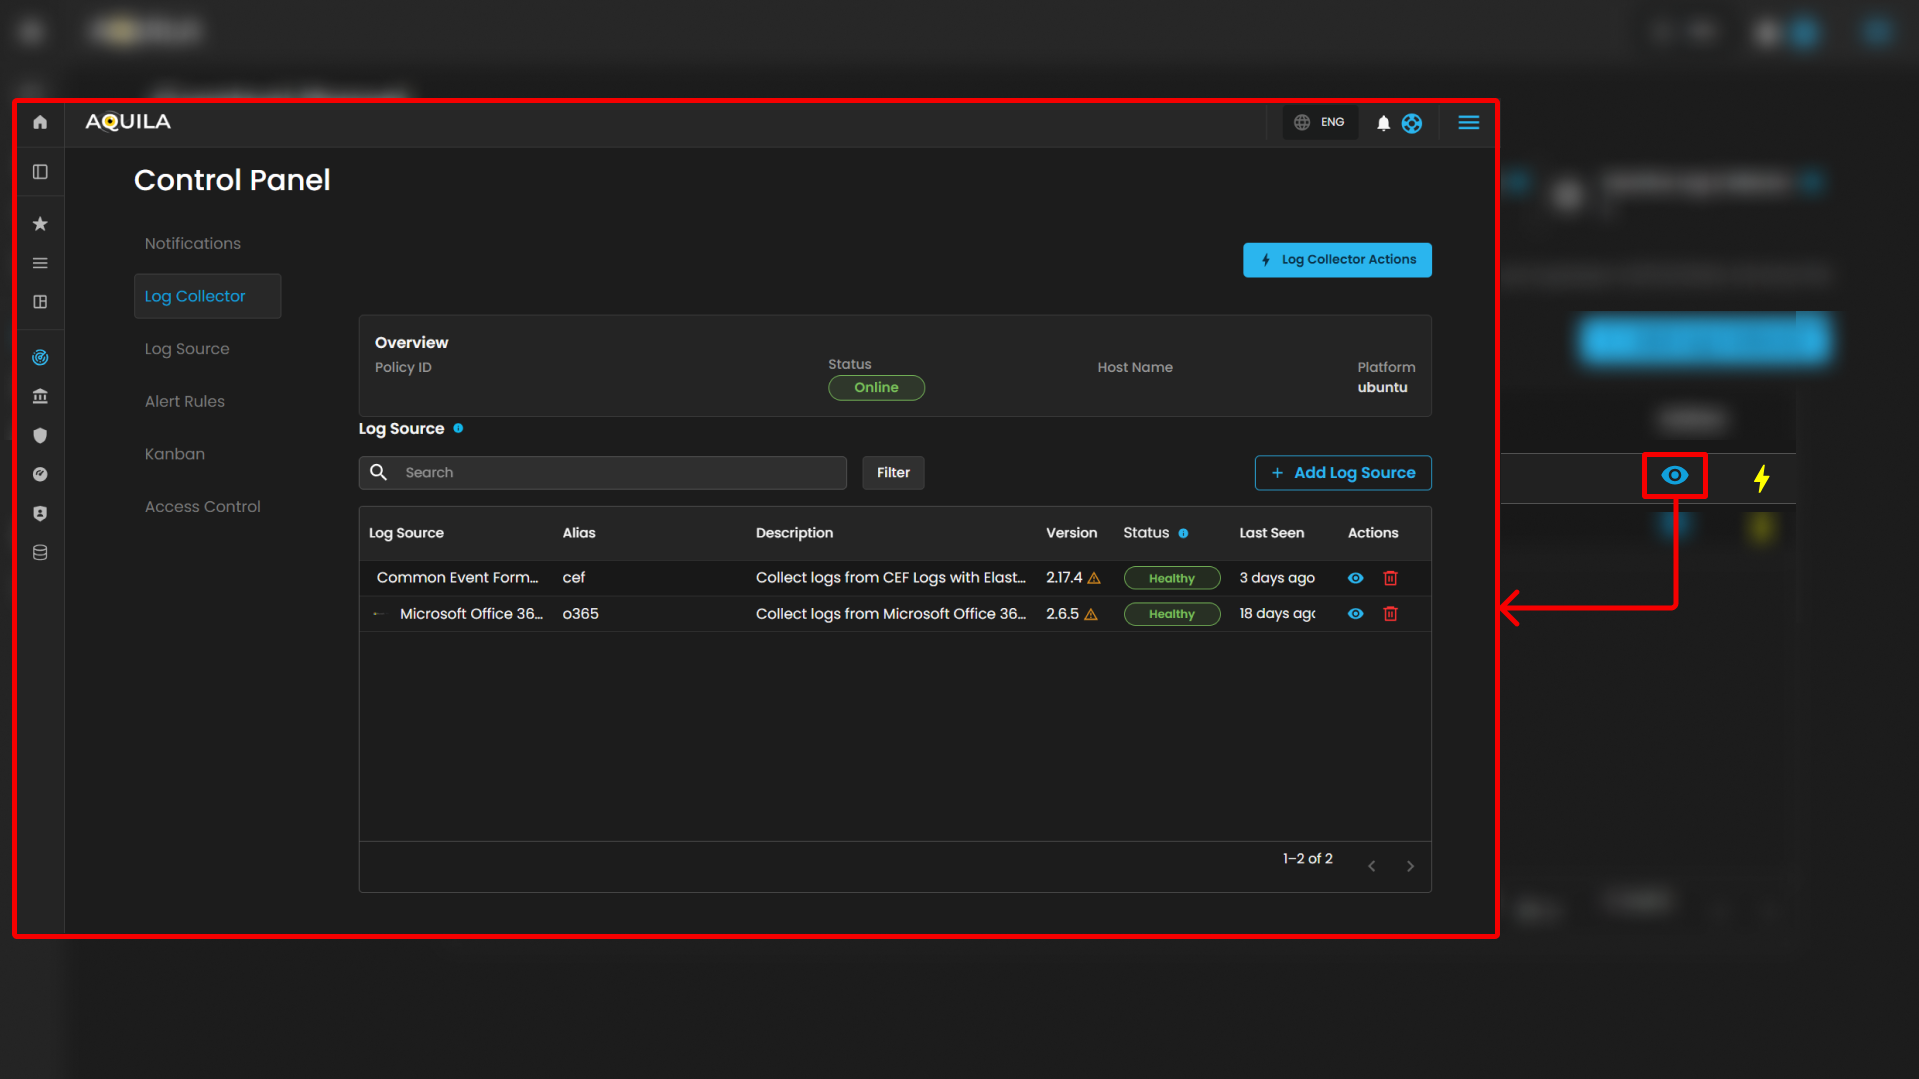
When pressing the "eye icon" in the Log Source, it will show a side bar where it will give more information
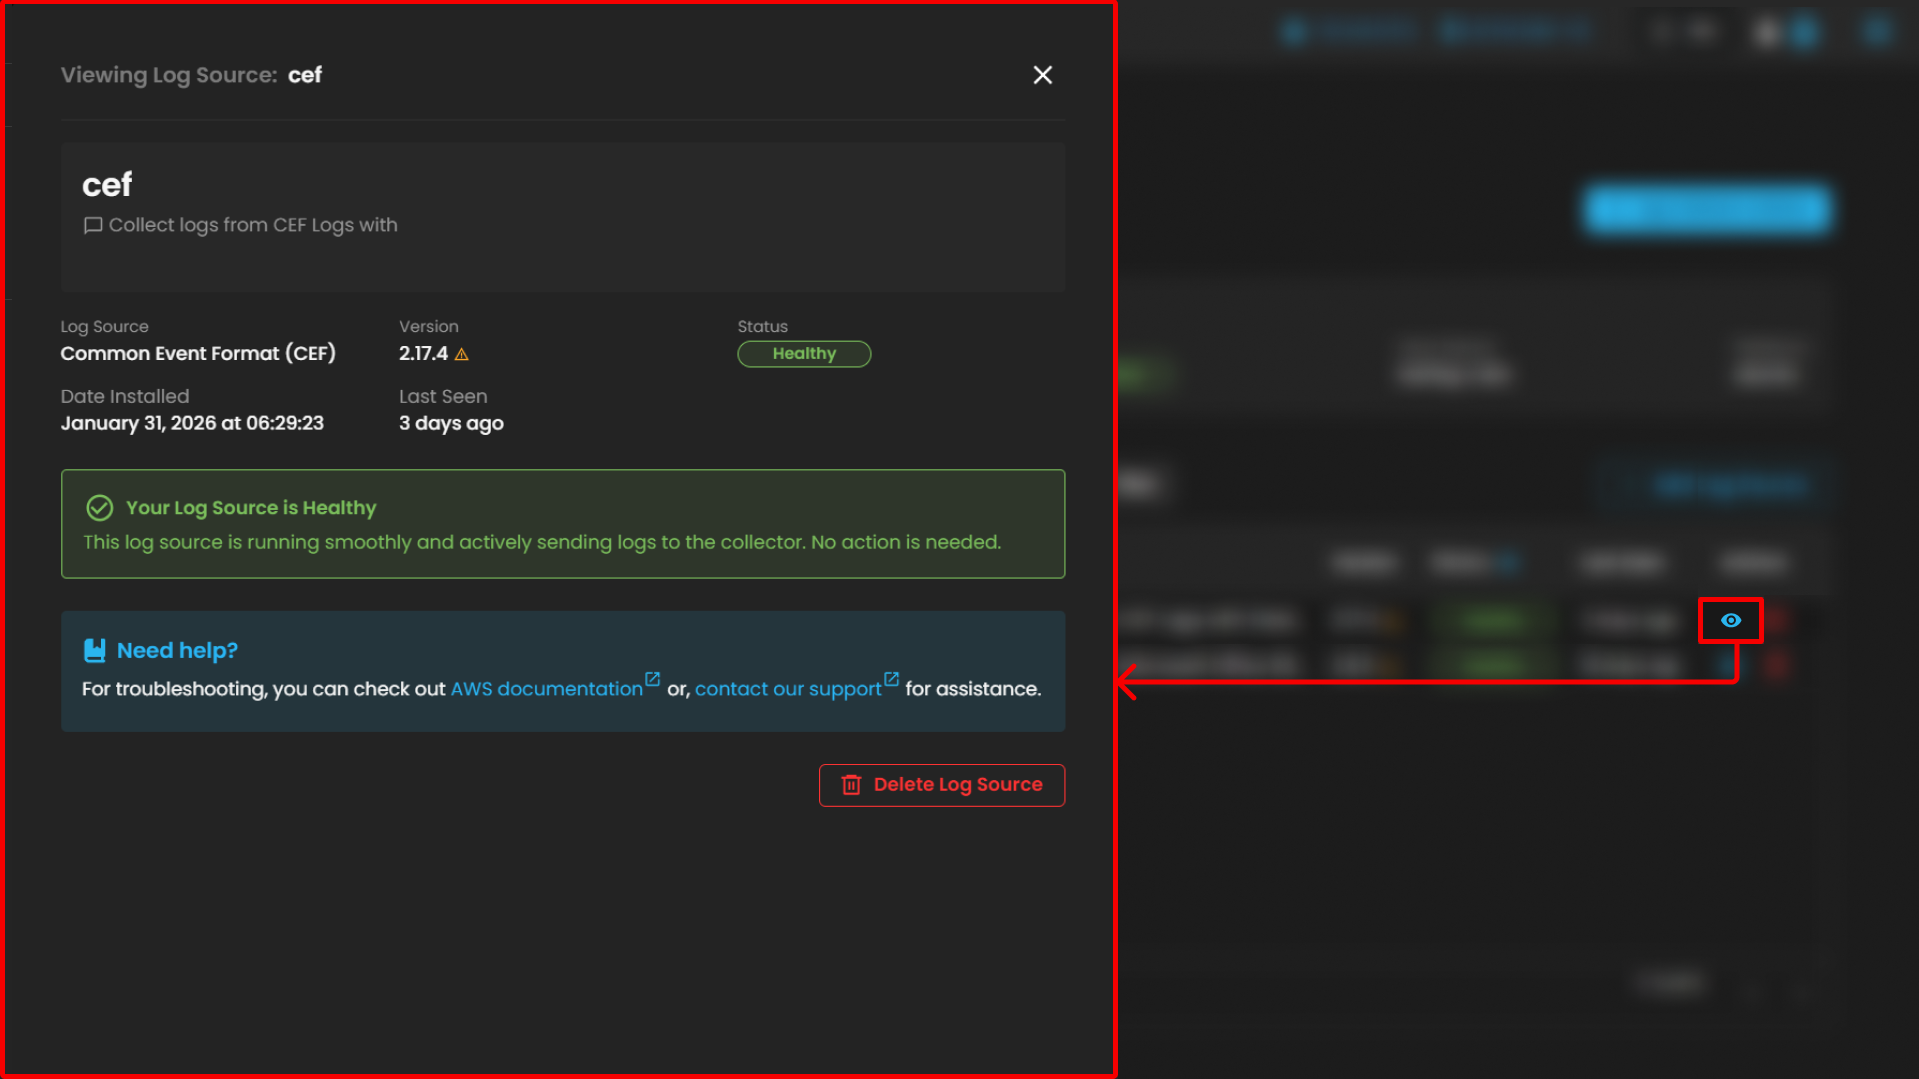
Please refer to this document for troubleshooting: "AWS Integrations | AQUILA Documentations"
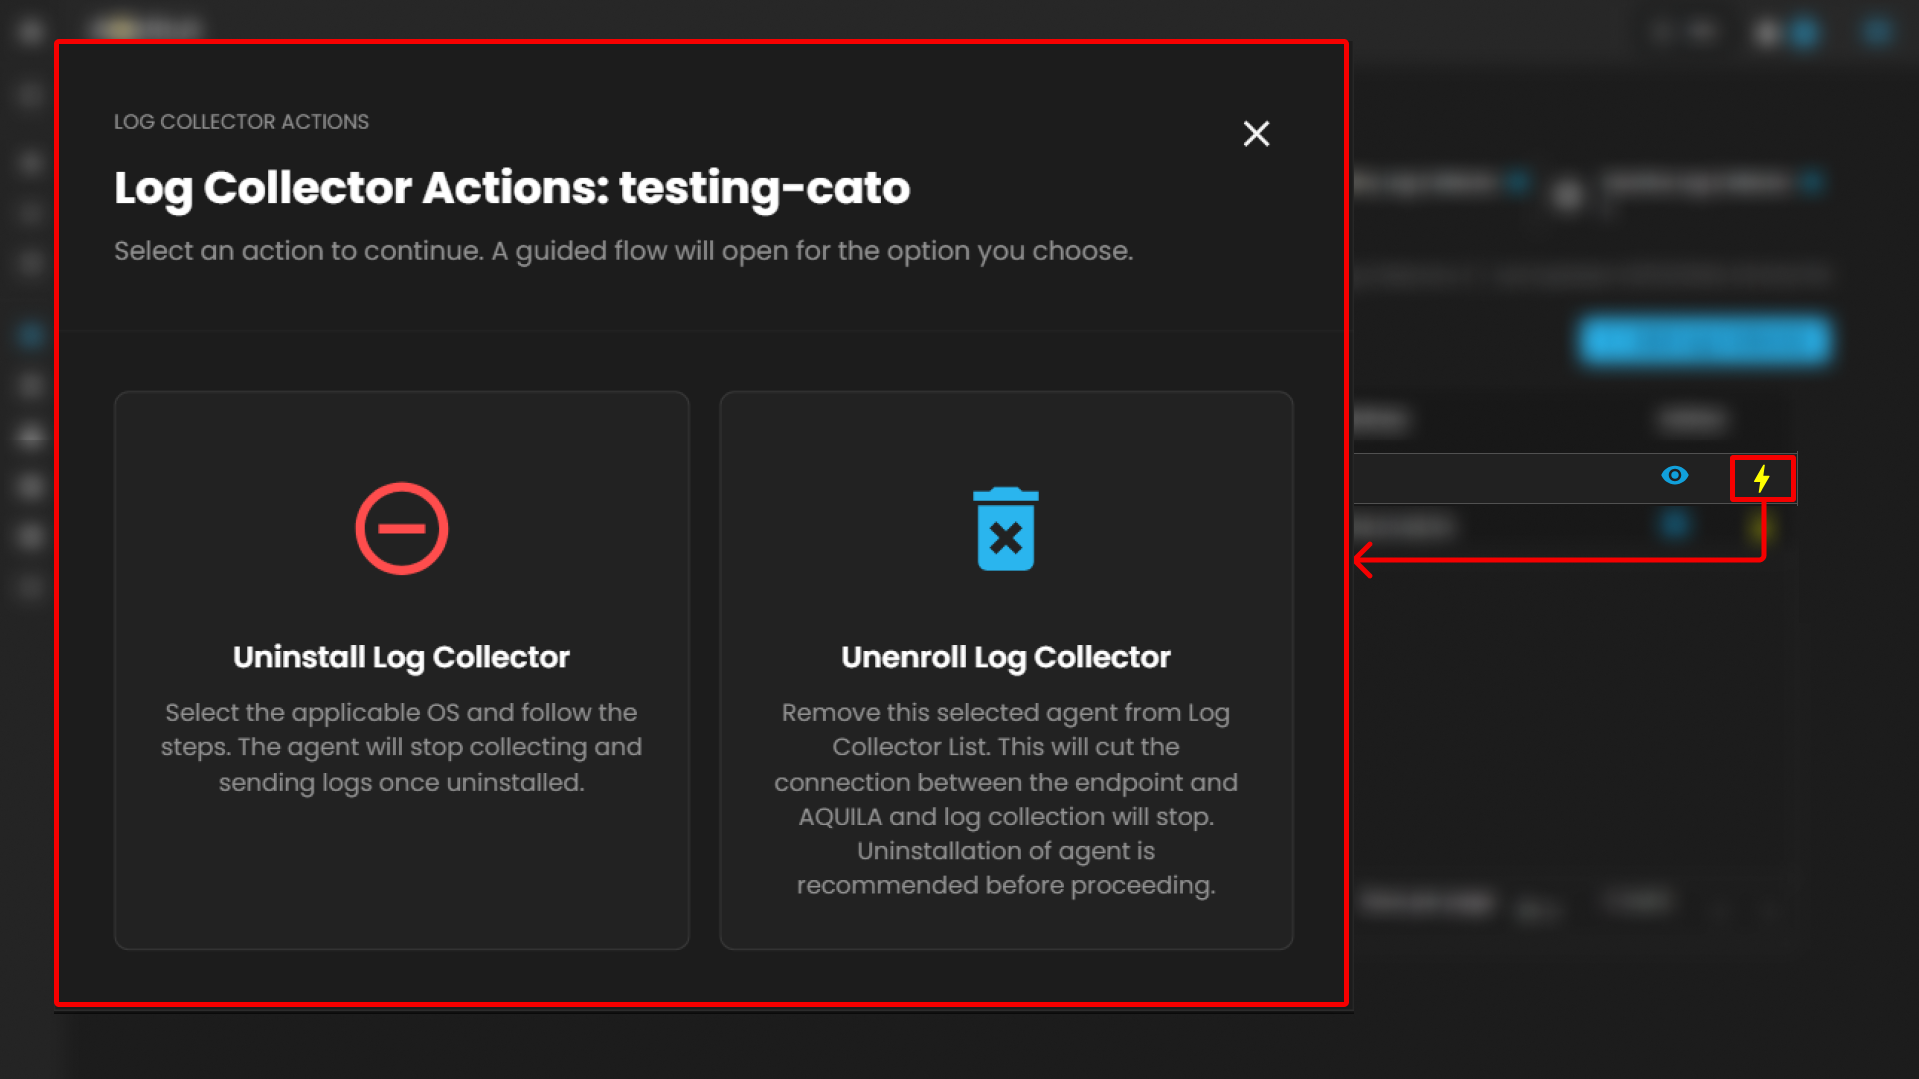
Users can also uninstall their Log Collector or Unenroll it by pressing the "⚡" symbol.
Overview Panel
Located on the left side, the Overview section provides basic collector details:
-
Policy ID – Displays the unique policy identifier assigned to the log collector.
-
Status – Shows whether the collector is online or offline (e.g., Offline).
-
Host Name – Displays the assigned host identifier or network name.
-
Platform – Indicates the operating system platform on which the collector is installed (e.g., Windows).
Additional note: A usage indicator is displayed below, showing the number of log sources currently added relative to the maximum available. Example: 2 out of 254 Log Sources added. A link is provided (Add Log Sources) for extending the configuration.
Integrations Panel
The Integrations section lists available integrations assigned to the collector. Each integration includes details and health indicators.
Support Section
-
Purpose: Provides users with quick access to support resources, assistance, or help documentation related to the Cyber Intelligence Management (CIM) system.
-
Functionality: Typically, clicking this icon would open a support menu, chat widget, or redirect to a help center where users can submit support tickets, search FAQs, or get live assistance.
-
Accessibility: Its prominent placement ensures immediate visibility for users needing assistance without navigating away from the current workspace or settings page.
Log Source
The Log Source section within Settings for CIM provides administrators with a centralized interface for managing available log source integrations. This module enables users to search, review, and add integrations to a Log Agent for log collection and monitoring.
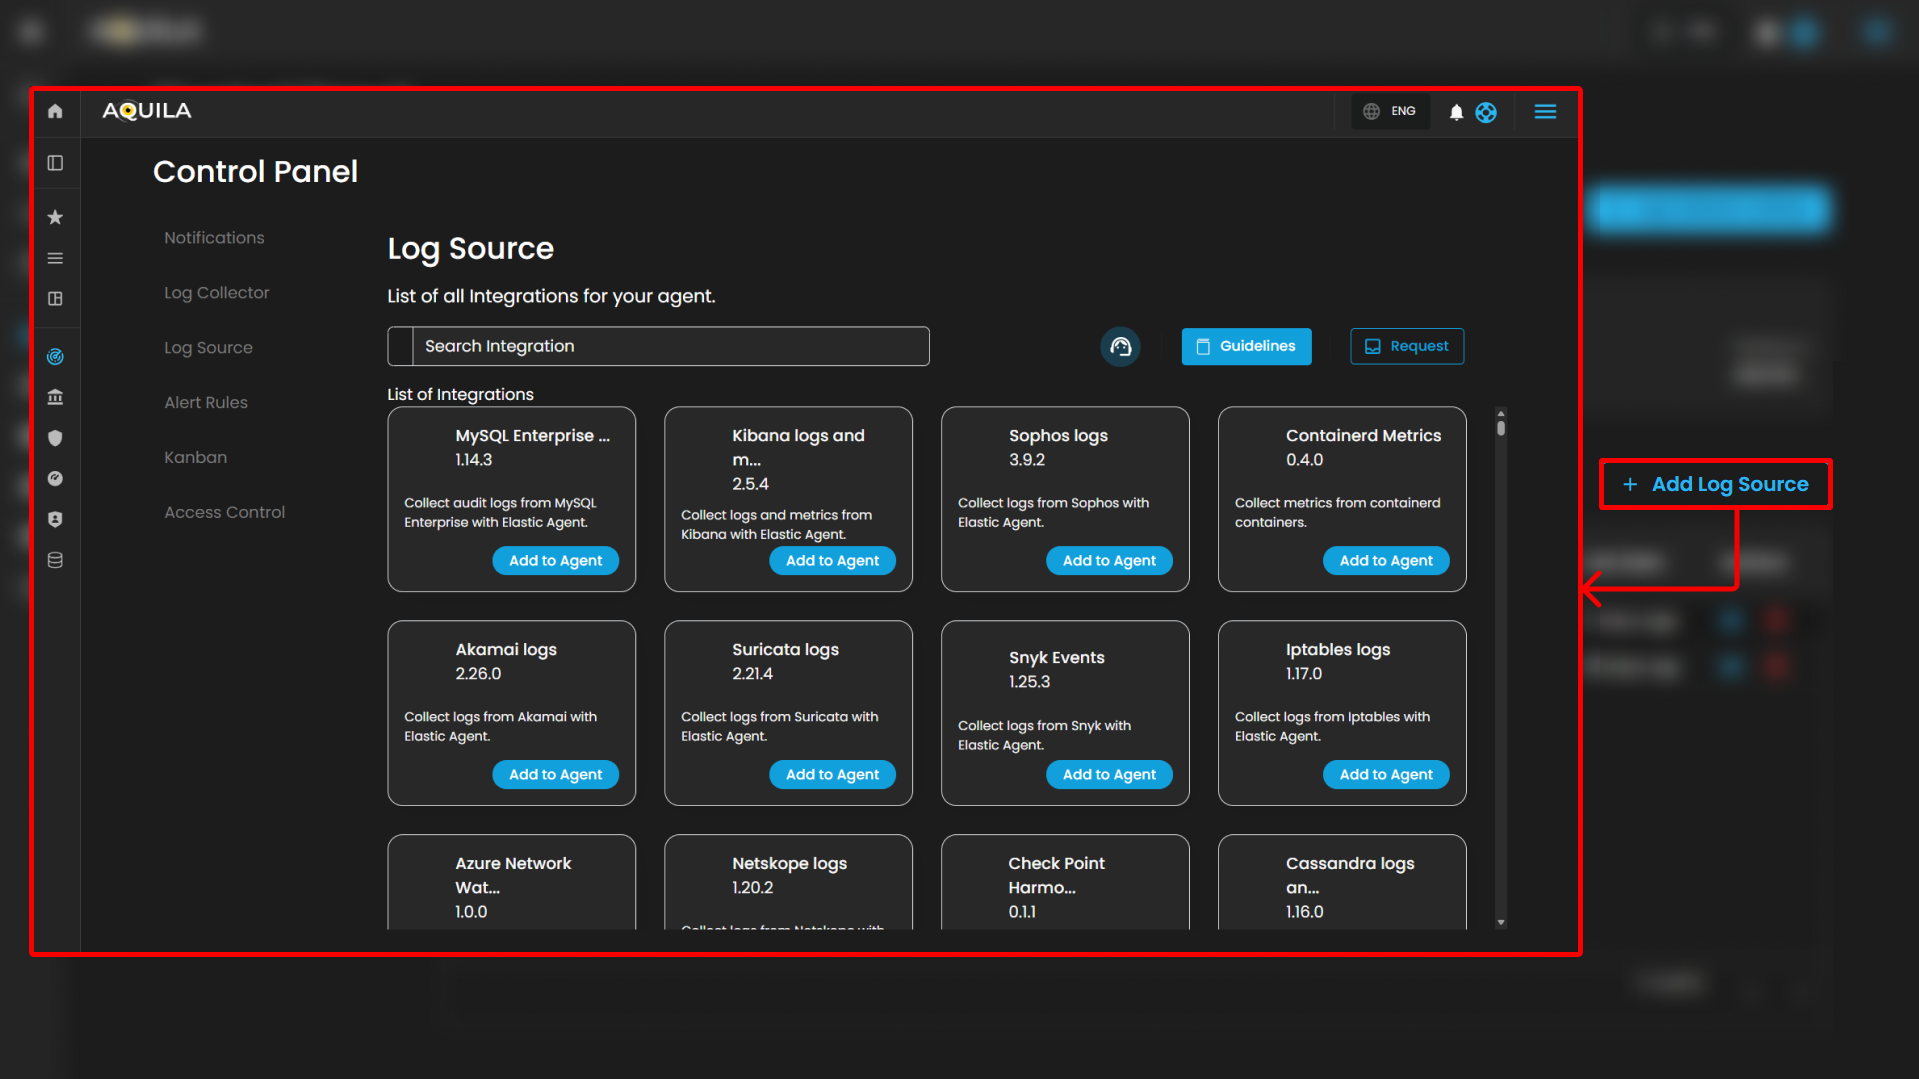
Search and Action Controls
-
Search Integration
-
Enables keyword searches to quickly locate a specific integration by name or capability.

-
-
Guidelines
-
Opens the integration setup documentation and best-practice guidance for configuring integrations with the Log Agent. Use this to review prerequisites, configuration steps, and recommended settings prior to adding an integration.

-


-
Request
-
Opens a request form or submission workflow to request support for a new integration, report missing functionality, or ask for assistance with an existing integration. This provides a mechanism for users to request extension of available integrations or additional support resources.

-
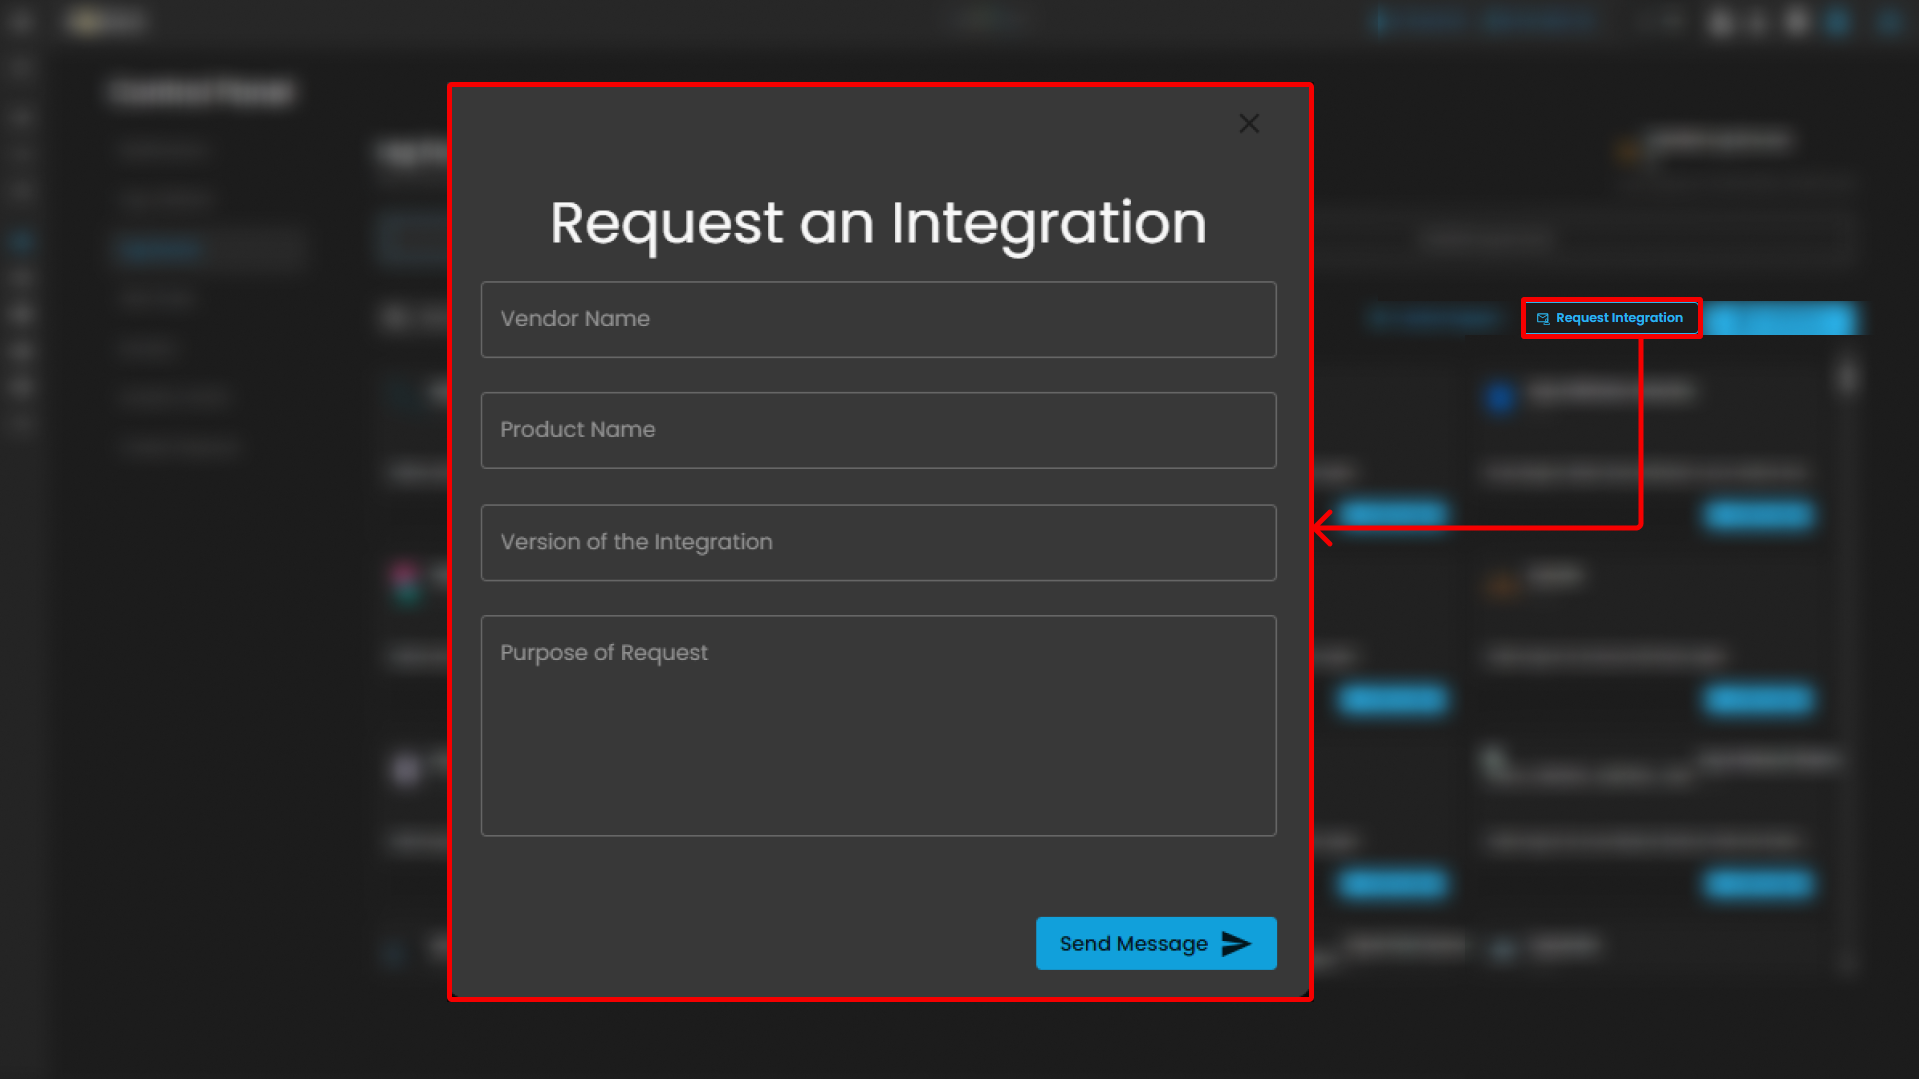
Note: The Guidelines and Request controls are located at the top-right of the page for convenient access while browsing integrations.
List of Integrations
This section displays all available integrations supported by the CIM platform. Each integration card includes:
-
Integration Name & Version – Specifies the log source and its current integration version.
-
Description – Briefly describes the purpose and type of logs collected.
-
Action Button (Add to Agent) – Assigns the integration to a Log Agent for log collection.
Support Section
-
Purpose: Provides users with quick access to support resources, assistance, or help documentation related to the Cyber Intelligence Management (CIM) system.
-
Functionality: Typically, clicking this icon would open a support menu, chat widget, or redirect to a help center where users can submit support tickets, search FAQs, or get live assistance.
-
Accessibility: Its prominent placement ensures immediate visibility for users needing assistance without navigating away from the current workspace or settings page.
Alert Rules
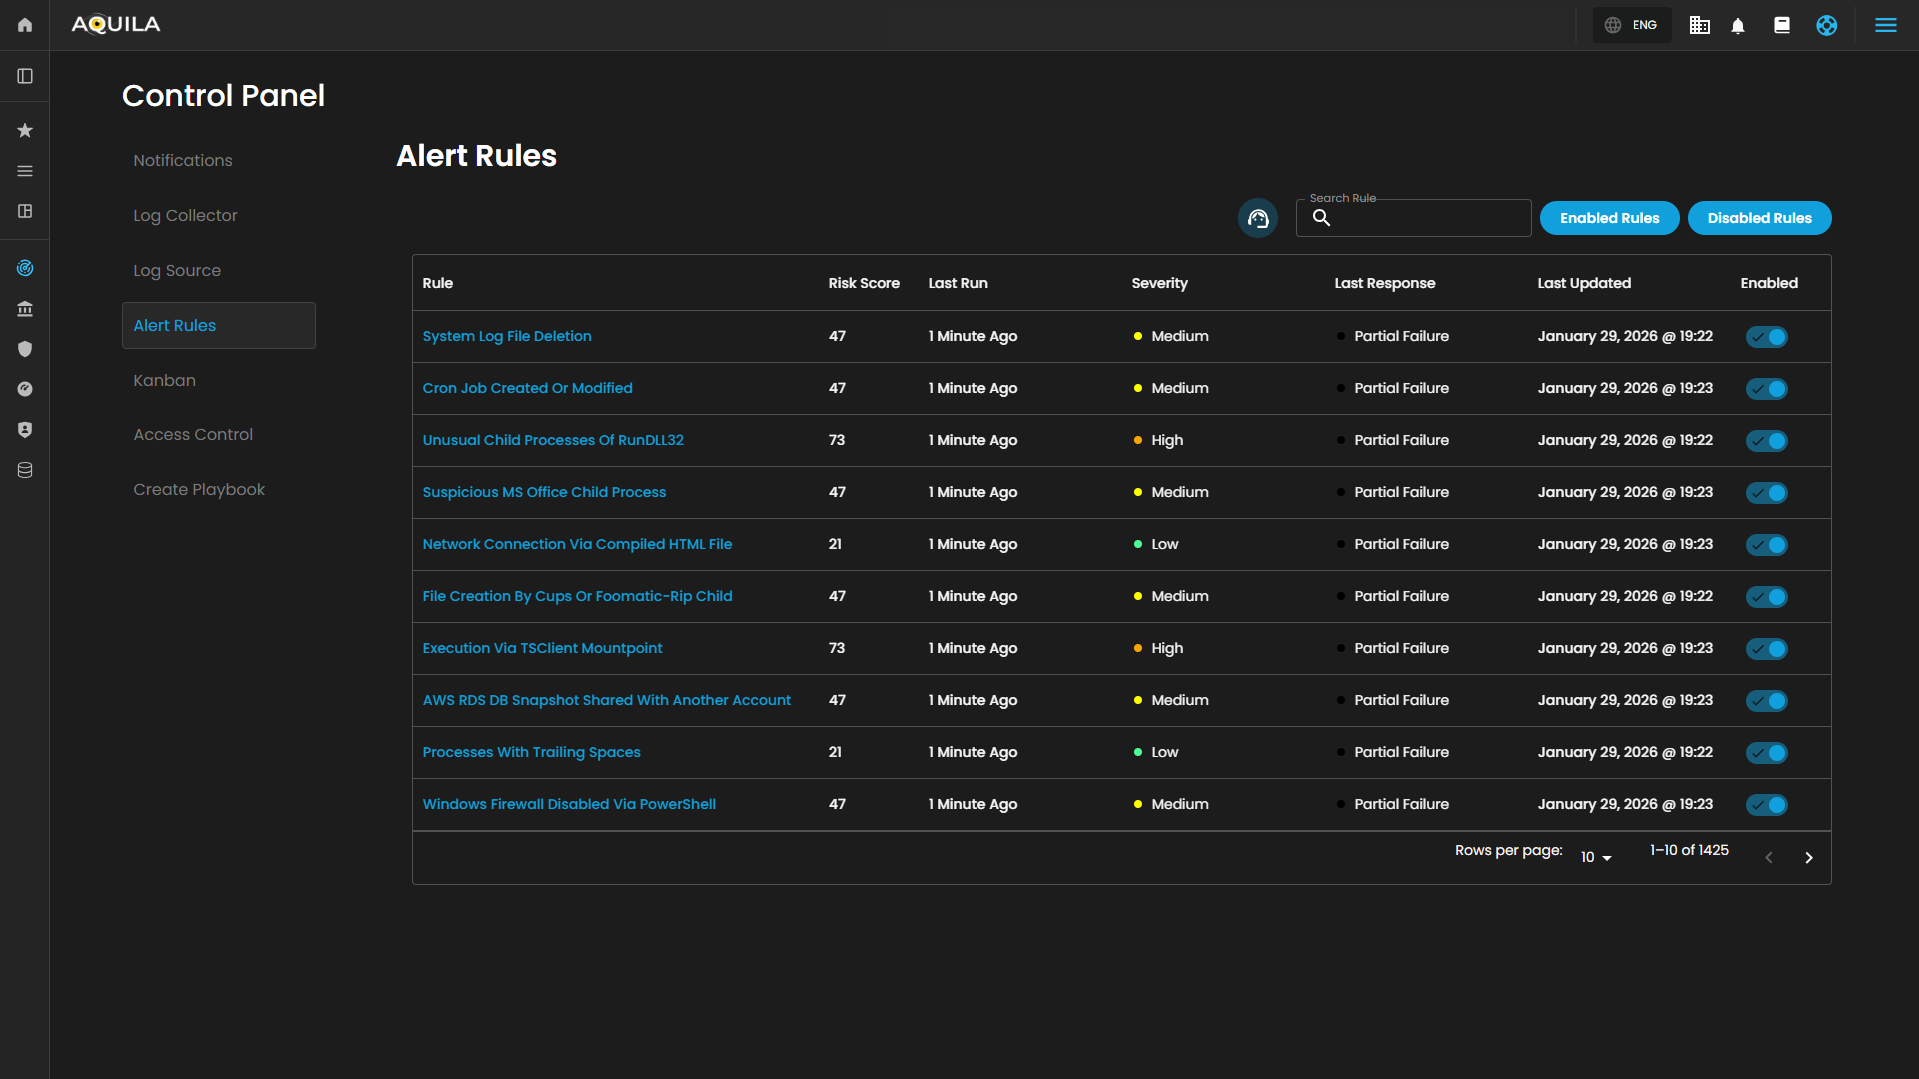
This section of the Security Operations Center (SOC) dashboard presents a summary of active alert rules, providing security personnel with a high-level overview of automated detection mechanisms, their recent execution status, and configured severity levels.
nteractive Controls
The dashboard is equipped with several interactive elements for filtering and searching the alert rules:
-
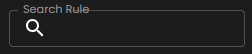
Search Bar: A free-text input field located above the table, allowing operators to quickly find specific rules by name, keyword, or other identifiable attributes.

-
Filter Buttons: A set of toggle buttons, typically found near the search bar, for dynamically filtering the rule set based on their operational state:

-
Enabled Rules: When selected, displays only the alert rules that are currently active (indicated by a ✅ in the
Enabledcolumn). -
Disabled Rules: When selected, would display rules that have been turned off.
-

Summary Table
The core of the dashboard is a tabular interface that lists configured alert rules with the following key metadata:
| Column | Description |
|---|---|
| Rule | The descriptive name of the automated security detection rule. Names often indicate the specific technique or threat being monitored. |
| Risk Score | A numerical value (e.g., 73, 47, 21) associated with each rule, likely representing a relative weight or priority used for overall risk calculation and alert triage. |
| Last Run | A timestamp indicating how long ago each rule was last executed. All displayed rules have run within the last 10 minutes, indicating frequent, near-real-time monitoring. |
| Severity | The assigned impact level of the alert. The dashboard uses a three-tiered classification: High, Medium, and Low. |
| Last Response | The operational status of the rule's most recent execution. The possible states are: • Succeeded: The rule executed without errors. • Partial Failure: The rule executed but encountered issues with a subset of its tasks or data sources. • Failed: The rule execution was unsuccessful. |
| Last Updated | The date the rule's logic or configuration was last modified. |
| Enabled | A status indicator (✅) confirming that the rule is currently active and monitoring for the specified conditions. It will be grayed out and no check mark if disabled. |
Support Section
-
Purpose: Provides users with quick access to support resources, assistance, or help documentation related to the Cyber Intelligence Management (CIM) system.
-
Functionality: Typically, clicking this icon would open a support menu, chat widget, or redirect to a help center where users can submit support tickets, search FAQs, or get live assistance.
-
Accessibility: Its prominent placement ensures immediate visibility for users needing assistance without navigating away from the current workspace or settings page.
These functions collectively enable a dynamic, visual approach to task management, allowing teams to adapt the board to their specific workflows while maintaining oversight of task distribution and progress.
Kanban Settings
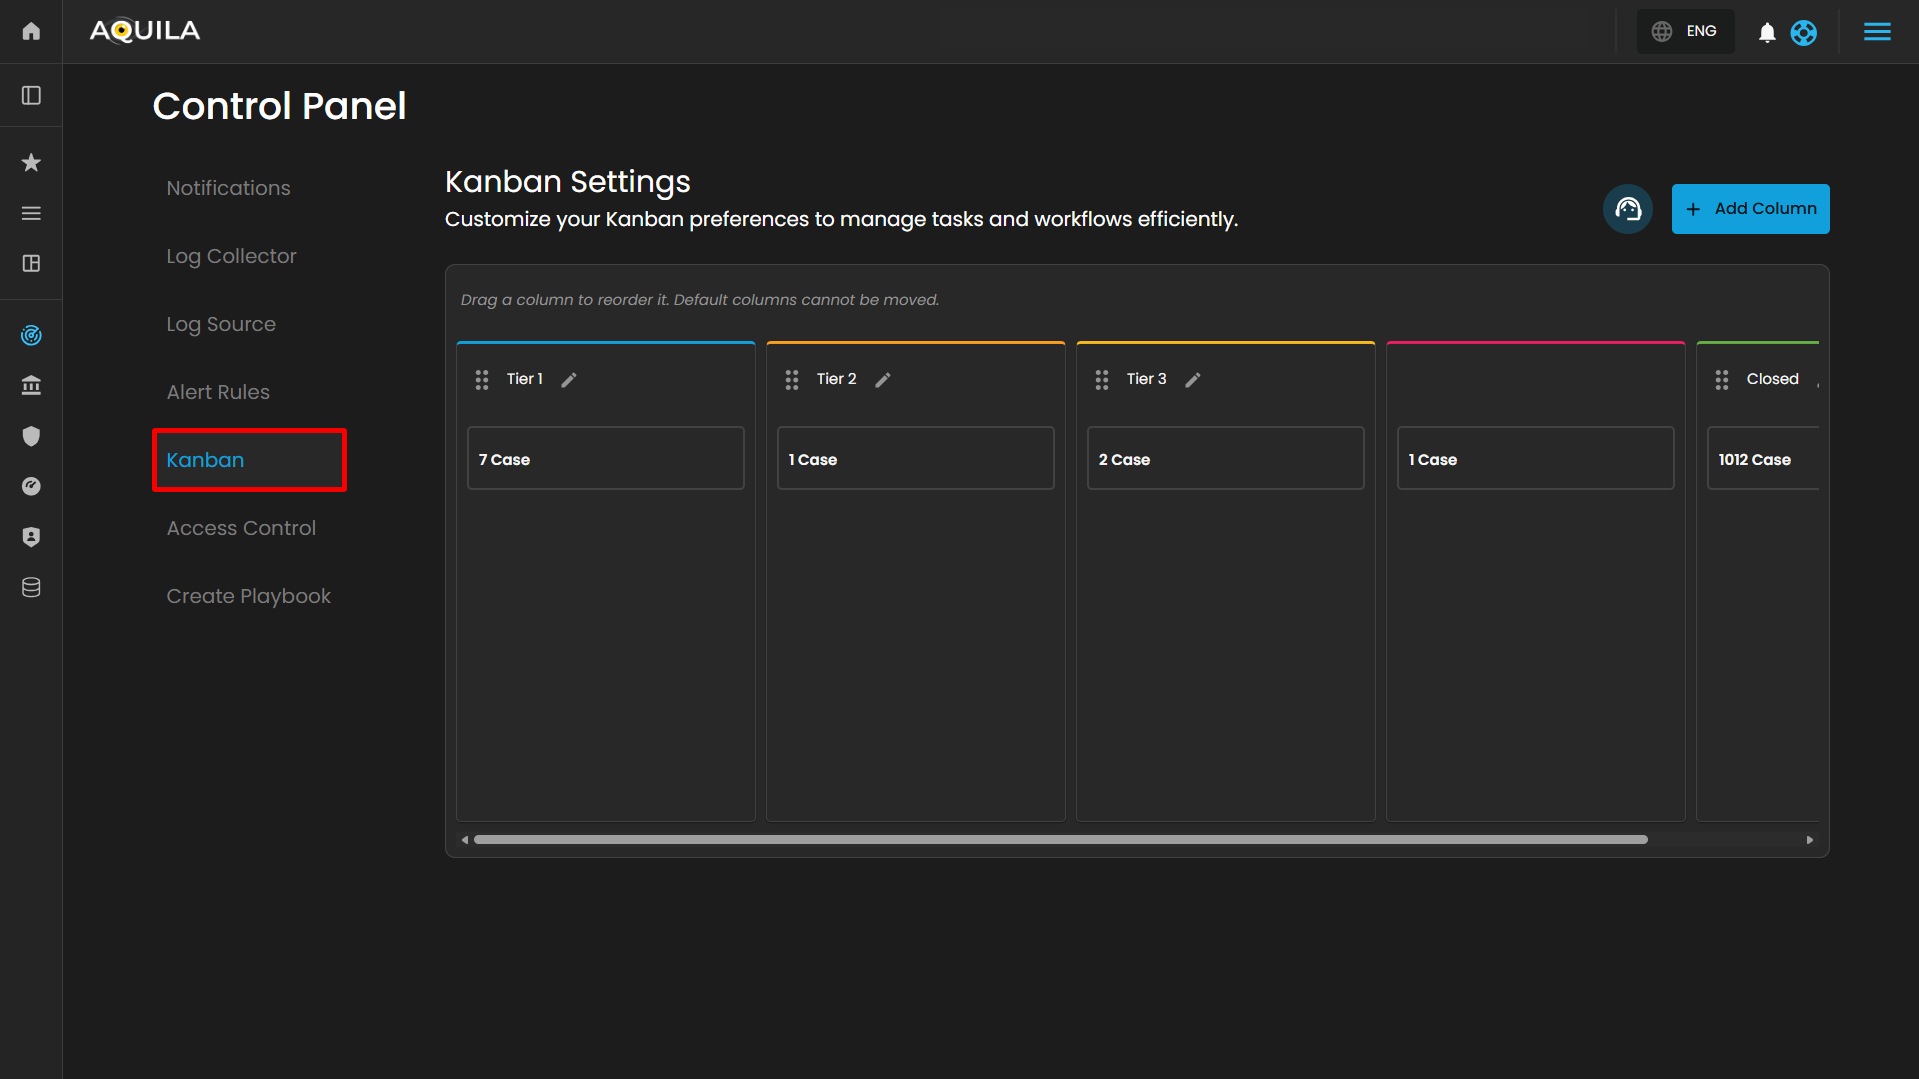
The Kanban Settings page provides a user interface for configuring and managing a Kanban board, which is a visual tool for tracking cases across various stages. The Kanban Settings page facilitates the configuration and management of this board, enabling users to customize its structure to suit specific needs, such as those in cybersecurity or technical support.
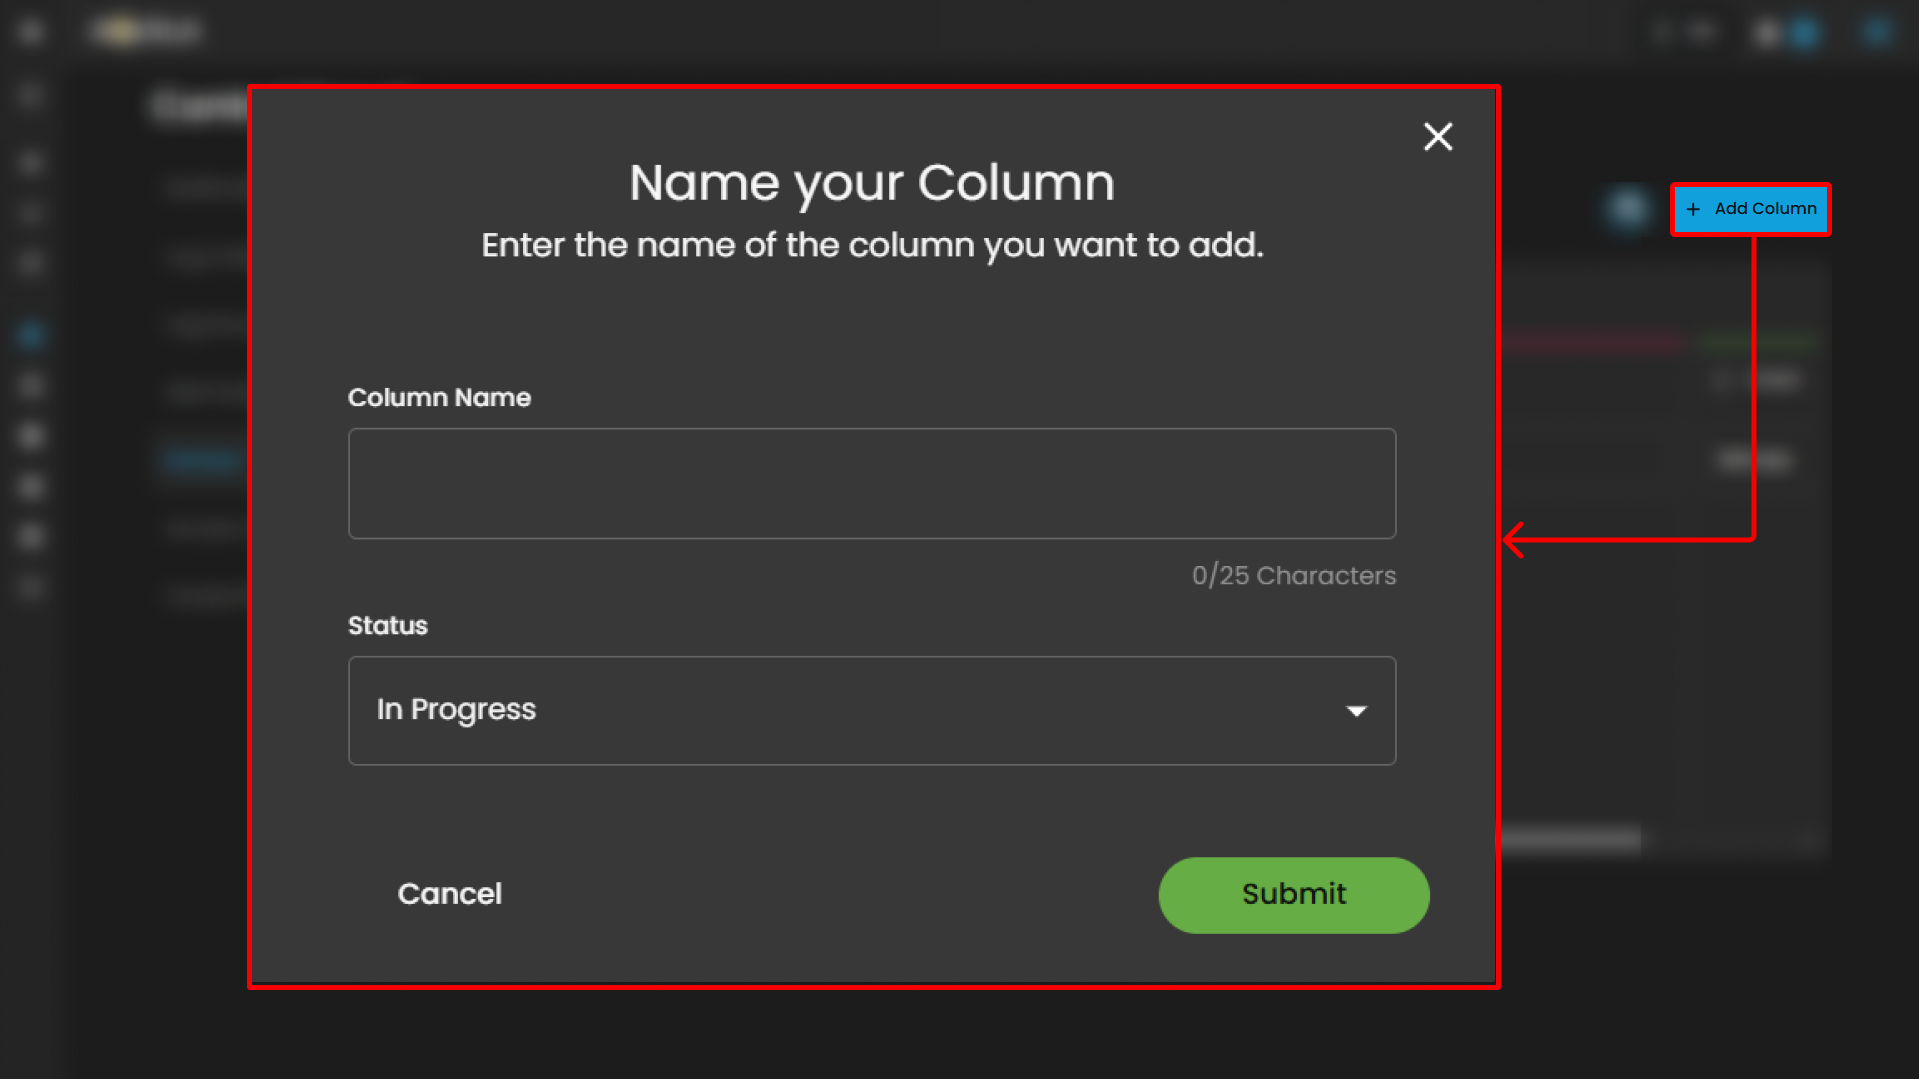
Users can also add new column by pressing the "Add Column" button.
-
Column Configuration:
-
Purpose: Allows users to define and label columns to represent workflow stages.
-
Function: Users can add new columns via the "+ Add Column" button to expand the board with additional stages. This enables tailoring the board to specific processes or team structures.
-
Customization: Columns can be edited (via the pencil icon ✏️) to rename or adjust their purpose, accommodating evolving workflow requirements.
-
-
Task Tracking:
-
Purpose: Displays the number of cases or tasks in each column.
-
Function: Provides a real-time overview of workload distribution across stages, helping teams monitor progress and identify bottlenecks.
-
- Column Reordering:
- Purpose: Facilitates adjustment of the workflow sequence.
- Function: Users can drag and drop columns (using the three-dot handle) to reorder them, optimizing the flow of tasks. Default columns remain fixed, ensuring critical stages (e.g., "Closed") stay in place, while custom columns can be rearranged for flexibility.
- Workflow Management:
- Purpose: Visualizes the progression of tasks from initiation to completion.
- Function: Columns like "Tier 1" and "Tier 2 & 3" suggest a tiered support or escalation process, while "Pending" and "Closed" indicate stages for review and resolution. This structure helps teams manage tasks efficiently across the lifecycle.
- Support Section:
- Purpose: Offers support for clients.
-
Location: To the right of the subtitle, in a subtle gray-blue color.
- Function: Typically, clicking this icon would open a support menu, chat widget, or redirect to a help center where users can submit support tickets, search FAQs, or get live assistance.
Access Control
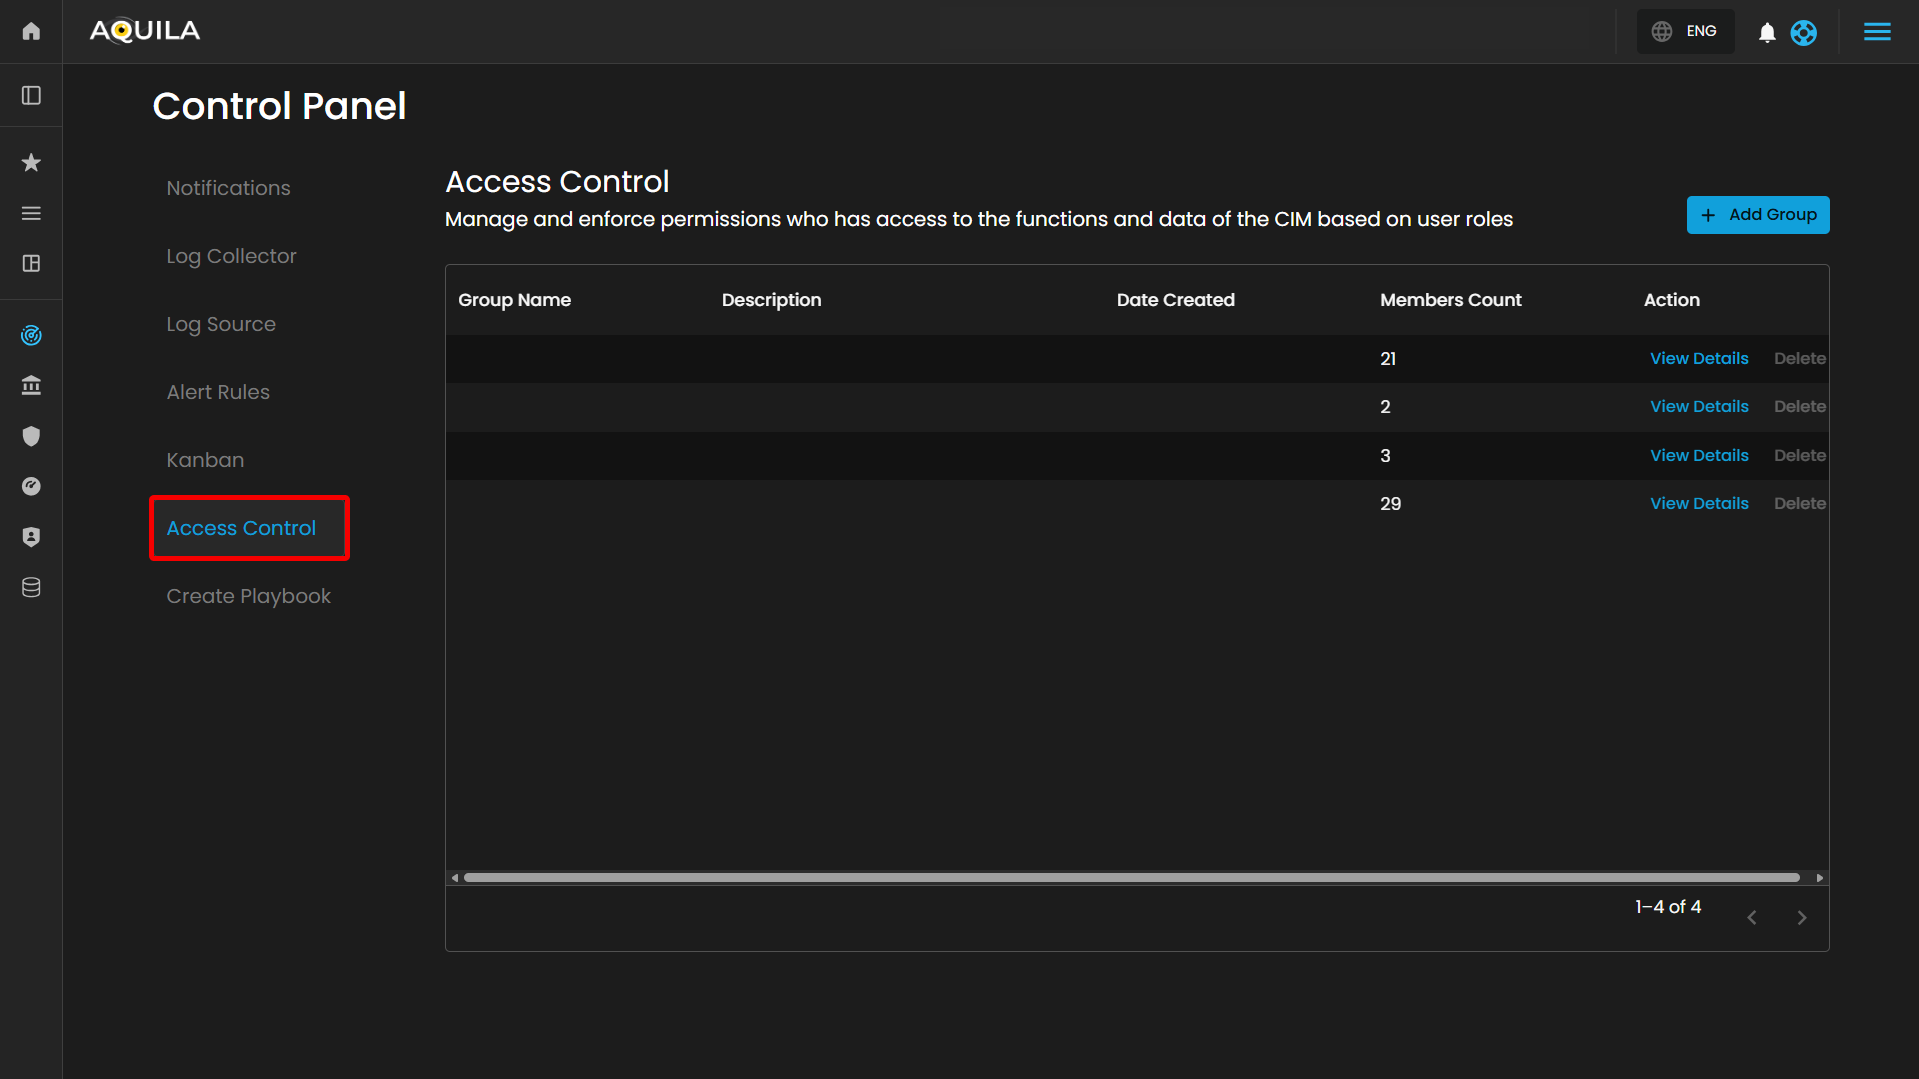
The Access Control page provides a user interface for managing and enforcing user permissions within a Case Incident Management (CIM) system or similar application. It allows administrators to define and oversee groups based on roles, controlling access to functions and data. This interface appears tailored for security or administrative contexts, such as role-based access control (RBAC) in cybersecurity tools.
Header Section
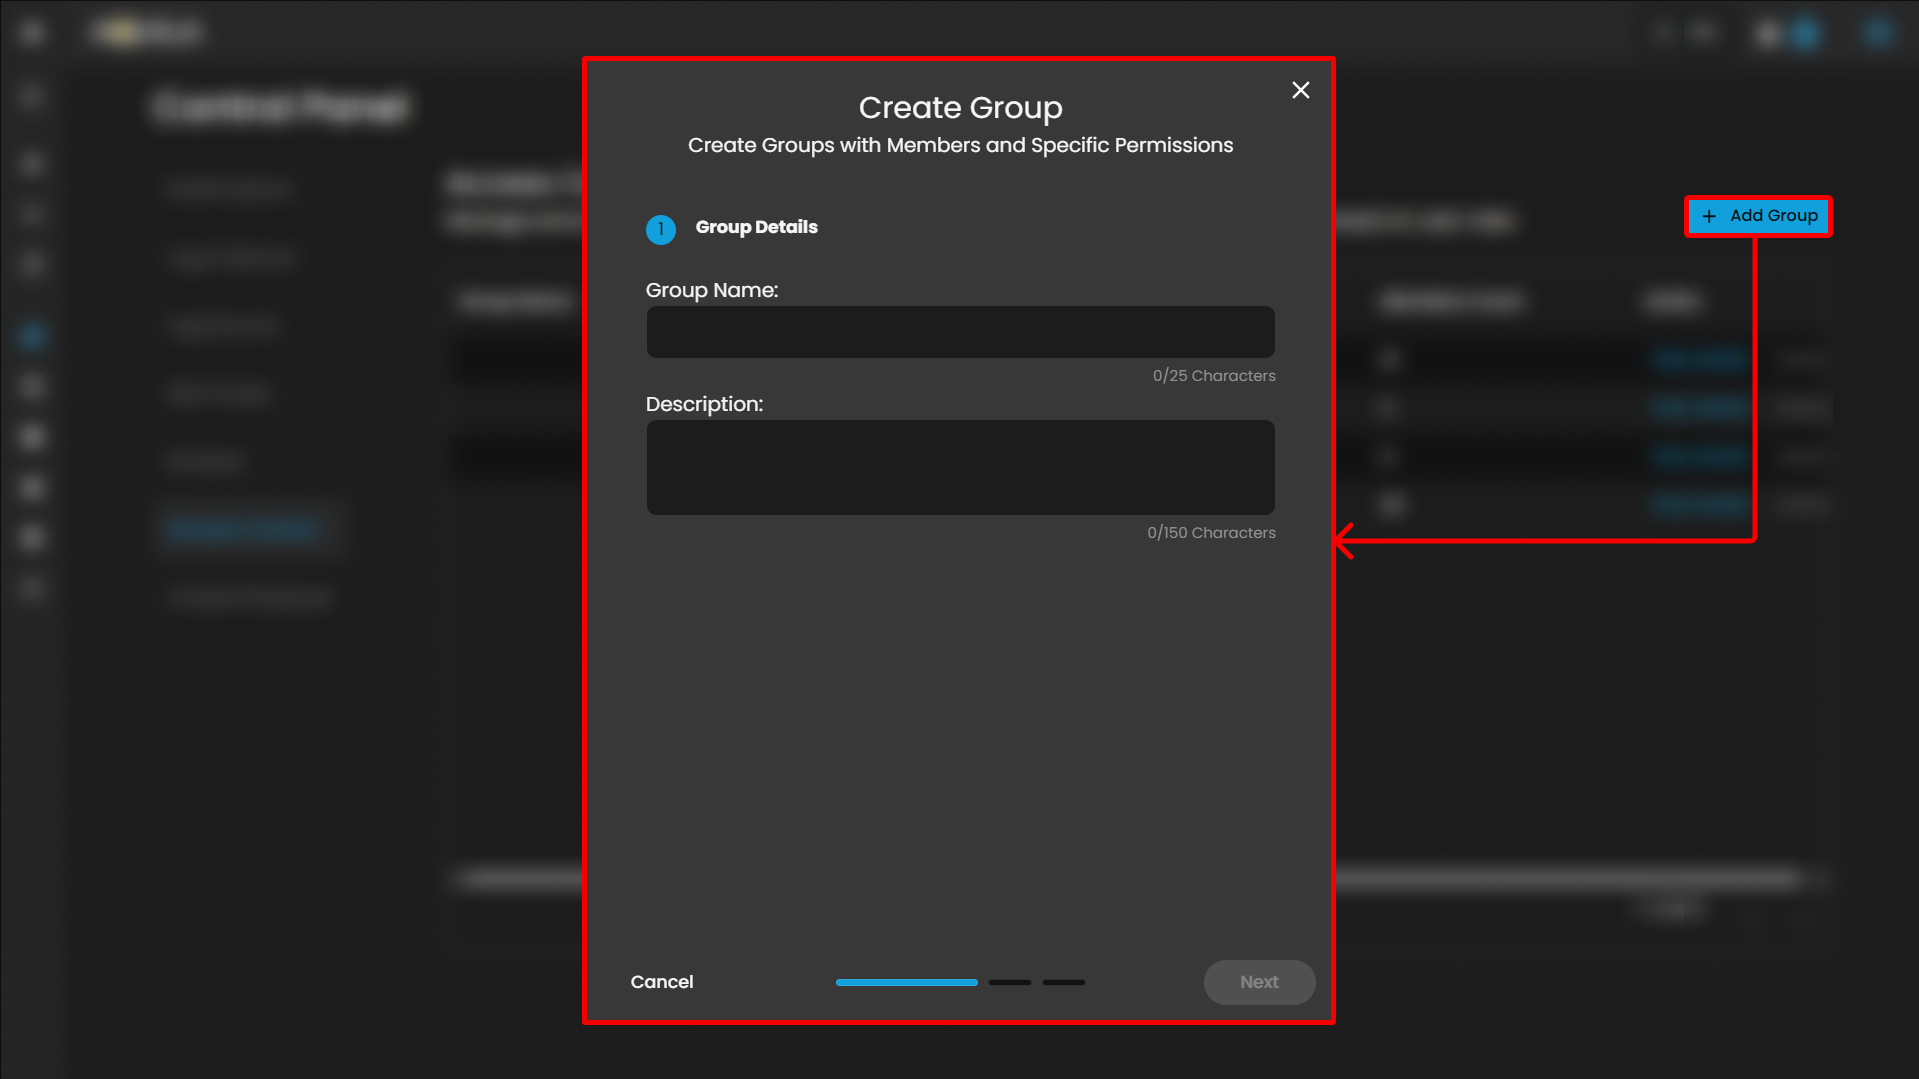
Table Section
- Table Headers:
- Group Name: Lists the name of each user group.
- Description: Provides a brief overview or purpose of the group (blank in the visible row).
- Date Created: Indicates the creation timestamp of the group (blank in the visible row).
- Members Count: Shows the number of users assigned to the group.
- Action: Contains links or buttons for managing the group.
- Action:
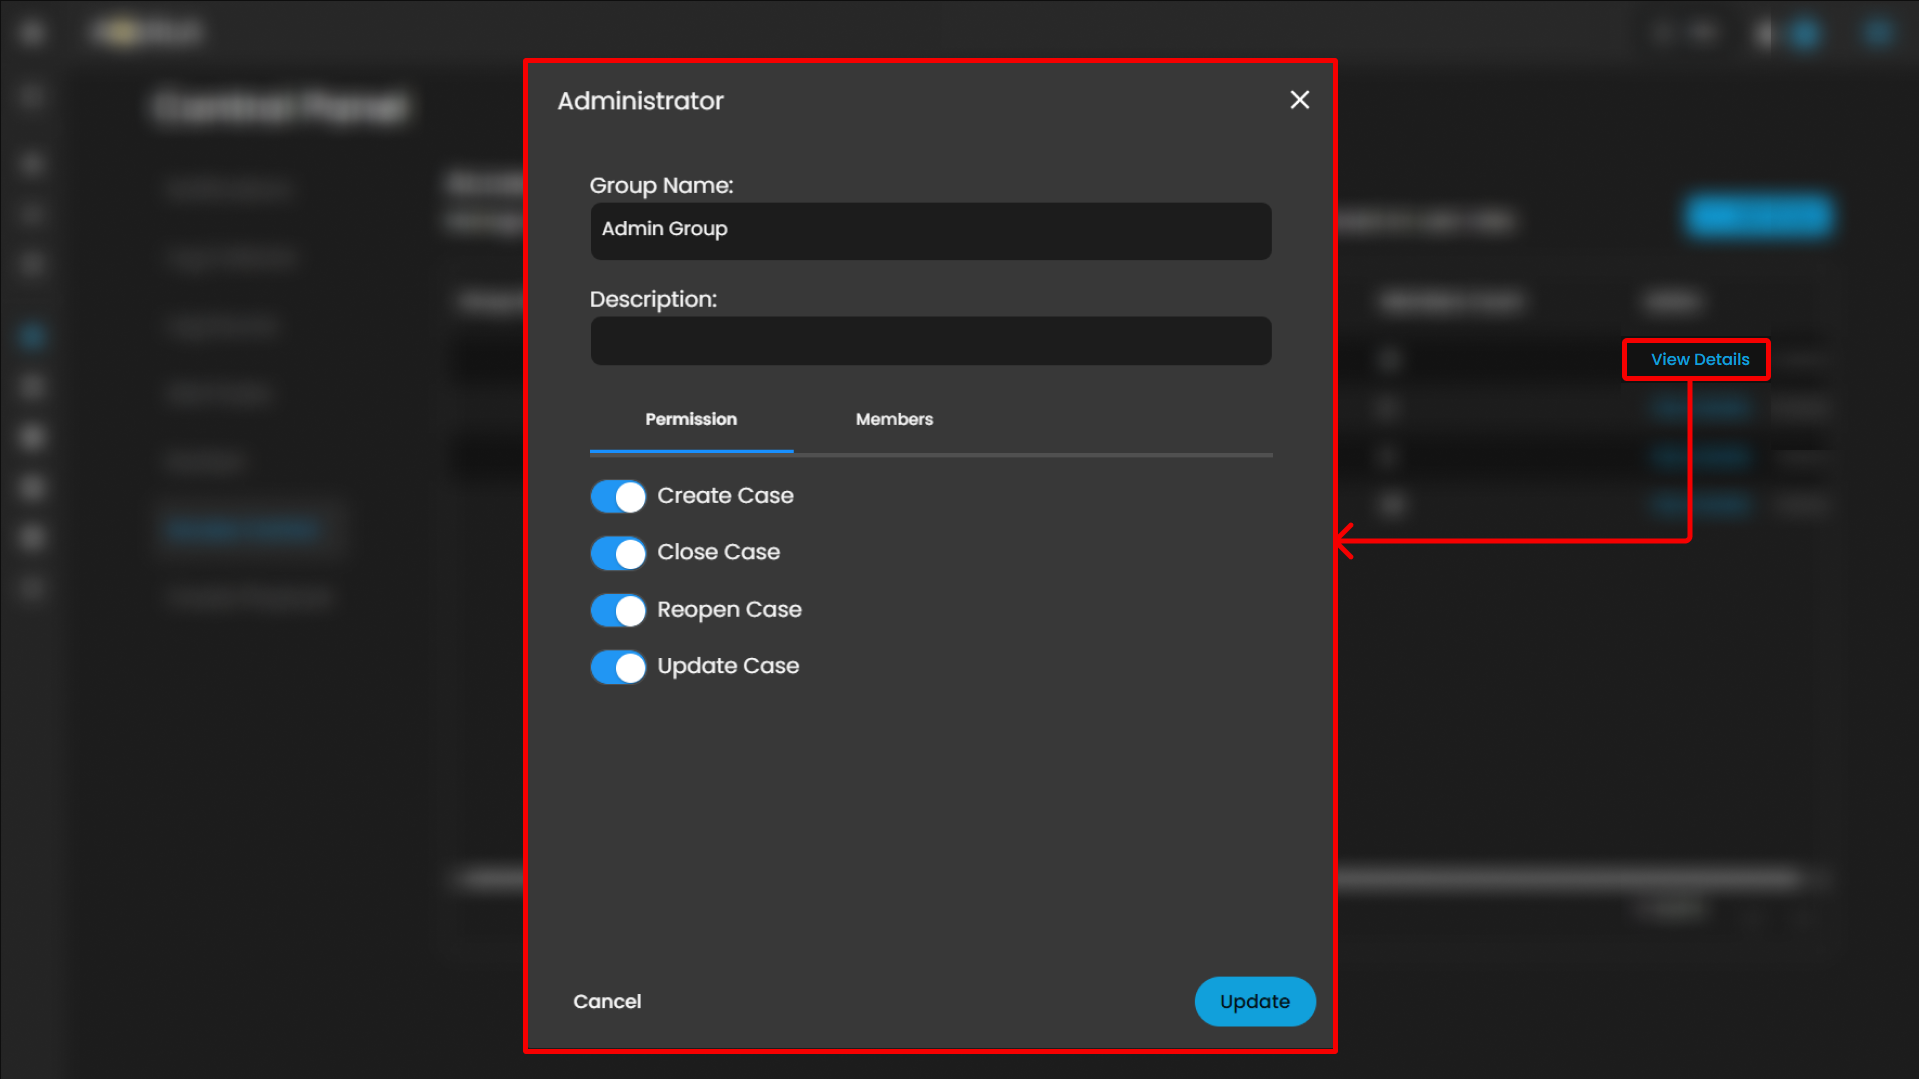
- "View Details" (blue link): Likely opens a detailed view or edit modal for the group.
- "Delete" (gray link): Allows removal of the group.
When clicking the View Details link it will open a pop up that will show the group settings, permissions and members list that you can change and update.
Create Playbook Container
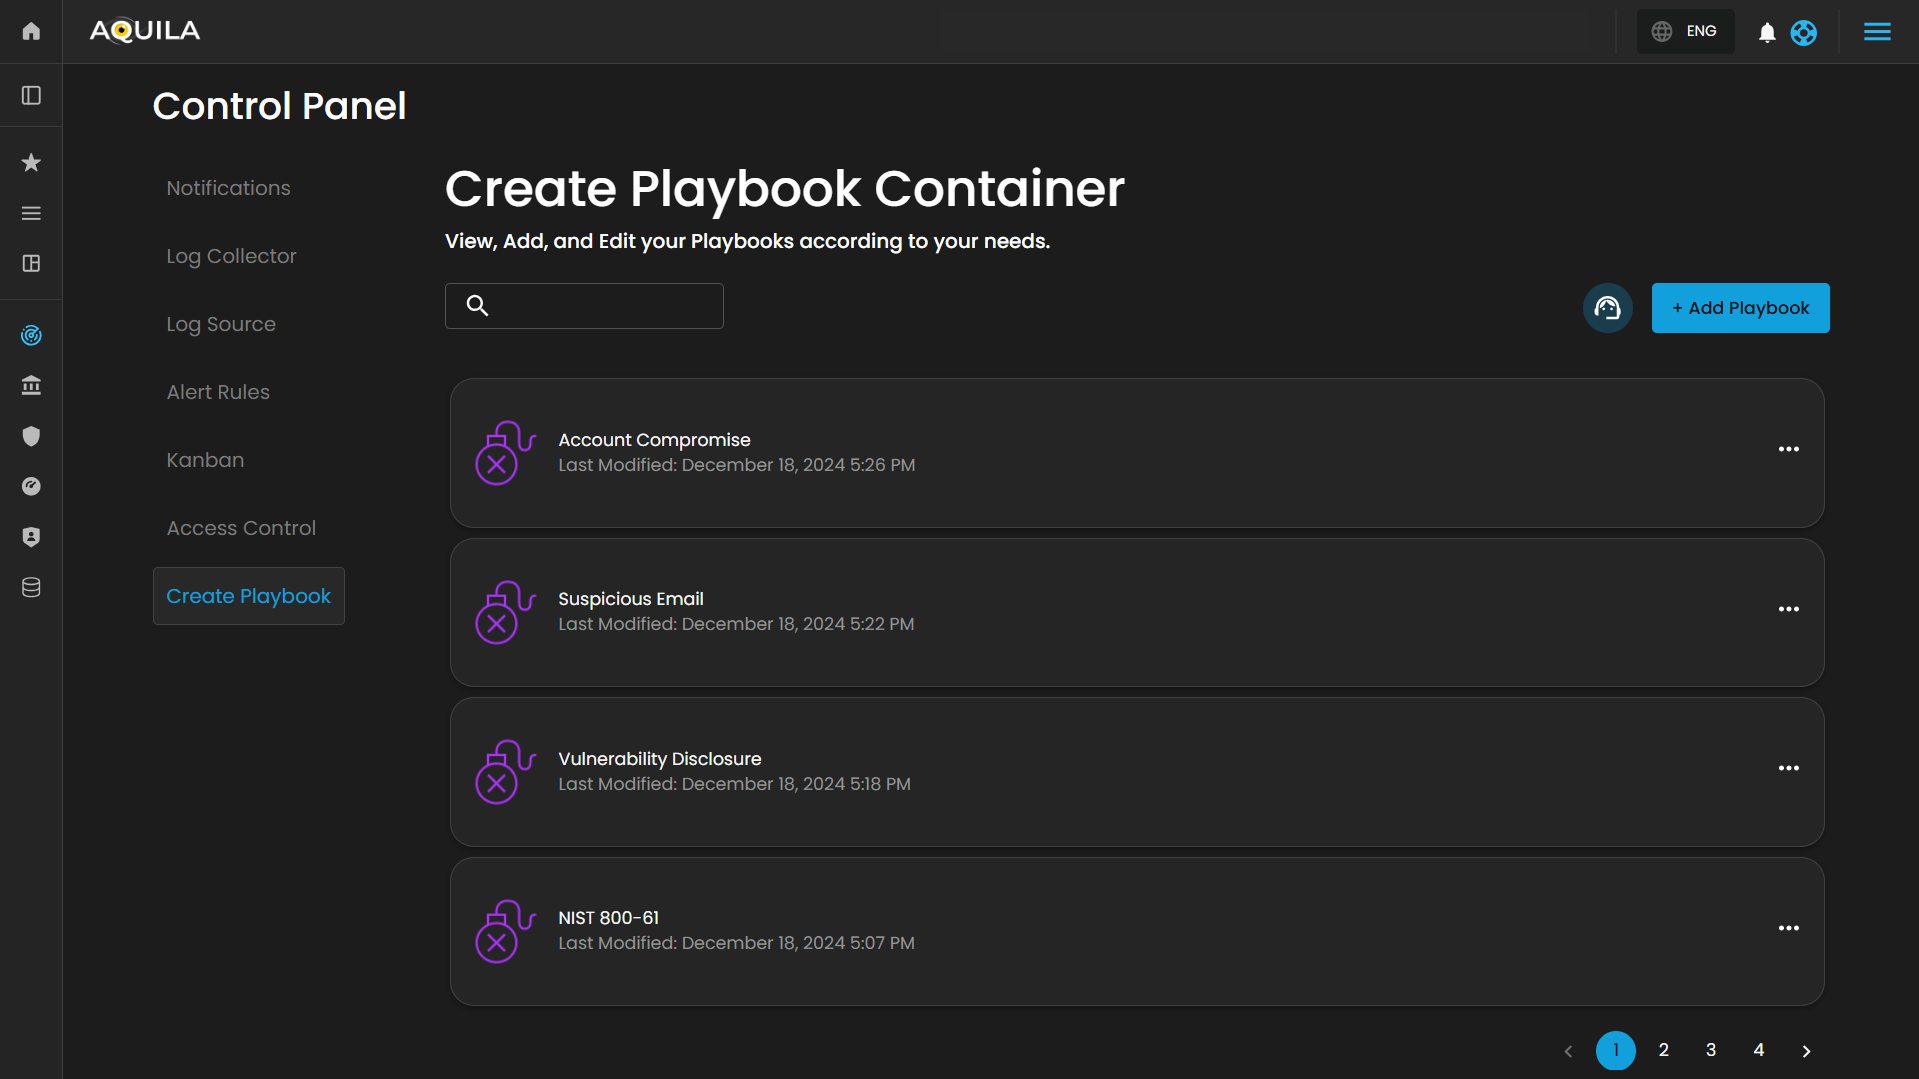
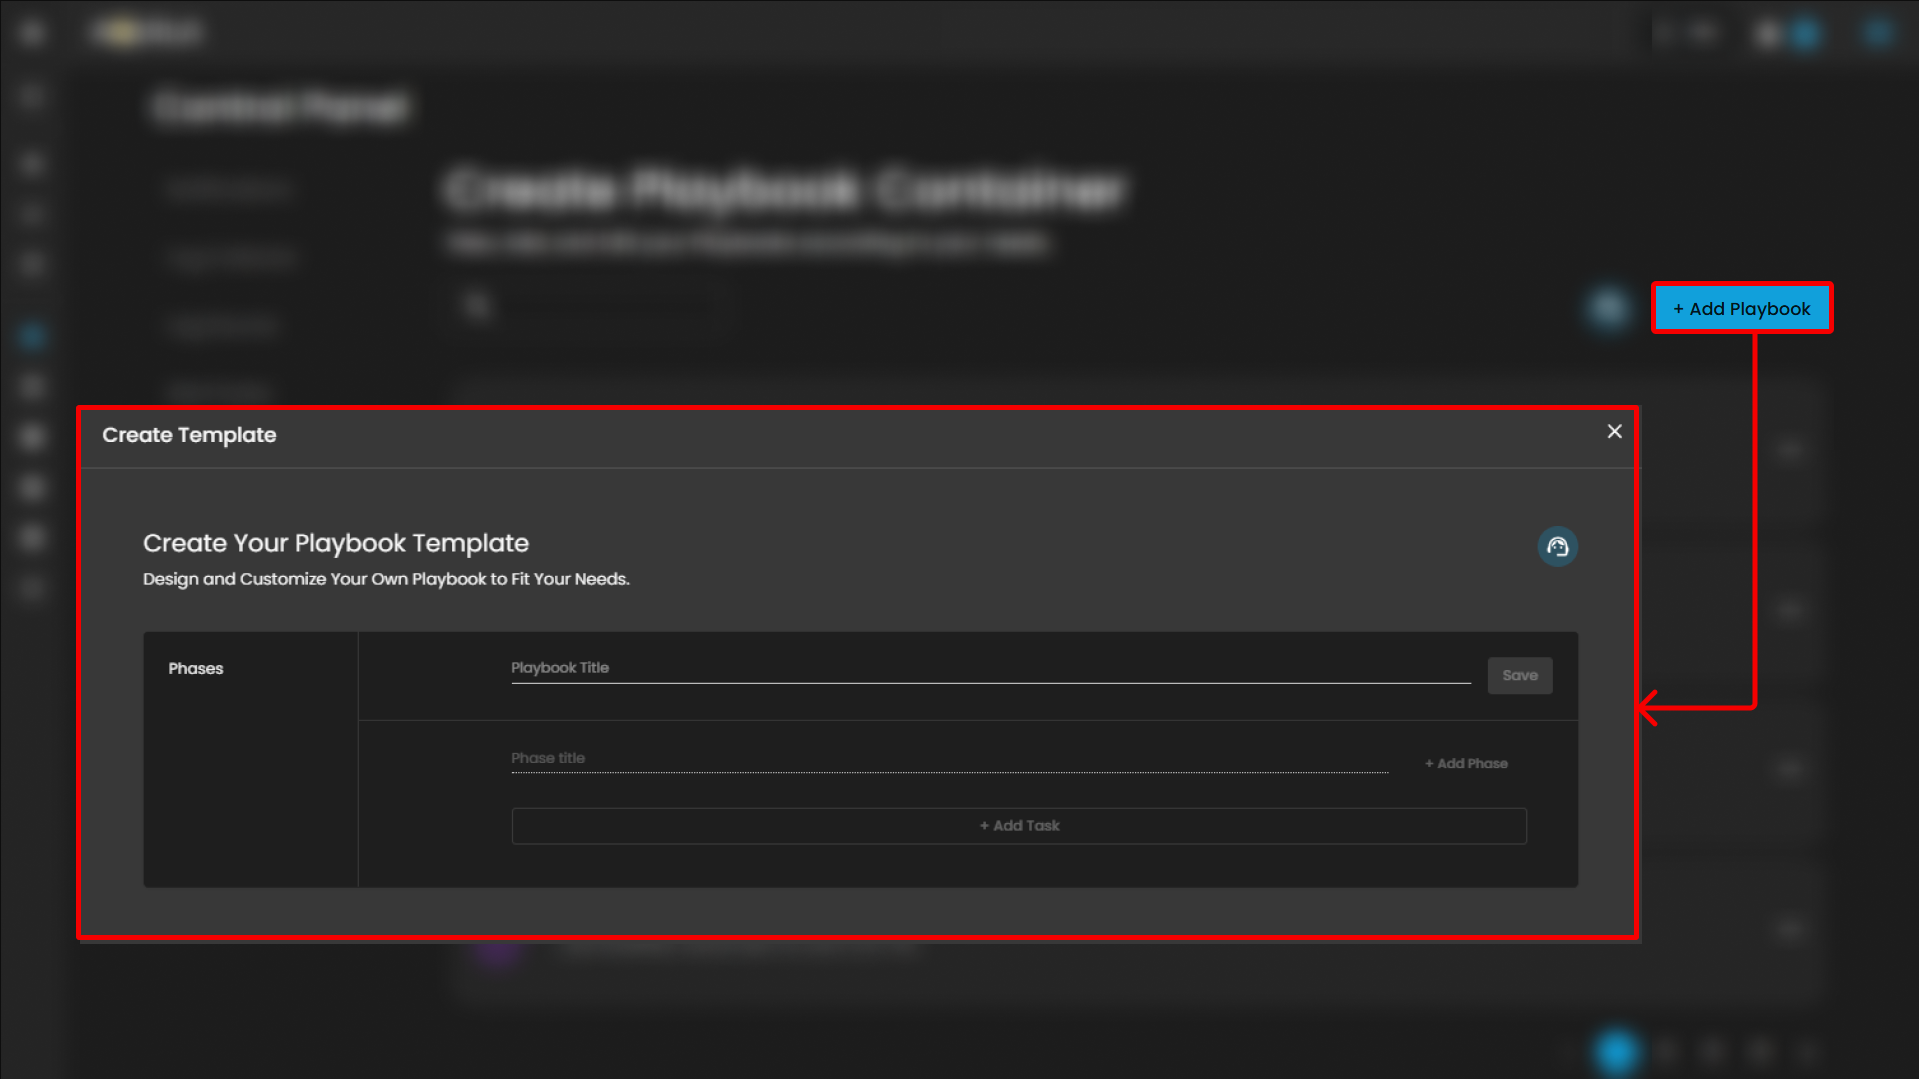
Users can create a new playbook by pressing the "Add Playbook" button.
Conclusion:
Cyber Incident Management is a comprehensive module designed to support the detection, handling, and resolution of cybersecurity incidents. It provides a robust set of tools that enable organizations to efficiently identify threats, coordinate incident response activities, minimize operational and security impact, and ensure timely remediation. The module supports alert ingestion and correlation, incident tracking, root cause analysis, and detailed reporting, allowing security teams to maintain visibility across the entire incident lifecycle. By leveraging automated alerts, structured workflows, and analytical reporting capabilities, Cyber Incident Management enhances situational awareness, improves response efficiency, and strengthens an organization’s overall security posture.
Please refer to the document from the previous sub-module: CyTech AQUILA - Cyber Incident Management (CIM): Alert Rules
CyTech AQUILA - Cyber Incident Management (CIM): Reports
CyTech AQUILA - Cyber Incident Management (CIM): Data Explorer
CyTech AQUILA - Cyber Incident Management (CIM): Cases
CyTech AQUILA - Cyber Incident Management (CIM): Alerts
If you need further assistance, kindly contact our support at support@cytechint.com for prompt assistance and guidance.