Agent-less Integration
Integrate AQUILA seamlessly across your infrastructure without installing local agents. Using secure network connections and APIs, AQUILA collects data, monitors activity, and delivers real-time insights with minimal system impact. Simplify deployment, reduce maintenance, and gain complete visibility with AQUILA’s efficient agentless integration approach.
- NG SIEM - 1Password Integration
- NG SIEM - Abusech Integration
- NG SIEM - Atlassian Confluence Integration
- NG SIEM - (Plain Scope) Atlassian Confluence Integration
- NG SIEM - Atlassian Jira Integration
- NG SIEM - AWS Integration
- NG SIEM - Azure CSPM Integration
- NG SIEM - Azure Logs Integration
- NG SIEM - CISCO Meraki Integration
- NG SIEM - CISCO Umbrella Integration
- NG SIEM - CISCO Secure Endpoint Integration
- NG SIEM - Cloudflare Integration
- NG SIEM - CrowdStrike Integration
- NG SIEM - GCP CSPM Integration
- NG SIEM - GCP Integration
- NG SIEM - GitHub Integration
- NG SIEM - GoogleWorkspace Integration
- NG SIEM - Microsoft 365 Integration
- NG SIEM - Mimecast Integration
- NG SIEM - Salesforce Integration via JWT Authentication
- NG SIEM - Sophos Central Integration
- NG SIEM- AWS CSPM Integration
- NG SIEM – LastPass Integration
- NG SIEM - Apache Tomcat
- NG SIEM - Microsoft Defender ATP Logs
- NG SIEM - Microsoft Defender for Cloud
- AQUILA - Microsoft Defender for Endpoint
- NG SIEM - Microsoft Defender XDR
- NG SIEM Microsoft Entra ID
- NG SIEM - Microsoft Entra ID Entity Analytics
- NG SIEM Microsoft Exchange Online Message Trace
- NG SIEM - Microsoft Exchange Server
- NG SIEM Microsoft Graph Activity Logs
- NG SIEM - CISCO DUO
NG SIEM - 1Password Integration
1Password Events Reporting Integration Manual
With 1Password Business, you can forward account activity to your SIEM system using the 1Password Events API. This enables centralized monitoring, improved visibility, and enhanced response to security-related events across your organization.
Key Benefits
When integrated with your SIEM, 1Password Events Reporting allows you to:
-
Retain 1Password event data according to your organization's policies
-
Build custom dashboards and visualizations for insights
-
Configure custom alerts to automate responses
-
Correlate 1Password events with data from other systems and services
Permissions Required
You must be an Owner or Administrator of your 1Password Business account to configure Events Reporting.
Supported Event Types
Sign-In Attempts
Track authentication activity including:
-
Username and IP address of the user
-
Timestamp of the sign-in attempt
-
Success or failure status
-
Cause of failure (for failed attempts)
These logs help monitor account access patterns and detect unauthorized access attempts.
If you need further assistance, kindly contact support@cytechint.com for prompt assistance and guidance.
NG SIEM - Abusech Integration
This integration is designed to collect and process AbuseCH threat intelligence logs. It retrieves indicators from multiple AbuseCH APIs and makes them available for security monitoring and analysis.
Supported Datasets
The integration provides the following datasets:
-
URL Dataset
-
Retrieves URL-based indicators from the AbuseCH API.
- Data source: URLhaus API Documentation
-
- Malware Dataset
-
Retrieves malware-based indicators from the AbuseCH API.
-
-
MalwareBazaar Dataset
-
Retrieves indicators from MalwareBazaar, a community-driven project hosted by AbuseCH.
-
URL Logs
The AbuseCH URL data stream fetches threat intelligence indicators from the following API endpoint:
https://urlhaus-api.abuse.ch/v1/urls/recent/This stream provides details on recently observed malicious URLs that can be used for detection, correlation, and blocking in security systems.
If you need further assistance, kindly contact support@cytechint.com for prompt assistance and guidance.
NG SIEM - Atlassian Confluence Integration
What are API Token Scopes?
Scopes define what actions an API token is allowed to perform in Atlassian apps such as Jira and Confluence. They enhance security by limiting permissions to only what's needed (e.g., read-only access to audit logs). Always use scoped tokens for AQUILA integrations—unscoped tokens are deprecated for most apps and may not support fine-grained access. For audit logs (events like user actions, config changes, or security incidents), use the specific scopes listed below. Broader scopes may be needed for other integrations (e.g., content indexing), but stick to these for basic monitoring to minimize risk.
Creating an API Token with Scopes
Follow these steps to create a token. Note: As of March 13, 2025, tokens created before December 15, 2024, will expire between March 14 and May 12, 2026. New tokens default to 1-year expiration (adjustable from 1 to 365 days).
- Log in to https://id.atlassian.com/manage-profile/security/api-tokens.
- Select "Create API token with scopes".
- Enter a descriptive name for the token (e.g., "AQUILA- Audit Logs Monitoring").
- Choose an expiration date for the token (between 1 and 365 days; consider shorter for security).
- Select the application (Jira or Confluence). Important: Create separate tokens for Jira and Confluence—tokens are app-specific and cannot access both.
- Select the scopes or permissions the token should have:
- For Jira (audit logs): read:audit-log:jira (allows viewing audit events).
- For Confluence (audit logs): read:audit-log:confluence (allows viewing audit events; add write:audit-log:confluence if needed for custom logging, but not required for AQUILA).
- Click "Create".
- Copy the token and save it securely. You cannot view it again after this step. If lost, generate a new one. Share only with trusted integrations like AQUILA—revoke if compromised.
Required Atlassian-Side Permissions
The user account tied to the email (Jira/Confluence User Identifier) must have admin-level access to fetch audit logs via API:
- For Jira: "Administer Jira" global permission (or Jira System Administrator).
- For Confluence: Confluence Administrator permission.
Without these, the API may authenticate successfully (leading to a "healthy" status in AQUILA) but return no data or errors like 403 Forbidden. If you lack access to the client side, request they verify/add these permissions via admin.atlassian.com > Global Permissions.
Additionally, ensure audit logging is enabled and set to "Full" coverage on the Atlassian side (via their admin settings) to generate events. Low activity instances may produce sparse logs.
Note: If you're on a Free plan without org access, you can't enable advanced features—consider upgrading or using site-level logs in individual apps.
Required Credentials for Integration Access (AQUILA Setup)
Use these in AQUILA > Integrations > Atlassian Jira/Confluence setup (separate integrations for each). For Atlassian Cloud, authentication uses Basic Auth (email + token).
- API URL: Base Atlassian API URL without paths (e.g., https://your-site.atlassian.net for Jira; add /wiki for Confluence endpoints if needed, but AQUILA handles this).
- User Identifier: Your Atlassian email address (must be linked to an admin account as noted above).
- API Token: The scoped token created above.
- Personal Access Token (PAT) - : The Personal Access Token used for self-hosted instances. If set, Jira User Identifier and Jira API Token will be ignored. (Optional)
For self-hosted (Data Center/Server) instances, a Personal Access Token may be used instead, but Cloud setups prefer the API token.
Please provide the following information to CyTech
- API URL: Base Atlassian API URL without paths (e.g., https://your-site.atlassian.net for Jira; add /wiki for Confluence endpoints if needed, but AQUILA handles this).
- Confluence User Identifier: Your Atlassian email address (must be linked to an admin account as noted above).
- Confluence API Token: The scoped token created above.
NG SIEM - (Plain Scope) Atlassian Confluence Integration
What is API Token?
A secure string used to authenticate external applications or scripts so they can access Confluence’s REST APIs without needing a user password. Its main use is to allow programmatic access for integrations, automation, or tools to interact with Confluence content.
Creating an API Token
Follow these steps to create a token. Note: As of March 13, 2025, tokens created before December 15, 2024, will expire between March 14 and May 12, 2026. New tokens default to 1-year expiration (adjustable from 1 to 365 days).
- Log in to https://id.atlassian.com/manage-profile/security/api-tokens.
- Select "Create API token".
- Enter a descriptive name for the token (e.g., "AQUILA- Audit Logs Monitoring").
- Choose an expiration date for the token (between 1 and 365 days; consider shorter for security).
- Click "Create".
- Copy the token and save it securely. You cannot view it again after this step. If lost, generate a new one. Share only with trusted integrations like AQUILA—revoke if compromised.
Required Atlassian-Side Permissions
The user account tied to the email (Jira/Confluence User Identifier) must have admin-level access to fetch audit logs via API:
- For Confluence: Confluence Global permission.
https://your-domain.atlassian.net/wiki/admin/permissions/global?tab=internal - The confluence-admins-ronaldoa both Personal Space and Create Space should be checked. Click the "Edit" to proceed.

- For Confluence: Confluence Administration permission.
https://admin.atlassian.com/o/8d1afe09-e60a-4bf3-87d9-c71b10e4842b/atlassian-apps - Click "Manage app".

- Provide Role App admin, User access admin, user in confluence-admins-ronaldoa.

- In Groups under by Directory, make sure the User is active.

Without this, the API may authenticate successfully (leading to a "healthy" status in AQUILA) but return no data or errors like 403 Forbidden. If you lack access to the client side, request they verify/add these permissions via admin.atlassian.com > Global Permissions.
Note: If you're on a Free plan without org access, you can't enable advanced features—consider upgrading or using site-level logs in individual apps.
Required Credentials for Integration Access (AQUILA Setup)
Use these in AQUILA > Integrations > Atlassian Jira/Confluence setup (separate integrations for each). For Atlassian Cloud, authentication uses Basic Auth (email + token).
- API URL: Base Atlassian API URL without paths (e.g., https://your-site.atlassian.net for Confluence; add /wiki for Confluence endpoints if needed, but AQUILA handles this).
- User Identifier: Your Atlassian email address (must be linked to an admin account as noted above).
- API Token: The scoped token created above.
- Personal Access Token (PAT) - : The Personal Access Token used for self-hosted instances. If set, Jira User Identifier and Jira API Token will be ignored. (Optional)
For self-hosted (Data Center/Server) instances, a Personal Access Token may be used instead, but Cloud setups prefer the API token.
Please provide the following information to CyTech
- API URL: Base Atlassian API URL without paths (e.g., https://your-site.atlassian.net for Jira; add /wiki for Confluence endpoints if needed, but AQUILA handles this).
- Confluence User Identifier: Your Atlassian email address (must be linked to an admin account as noted above).
- Confluence API Token: The scoped token created above.
NG SIEM - Atlassian Jira Integration
What are API Token Scopes?
Scopes define what actions an API token is allowed to perform in Atlassian apps such as Jira and Confluence. They enhance security by limiting permissions to only what's needed (e.g., read-only access to audit logs). Always use scoped tokens for AQUILA integrations—unscoped tokens are deprecated for most apps and may not support fine-grained access. For audit logs (events like user actions, config changes, or security incidents), use the specific scopes listed below. Broader scopes may be needed for other integrations (e.g., content indexing) but stick to these for basic monitoring to minimize risk.
Creating an API Token with Scopes
Follow these steps to create a token. Note: As of March 13, 2025, tokens created before December 15, 2024, will expire between March 14 and May 12, 2026. New tokens default to 1-year expiration (adjustable from 1 to 365 days).
- Log in to https://id.atlassian.com/manage-profile/security/api-tokens.
- Select "Create API token with scopes".
- Enter a descriptive name for the token (e.g., "AQUILA- Audit Logs Monitoring").
- Choose an expiration date for the token (between 1 and 365 days; consider shorter for security).
- Select the application (Jira or Confluence). Important: Create separate tokens for Jira and Confluence—tokens are app-specific and cannot access both.
- Select the scopes or permissions the token should have:
- For Jira (audit logs): read:audit-log:jira (allows viewing audit events).
- For Confluence (audit logs): read:audit-log:confluence (allows viewing audit events; add write:audit-log:confluence if needed for custom logging, but not required for AQUILA).
- Click "Create".
- Copy the token and save it securely. You cannot view it again after this step. If lost, generate a new one. Share only with trusted integrations like AQUILA—revoke if compromised.
Required Atlassian-Side Permissions
The user account tied to the email (Jira/Confluence User Identifier) must have admin-level access to fetch audit logs via API:
- For Jira: "Administer Jira" global permission (or Jira System Administrator).
- For Confluence: Confluence Administrator permission.
Without these, the API may authenticate successfully (leading to a "healthy" status in AQUILA) but return no data or errors like 403 Forbidden. If you lack access to the client side, request they verify/add these permissions via admin.atlassian.com > Global Permissions.
Additionally, ensure audit logging is enabled and set to "Full" coverage on the Atlassian side (via their admin settings) to generate events. Low activity instances may produce sparse logs.
Note: If you're on a Free plan without org access, you can't enable advanced features—consider upgrading or using site-level logs in individual apps.
Required Credentials for Integration Access (AQUILA Setup)
Use these in AQUILA > Integrations > Atlassian Jira/Confluence setup (separate integrations for each). For Atlassian Cloud, authentication uses Basic Auth (email + token).
- API URL: Base Atlassian API URL without paths (e.g., https://your-site.atlassian.net for Jira; add /wiki for Confluence endpoints if needed, but AQUILA handles this).
- User Identifier: Your Atlassian email address (must be linked to an admin account as noted above).
- API Token: The scoped token created above.
- Personal Access Token (PAT) - : The Personal Access Token used for self-hosted instances. If set, Jira User Identifier and Jira API Token will be ignored. (Optional)
For self-hosted (Data Center/Server) instances, a Personal Access Token may be used instead, but Cloud setups prefer the API token.
Please provide the following information to CyTech
- API URL: Base Atlassian API URL without paths (e.g., https://your-site.atlassian.net for Jira; add /wiki for Confluence endpoints if needed, but AQUILA handles this).
- Jira User Identifier: Your Atlassian email address (must be linked to an admin account as noted above).
- Jira API Token: The scoped token created above.
NG SIEM - AWS Integration
Overview
The AWS Integration enables the collection of logs and metrics from your Amazon Web Services (AWS) environment. This integration helps centralize security and operational data for monitoring, investigation, and reporting.
Data Streams
The AWS integration collects two main types of data:
-
Logs – Records of events that occur within your AWS account.
Examples:-
Every request received by CloudFront
-
Actions performed by AWS users or roles
-
API activity captured by CloudTrail
-
-
Metrics – Real-time insights into the performance and health of AWS services.
Examples:-
CPU utilization of EC2 instances
-
S3 storage usage
-
RDS performance metrics
-
AWS cost and usage breakdowns
-
Requirements
Before configuring the AWS integration, ensure you have:
-
AWS Credentials – To connect to your AWS account.
-
AWS Permissions – To grant access to the necessary AWS services.
Step 1. Create IAM User and Custom Policy
-
IAM User
-an identity you create in AWS Identity and Access Management (IAM) that represents a person or application which needs to interact with your AWS resources. - User Policy and Permissions
The IAM User must be granted the following permissions:
{
	"Version": "2012-10-17",
	"Statement": [
		{
			"Effect": "Allow",
			"Action": [
				"ce:GetCostAndUsage",
				"cloudwatch:GetMetricData",
				"cloudwatch:ListMetrics",
				"ec2:DescribeInstances",
				"ec2:DescribeRegions",
				"iam:ListAccountAliases",
				"inspector2:ListFindings",
				"logs:DescribeLogGroups",
				"logs:FilterLogEvents",
				"organizations:ListAccounts",
				"rds:DescribeDBInstances",
				"rds:ListTagsForResource",
				"s3:GetBucketLocation",
				"s3:GetObject",
				"s3:ListBucket",
				"sns:ListTopics",
				"sqs:ChangeMessageVisibility",
				"sqs:DeleteMessage",
				"sqs:GetQueueAttributes",
				"sqs:ListQueues",
				"sqs:ReceiveMessage",
				"sts:AssumeRole",
				"sts:GetCallerIdentity",
				"tag:GetResources"
			],
			"Resource": "*"
		}
	]
}
Step 2: Create Access Key
Long-term credentials associated with an IAM user or the AWS root account.
-
-
Access Key ID – First part of the access key
-
Secret Access Key – Second part of the access key
-
Step 3: Create a CloudTrail Trail and Send Logs to S3
Set up an AWS CloudTrail trail to record account activity and deliver log files into an S3 bucket for secure storage, auditing, and compliance monitoring.
- Open CloudTrail > Create a New Trail
-
Trail Settings
-
Trail name: Enter a unique name.
-
Apply trail to all accounts in my organization.
-
-
Choose an S3 Bucket
-
Storage location → Select Create new S3 bucket or Use existing bucket.
If using new bucket:
-
Enter a bucket name.
-
CloudTrail will create the bucket and add the correct permissions.
If using existing bucket:
-
Select your bucket from the dropdown.
-
CloudTrail will prompt you to allow access. Click Yes to let CloudTrail update the bucket policy.
-
-
Additional Settings
- Enable for all accounts in my organization
-
Log file SSE-KMS encryption: Enable if you want encryption with a KMS key(optional).
-
Log file validation: Enable to verify log integrity.
- Choose Log Events
- Event Type
- Management events - Capture management operations performed on your AWS resources.
- Data events - Log the resource operations performed on or within a resource.
- Insights events - Identify unusual activity, errors, or user behavior in your account.
- Network activity events - Network activity events provide information about resource operations performed on a resource within a virtual private cloud endpoint.
-
Management events:
-
Check Read(default is usually All).
-
- Event Type
-
Review and Create
-
Review your configuration summary.
-
Click Create trail.
-
To configure the AWS Integration:
Please provide the following information to CyTech Support:
- Access key ID
- Secret Access Key
-
Region
-
Trail Log Collection > S3 Bucket ARN
If you need further assistance, kindly contact support@cytechint.com for prompt assistance and guidance.
NG SIEM - Azure CSPM Integration
This manual explains how to get started monitoring the security posture of your Azure CSP using the Cloud Security Posture Management (CSPM) feature.
Requirements
- The user who gives the CSPM integration permissions in Azure must be an Azure subscription admin.
Setup
Service principal with client secret
Before using this method, you must have set up a Microsoft Entra application and service principal that can access resources. Please go here before following the steps below.
- The following information is required.
- Directory (tenant) ID and Application (client) ID
- To get these values:
- Go to the Registered apps section of Microsoft Entra ID.
- Click on New Registration, name your app and click Register.
- Copy your new app’s Directory (tenant) ID and Application (client) ID.
- To get these values:
- Client Secret
- In Azure portal, select Certificates & secrets, then go to the Client secrets tab. Click New client secret.
- Copy the new secret.
- Directory (tenant) ID and Application (client) ID
- Return to Azure. Go to your Azure subscription list and select the subscription or management group you want to monitor with CSPM.
- Go to Access control (IAM) and select Add Role Assignment.
- Select the Reader function role, assign access to User, group, or service principal, and select your new app.
Please saved and provide this values to AQUILA Support Team.
- Directory (tenant) ID
- Application (client) ID
-
Client Secret Value:
If you need further assistance, kindly contact support@cytechint.com for prompt assistance and guidance.
NG SIEM - Azure Logs Integration
The Azure Logs integration enables you to collect logs from specific Azure services such as:
-
Microsoft Entra ID (Sign-in, Audit, Identity Protection, Provisioning logs)
-
Azure Spring Apps
-
Azure Firewall
-
Microsoft Graph Activity
-
Activity and Platform logs
-
Additional supported Azure services
Example Use Cases
-
Brute force sign-in detection: Collect Microsoft Entra ID sign-in logs and configure an alert in the Observability Logs app to notify you if failed sign-in attempts exceed a defined threshold.
-
Capacity planning: Collect Azure Activity logs to track when virtual machines fail to start due to quota limits, helping plan resource scaling.
Data Streams
The Azure Logs integration collects log data streams from the following sources:
-
Activity Logs
-
Platform Logs
-
Microsoft Entra ID Logs (Sign-in, Audit, Identity Protection, Provisioning)
-
Microsoft Graph Activity Logs
-
Azure Spring Apps Logs
Logs provide a complete record of events that occur in your Azure environment, allowing you to detect threats, troubleshoot issues, and plan capacity.
Azure Setup Prerequisites
To successfully forward Azure logs, you will need:
-
Diagnostic Settings
-
Configure diagnostic settings in Azure to export metrics and logs from source services (e.g., Entra ID, Activity Logs).
-
Logs must be sent to a supported destination for analysis and storage.
-
-
Event Hubs
-
One or more Event Hubs to temporarily store and stream logs exported by Azure services.
-
Log Collector will use Event Hubs as the ingestion point.
-
-
Storage Account Container
-
A Storage Account container to store checkpoint information about logs consumed by Log Collector.
-
This ensures logs are ingested reliably without duplication or loss.
-
Step 1: Create an Event Hub for Microsoft Entra ID Logs
-
Go to Azure Portal > Event Hubs > Create Namespace
- Select Resource Group or create a new one.
- Choose a Region and a Pricing Tier (Standard or Premium).
- Click Review + Create → Create.
-
Create an Event Hub inside the namespace
- Navigate to the Namespace → Click + Event Hub.
- Set Name: entra-id-logs (Example)
- Set Partitions: At least 2 (for redundancy).
- Click Create.
-
Create a Consumer Group (Optional)
- Go to Event Hub > Consumer Groups.
- Add a new group (e.g., aquila-agent-group).
-
Generate Connection String
- Navigate to Event Hubs Namespace > Shared Access Policies.
- Click + Add Policy.
- Set Name: AquilaAgentPolicy.
- Select "Listen" permission.
- Copy Primary Connection String (used in the next steps).
Step 2: Enable Diagnostic Settings for Microsoft Entra ID
- Go to Azure Portal > Microsoft Entra ID.
- Navigate to Monitoring > Diagnostic Settings.
- Click + Add Diagnostic Setting and configure:
- Name: entra-logs-to-aquila
- Log Categories:
-Sign-in logs
-Audit logs
-Identity Protection logs
-Provisioning logs - Destination: Select Event Hubs.
- Choose the Event Hub Namespace created earlier.
- Select the Event Hub (entra-id-logs).
- Click Save.
Step 3: Configure Azure Storage for Checkpointing
-
Create a Storage Account
- Navigate to Azure Portal > Storage Accounts > Create.
- Select Resource Group (same as Event Hub).
- Set Storage Account Name:
- Disable Hierarchical Namespace and Enable TLS 1.2.
- Click Create.
-
Create a Blob Container
- Open the Storage Account > Containers.
- Click + Container.
- Set Name:
- Set Public Access Level: Private.
-
Copy Storage Account Keys
- Go to Storage Account > Access Keys.
- Copy Storage Account Name & Key for integration configuration.
Please saved and provide this values to AQUILA Support Team.
- Event Hub Name:
- Consumer Group:
- Event Hub Connection String:
- Storage Account Name:
- Storage Account Key:
- Storage Container Name:
- Resource Manager Endpoint(optional):
If you need further assistance, kindly contact support@cytechint.com for prompt assistance and guidance.
NG SIEM - CISCO Meraki Integration
Cisco Meraki provides a centralized cloud management platform for devices like MX Security Appliances, MR Access Points, and more. Its cloud-based architecture enables secure, scalable networks manageable from anywhere via the Meraki Dashboard or Mobile App. Each Meraki network generates events that can be collected and analyzed.
Integration Overview
This integration supports event collection through:
-
Syslog messages from Meraki devices
-
API Reporting Webhooks via the Meraki cloud
Events can be searched, observed, and visualized.
Compatibility
-
Supports event collection from MX Security Appliances and MR Access Points via syslog.
-
MS Switch events are not supported and will not be recognized.
Cisco Meraki Dashboard Configuration
Syslog Setup:
Configure one or more syslog servers and specify Meraki message types to send to those servers. For details, refer to the Syslog Server Overview and Configuration guide.
API Endpoint (Webhooks):
Configure Meraki webhooks from the dashboard. See the Webhooks Dashboard Setup for detailed instructions.
Configuring the Cisco Meraki Integration
Syslog Collection:
-
Select one or more of these options based on your syslog server setup:
-
Collect syslog via UDP
-
Collect syslog via TCP
-
Collect syslog from a file
-
-
Enter the appropriate Syslog Host, Port, or File Path based on your selection.
API Webhooks Collection:
-
Enable Collect events from Cisco Meraki via Webhooks.
-
Enter the following values to configure the webhook listener endpoint:
-
Listen Address
-
Listen Port
-
Webhook Path
-
-
The endpoint URL will be:
https://{AGENT_ADDRESS}:8686/meraki/events -
Enter the Secret Value matching the “Shared Secret” set in your Meraki webhook configuration.
-
Provide TLS configuration: Meraki requires HTTPS for webhook endpoints, so configure a valid TLS certificate or use a reverse proxy with HTTPS in front of the integration.
Log Events
Enable this option to collect Cisco Meraki log events across all applications configured for the selected log stream.
Logs Dataset
-
The
cisco_meraki.logdataset contains events collected from the configured syslog server. -
All Cisco Meraki specific syslog fields are available under the
cisco_meraki.logfield group for detailed analysis.
If you need further assistance, kindly contact support@cytechint.com for prompt assistance and guidance.
NG SIEM - CISCO Umbrella Integration
Introduction
Cisco Umbrella is a cloud-delivered security platform that provides an additional layer of defense against malicious threats on the internet using Cisco’s threat intelligence. It helps block access to:
-
Malware
-
Adware
-
Botnets
-
Phishing attacks
-
Known malicious websites
Assumptions
The procedures described in this guide assume that a Log Collector has already been set up.
Prerequisites
- Full Admin access to Cisco Umbrella to create and manage Umbrella API keys.
-
Umbrella API KeyAdmin access (if managing API key scopes and expirations).
Requirements
This integration supports log ingestion from Cisco Umbrella. Data is collected from:
- AWS S3 buckets using an SQS notification queue
- Cisco-managed S3 buckets without SQS
Supported Dataset
- log dataset: Collects Cisco Umbrella logs.
Umbrella Logs
When using Cisco-managed S3 buckets without SQS:
- Load balancing across multiple agents is not supported.
-
A single agent must be configured to poll the S3 bucket.
-
Vertical scaling can be applied by configuring the number of workers.
The log dataset is responsible for collecting all Cisco Umbrella logs.
Advantages of the Umbrella API Integration
The Umbrella API introduces several improvements over older versions (v1 and Reporting v2 APIs):
-
Intuitive base URI
-
API paths defined by top-level scopes
-
Granular, intent-based API key scopes
-
API key expiration support
-
Updated API administration dashboard
-
Programmatic API key administration
-
Authentication & authorization via OAuth 2.0 client credentials flow
-
Portable, programmable API interface for integrations
Before sending requests to the Umbrella API, create Umbrella API credentials and generate an access token.
More details: Cisco Umbrella API Authentication
Authentication
-
The Umbrella API provides a REST interface.
-
Supports OAuth 2.0 client credentials flow.
Steps:
-
Log in to Umbrella at: https://dashboard.umbrella.com
-
Create a new API Key (ID + Secret).
-
Keys can only be copied once at creation.
-
Lost secrets cannot be retrieved.
-
-
Generate an API Access Token using your credentials.
Important: API keys, passwords, and tokens grant access to private customer data. Never share them with external users or organizations.
Managing Umbrella API Keys
Create a New API Key
Refresh an API Key
-
Go to Admin > API Keys.
-
Expand the target key → Click Refresh Key.
-
Copy and save the new Key + Secret.
Update an API Key
-
Expand an existing key.
-
Update Name, Description, Scopes, Expiry, or Network Restrictions.
-
Click Save.
To integrate Cisco Umbrella logs into AQUILA, provide the following details to CyTech Support:
-
Queue URL
-
AWS SQS queue URL where messages will be received.
-
For Cisco-managed S3 without SQS, use Bucket ARN instead.
-
-
Bucket ARN
-
Required for Cisco-managed S3.
-
Example:
arn:aws:s3:::cisco-managed-eu-central-1
-
-
Bucket Region
-
The AWS region where the bucket is located.
-
-
Bucket List Prefix
-
The root folder of the S3 bucket to be monitored (visible in the S3 UI).
-
Example:
1235_654vcasd23431e5dd6f7fsad457sdf1fd5
-
-
Number of Workers
-
Number of workers to process S3 objects (min = 1).
-
-
Bucket List Interval
-
Time interval for polling the S3 bucket. Default = 120s.
-
-
Access Key ID
-
Secret Access Key
If you need further assistance, kindly contact support@cytechint.com for prompt assistance and guidance.
NG SIEM - CISCO Secure Endpoint Integration
Introduction
Cisco Secure Endpoint is a cloud-delivered, advanced endpoint detection and response (EDR) solution. It provides visibility and protection across multiple control points, enabling organizations to rapidly detect, contain, and remediate advanced threats.
Assumptions
The procedures in this guide assume that a Log Collector has already been set up.
Requirements
This integration is designed for collecting Cisco Secure Endpoint logs.
Supported Dataset
-
event dataset → Supports Cisco Secure Endpoint event logs, either:
-
Received over syslog
-
Read from a file
-
Generating Client ID and API Key
To collect logs via the Secure Endpoint API, you must first generate API credentials:
-
Log in to your AMP for Endpoints Console.
-
Navigate to Accounts > Organization Settings.
-
Under Features, click Configure API Credentials.
-
Generate and copy the Client ID and Secure API Key.
Important: You can only copy your API Key at the time of creation. It cannot be retrieved later. Store it securely.
Secure Endpoint Logs
-
The event dataset collects Cisco Secure Endpoint event logs.
Secure Endpoint API Capabilities
The Secure Endpoint API can be used to retrieve and manage detailed information, including:
-
Generate a list of organizations a user has access to.
-
Generate a list of policies for a specified organization.
-
Retrieve detailed information about a specific policy, such as:
-
General policy data
-
Associated network control lists
-
Associated computers
-
Associated groups
-
Proxy settings
-
Policy XML
-
-
Generate a list of all policy types and supported operating systems for an organization.
Top Use Cases
-
Reporting: Generate reports on policy settings across an organization.
-
Inspection: Review a particular policy’s detailed settings.
-
Policy Auditing: Query for policies that match specific criteria to determine which should be updated.
API Response Format
The Secure Endpoint API provides responses in three key objects:
-
Data → Requested content.
-
Meta → Metadata describing the request/response.
-
Errors → Error details if the request fails.
To enable log collection from the Cisco Secure Endpoint API, provide the following information to CyTech Support:
-
Client ID → Cisco Secure Endpoint Client ID
-
API Key → Cisco Secure Endpoint API Key
If you need further assistance, kindly contact support@cytechint.com for prompt assistance and guidance.
NG SIEM - Cloudflare Integration
Introduction
Cloudflare logs provide detailed insights into client connections, request paths through the Cloudflare network, and origin server responses. These logs help track activity, identify issues, and support security and performance analysis.
Authentication Options
You can configure log retrieval using the following authentication methods:
-
Auth Email and Auth Key(Depreciated)
-
API Token
For detailed information on authentication, refer to the Cloudflare API documentation.
1. Configure Using Auth Email and Auth Key
To set up using this method, you need:
-
Auth Email: The email address associated with your Cloudflare account.
-
Auth Key: Your global API key, available on the My Profile page.
-
Zone ID: The unique identifier of your Cloudflare zone, available in the zone's dashboard.
These credentials must be included in the request headers:
-
X-Auth-Email: Your account email. -
X-Auth-Key: Your global API key.
For more details, refer to Cloudflare’s authentication headers guide.
2. Configure Using API Token
To set up using an API token, you need:
-
API Token: A token with appropriate permissions.
-
Zone ID: As noted above, can be found in your Cloudflare zone dashboard.
Minimum Required Permissions for the API Token:
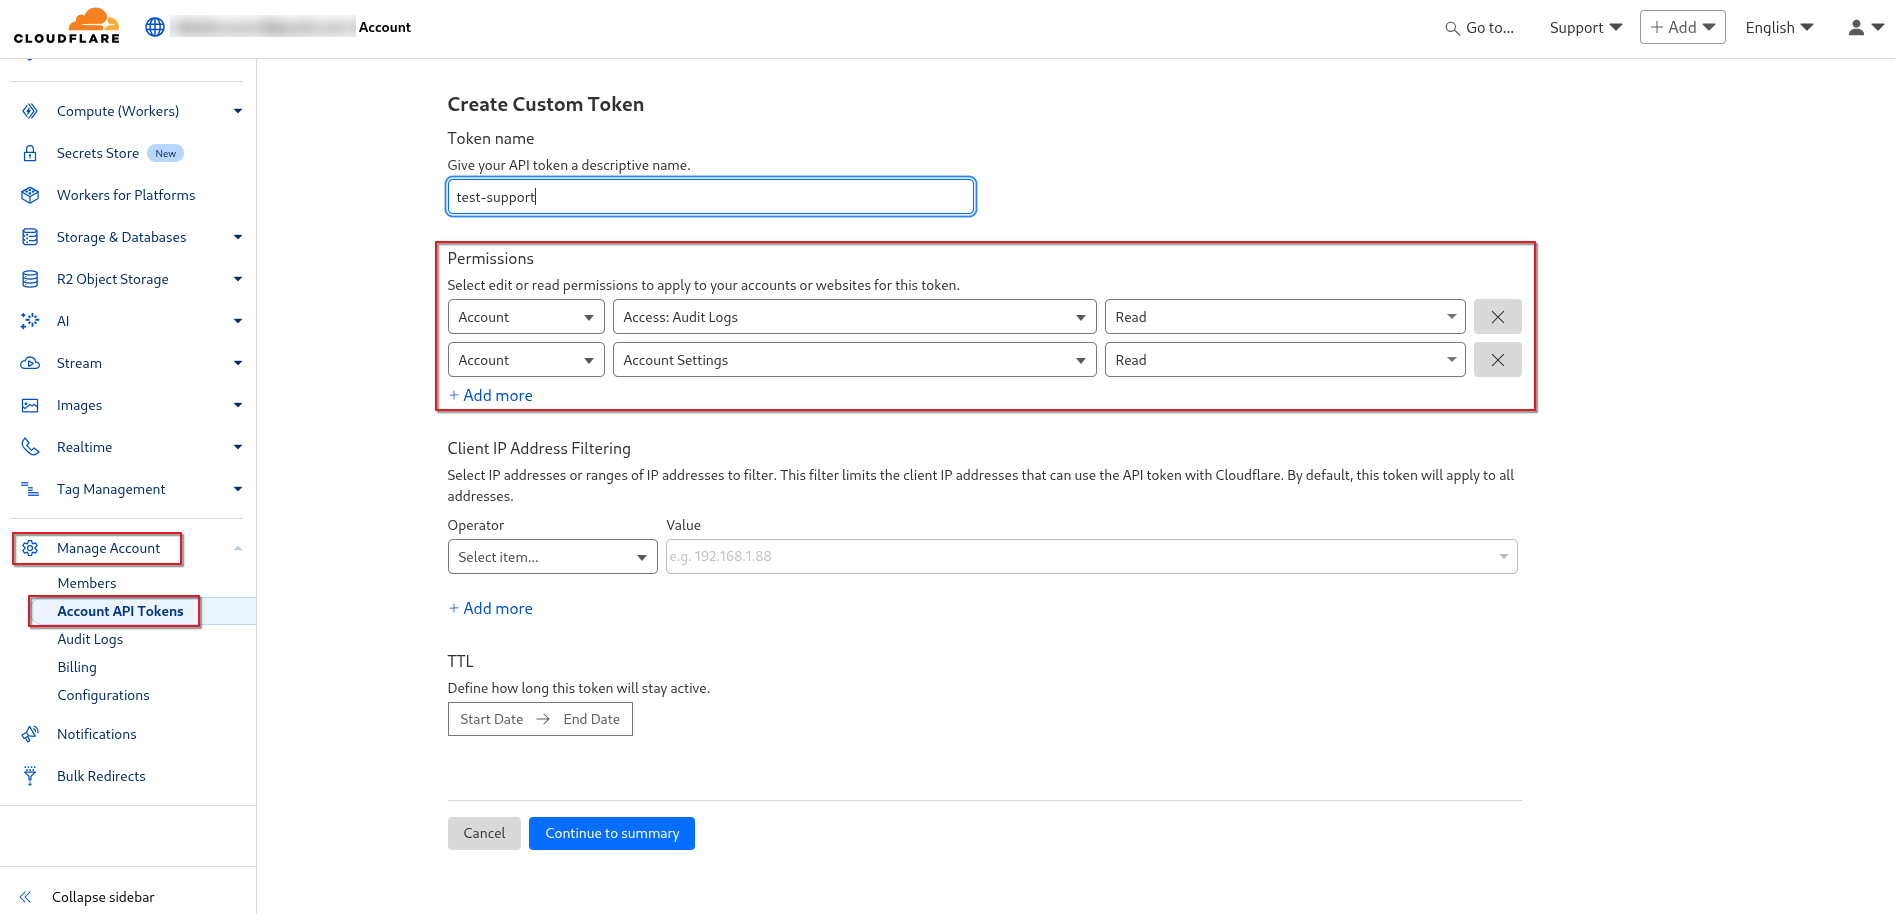
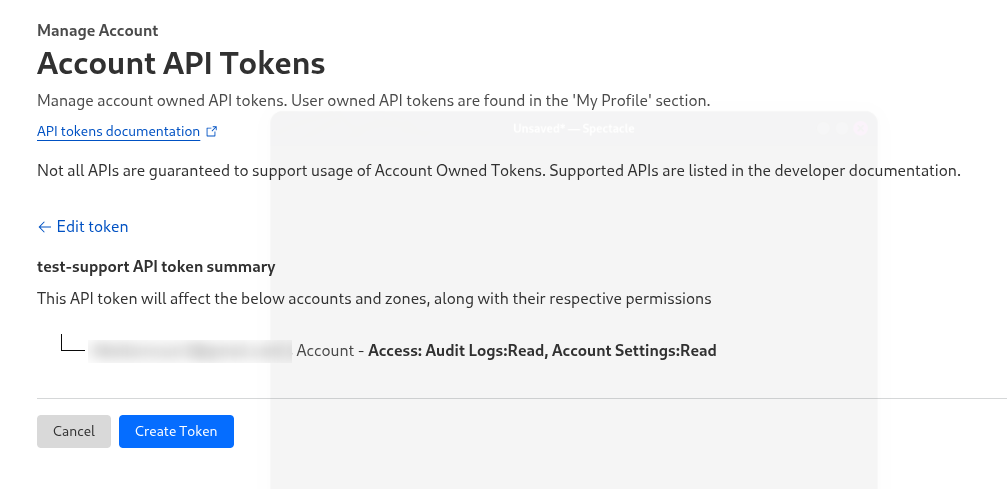
-
Account.Access:Audit Logs:Read Account.Account:Settings:Read
API Tokens are preferred for security as they support fine-grained access control. Create and manage tokens via the API Tokens dashboard.
Manage Account>Account API Tokens>Custom Token>Get Started
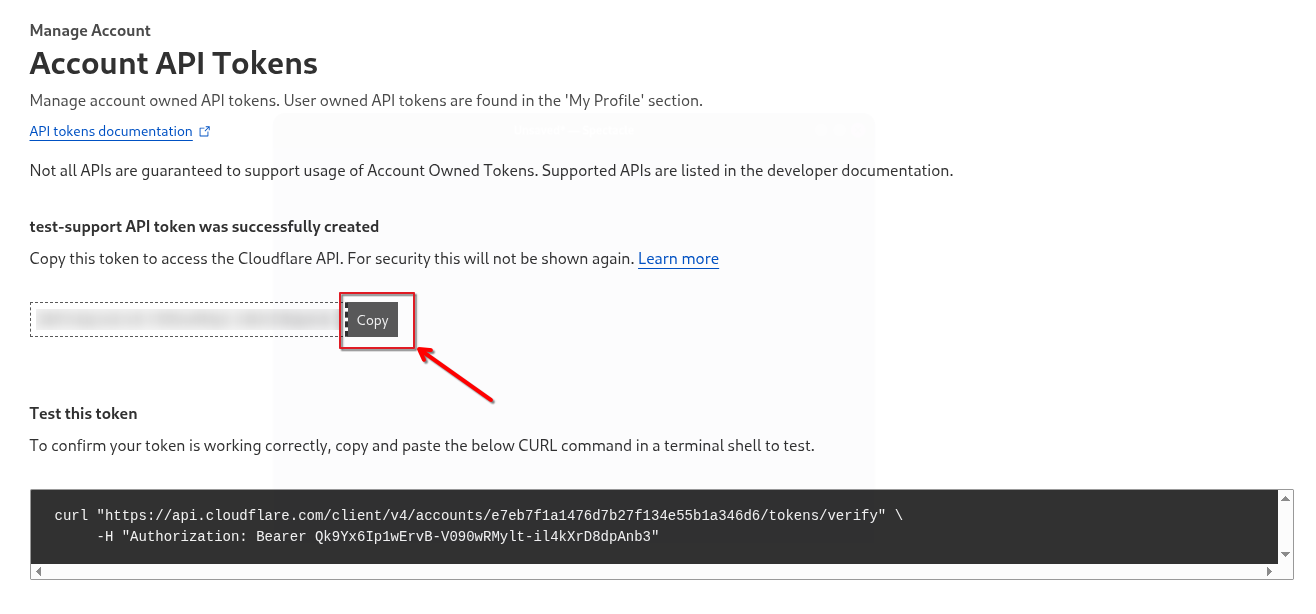
curl -X GET "https://api.cloudflare.com/client/v4/user/tokens/verify" \
  -H "Authorization: Bearer <token>" \
  -H "Content-Type: application/json"

Audit Logs
Audit logs provide a record of configuration changes within your Cloudflare account, including:
-
Logins/logouts
-
DNS setting changes
-
Modifications to Firewall, Caching, Page Rules, Speed, Network, and Traffic features
These logs are essential for tracking administrative activity and detecting unusual behavior.
To enable log collection from the Cloudflare API token, provide the following information to CyTech Support:
- Account ID
- API Token
If you need further assistance, kindly contact support@cytechint.com for prompt assistance and guidance.
NG SIEM - CrowdStrike Integration
CrowdStrike Integration
The CrowdStrike Falcon integration allows you to easily connect your CrowdStrike Falcon platform to Elastic for seamless onboarding of alerts and telemetry from CrowdStrike Falcon and Falcon Data Replicator. Elastic Security can leverage this data for security analytics including correlation, visualization and incident response
Requirements
API - Steps to Get Client ID and Client Secret in CrowdStrike Falcon (Recomended)
-
Log in to the Falcon Console
-
Use your admin credentials to log in.
-
Navigate to API Clients and Keys
-
Click on the "Support" (question mark icon) or your User avatar on the top right.
-
Select "API Clients and Keys" from the dropdown.
Alternatively, go to:https://falcon.crowdstrike.com/support/api-clients-and-keys
-
-
Create a New API Client
-
Click on “Add new API client”.
-
Name your client and optionally add a description.
-
Under API Scopes, select the required permissions based on what you need (e.g., read access to Hosts, Alerts, IOCs, etc.).
-
- Click Save
-
Copy the Client ID and Client Secret
-
After saving, the Client ID and Client Secret will be displayed once.
-
Copy them immediately and store them securely (e.g., in a password manager or secrets vault).
-
-
Token URL
Collect CrowdStrike Falcon Data Data Replicator Logs (input: aws-s3)
-
Log in with your CrowdStrike account
-
In the left menu, click Support & Resources → Falcon Data Replicator (or directly FDR Access)
-
You will immediately see a section called AWS-S3 (Option 1) with the three fields already filled in for your customer account:
- AWS: Access Key ID → copy this
- AWS: Secret Access Key → copy this (it’s shown only here; you can’t retrieve it again)
- AWS: Queue URL → copy this exact SQS URL
Please provide the following information to CyTech:
Collect CrowdStrike Falcon Data Replicator Logs (input: aws-s3)
- AWS: Access Key ID
- AWS: Secret Access Key
- AWS: Queue URL
API - Steps to Get Client ID and Client Secret in CrowdStrike Falcon
- Client ID: Client ID for the CrowdStrike.
- Client Secret: Client Secret for the CrowdStrike.
- URL: Token URL of CrowdStrike.
NG SIEM - GCP CSPM Integration
The Google Cloud integration collects and parses Google Cloud Audit Logs, VPC Flow Logs, Firewall Rules Logs, and Cloud DNS Logs that have been exported from Cloud Logging to a Google Pub/Subtopic sink and collects Google Cloud metrics and metadata from Google Cloud Monitoring.
Logs
- Firewall Logs: Record allowed and denied network traffic based on firewall rules.
- VPC Flow Logs: Capture IP traffic flowing to and from network interfaces in a VPC.
- DNS Logs: Track DNS queries and responses handled by Google Cloud DNS.
- Load Balancing Logs: Provide request-level logs of traffic handled by load balancers, including latency and backend info.
Metrics
-
GCP Billing Metrics: Track resource usage and cost across GCP services.
-
GCP Compute Metrics: Monitor performance of Compute Engine instances (CPU, memory, disk, etc.).
-
GCP Firestore Metrics: Provide insights into Firestore usage like reads, writes, and storage.
-
GCP Load Balancing Metrics: Measure load balancer traffic, request counts, latency, and backend health.
-
GCP Storage Metrics: Report usage, operation counts, and latency for Cloud Storage buckets.
-
GCP GKE Metrics: Monitor Kubernetes clusters including node health, pod usage, and resource consumption.
-
GCP Dataproc Metrics: Track job status, cluster usage, and Hadoop/Spark performance in Dataproc.
-
GCP PubSub Metrics: Show message throughput, subscription rates, and processing latency.
-
GCP Redis Metrics: Display memory usage, operations per second, and cache hit/miss rates for Memorystore Redis.
-
GCP Cloud Run Metrics: Measure request counts, container instance metrics, and response times.
-
GCP CloudSQL Metrics: Provide visibility into database performance, including connections, query latency, and CPU usage.
Authentication
To use the Google Cloud Platform (GCP) integration, the client must configure a Service Account (SA) that represents a non-human identity requiring access to GCP resources.
Service Account
First, you need to create a Service Account. A Service Account (SA) is a particular type of Google account intended to represent a non-human user who needs to access the GCP resources.
The AQUILA Agent uses the SA to access data on Google Cloud Platform using the Google APIs.
IAM Service Account Roles
For CSPM-GCP Integration
- Browser: Access to browse GCP resources.
- Cloud Asset Viewer: Read only access to cloud assets metadata
Logs Collection Configuration
The Logs Collection Configuration defines how log data is exported, transmitted, and processed within the system. It enables seamless integration between Cloud Logging and other Google Cloud services to ensure logs are efficiently collected, stored, and made available for analysis or monitoring.
Requirements
- Pub/Sub Topic: A Pub/Sub topic is a messaging channel that allows publishers to send messages asynchronously to multiple subscribers without them needing to know each other.
- Subscription: Subscriptions are named resources that receive messages on a particular topic. A subscriber client receives messages from a subscription and processes them.
- Log Sink: A log sink is a configuration that routes log entries from Cloud Logging to a chosen destination — such as Cloud Storage, BigQuery, or a Pub/Sub topic — for storage, analysis, or further processing.
It’s recommended to have a separate Pub/Sub topics for each of the log types so that they can be parsed and stored in a specific data stream.
Example Setup Using Google Cloud Console
Enable API Service
The client can enable their API through the APIs & Services section. To access it, click the ☰ (navigation menu) icon to open the sidebar, then hover over APIs & Services and select Enabled APIs & Services. Alternatively, the client can locate it using the search bar at the top of the page. Next, click Library, search for the required API services, and enable them.
- Cloud Asset API: Provides metadata inventory and history of GCP resources and IAM policies for security analysis, audit, and compliance.
- Cloud SQL Admin API: Enables programmatic management of Cloud SQL instances, including creation, configuration, and backups.
- Memorystore for Redis API: Allows automated management of Redis instances on Memorystore, including provisioning, scaling, and configuration.
Service Account Key
- Go to IAM & Admin > Service Accounts in the GCP Console.
- Click the service account you created.
- Under the "Keys" section, click "Add Key" > "Create new key".
- Choose JSON as the key type.
- Download and securely store the generated private key (it cannot be retrieved again from GCP if lost).
Please provide the following information to CyTech:
-
Project ID - The Project ID is the Google Cloud project ID where your resources exist.
-
Credentials File - Save the JSON file with the private key in a secure location of the file system, and make sure that the Log Collector Agent has at least read-only privileges to this file. Specify the file path in the Log Collector Agent integration UI in the "Credentials File" field. For example: /home/ubuntu/credentials.json.
-
Pub/Sub Topic - Name of the topic where the logs are written to.
-
Subscription - Use the short subscription name here, not the full-blown path with the project ID. You can find it as "Subscription ID" on the Google Cloud Console.
If you need further assistance, kindly contact support@cytechint.com for prompt assistance and guidance.
NG SIEM - GCP Integration
Google Cloud Platform (GCP) is Google’s suite of cloud computing services that lets businesses and developers build, deploy, and scale applications on Google’s infrastructure. It offers a wide range of services, including computing power (like virtual machines and Kubernetes), storage, databases, machine learning, networking, and analytics. GCP is known for its global reliability, security, and integration with Google’s data and AI tools, making it suitable for everything from simple websites to complex enterprise applications.
Authentication
To use the Google Cloud Platform (GCP) integration, the client must configure a Service Account (SA) that represents a non-human identity requiring access to GCP resources.
Service Account
First, you need to create a Service Account. A Service Account (SA) is a particular type of Google account intended to represent a non-human user who needs to access the GCP resources.
The AQUILA Agent uses the SA to access data on Google Cloud Platform using the Google APIs.
IAM Service Account Roles
For GCP Integration
- Cloud Memorystore Redis Viewer: Read-only access to Redis instances and related resources.
- Cloud SQL Viewer: Read-only access to Cloud SQL resources.
- Compute Viewer: Read-only access to get and list information about all Compute Engine resources, including instances, disks, and firewalls. Allows getting and listing information about disks, images, and snapshots, but does not allow reading the data stored on them.
- Logs Viewer: Access to view logs, except for logs with private contents.
- Monitoring Viewer: Read-only access to get and list information about all monitoring data and configuration.
- Private Logs Viewer: Access to view all logs, including logs with private contents.
- Pub/Sub Subscriber: Consume messages from a subscription, attach subscriptions to a topic, and seek to a snapshot.
- Service Account Key Admin: Create and manage (and rotate) service account keys.
- Viewer: View most Google Cloud resources. See the list of included permissions.
NG SIEM - GitHub Integration
Introduction
Elastic’s GitHub integration allows you to ingest GitHub logs, alerts, and developer activities into the Elastic Stack for centralized analysis. This supports use cases like vulnerability management, compliance auditing, and DevSecOps monitoring.
Note: This integration is only compatible with GitHub Enterprise Cloud and is not supported on GitHub Enterprise Server.
Option 1: GitHub Audit Logs
Description:
Audit logs contain records of all administrative and security events within a GitHub organization.
Requirements
-
GitHub Enterprise Cloud
-
You must be an organization owner
-
Use a Personal Access Token (PAT) with
read:audit_logscope
What It Does
-
Captures repository creation, permission changes, team updates, and more
-
Helps detect suspicious or non-compliant behavior
Setup Steps
-
Create a PAT
-
Go to GitHub → Developer Settings → Personal Access Tokens
-
Click "Generate new token"
-
Select
read:audit_logscope -
Save the token securely
-
-
Configure Integration in Elastic
-
Navigate to Integrations in Kibana
-
Search for "GitHub" and click "Add GitHub integration"
-
Select the "Audit Logs" data stream
-
Enter your organization name and paste your PAT
-
-
Test and Deploy
-
Click "Test integration" to verify connectivity
-
Choose a data stream name and index settings
-
Click "Save and Deploy"
-
-
Verify in Kibana
-
Navigate to Discover
-
Use the index pattern
logs-github.audit-* -
Filter using fields such as
actor,action, orcreated_at
-
Option 2: Code Scanning Alerts
Description:
Collect static code analysis results from GitHub Advanced Security Code Scanning.
Requirements
-
Code Scanning must be enabled per repository
-
Use either:
-
GitHub App with
security_eventsread permission -
PAT with:
-
security_events(for private repositories) -
public_repo(for public repositories)
-
-
What It Does
-
Ingests vulnerabilities and insecure code patterns
-
Supports SARIF format scan results
Setup Steps
-
Enable Code Scanning in GitHub
-
Go to your repository → Security → Code scanning alerts
-
Enable GitHub Advanced Security
-
Configure workflows such as CodeQL
-
-
Generate PAT or GitHub App
-
If using a PAT, ensure it includes
security_eventsorpublic_reposcope
-
-
Configure Integration in Elastic
-
Open Integrations in Kibana
-
Add GitHub integration and select "Code Scanning"
-
Input organization name and credentials
-
-
Test and Configure
-
Test the integration
-
Set polling frequency (e.g., every 5 minutes)
-
Save and deploy
-
-
Monitor in Kibana
-
Use Discover with the index pattern
logs-github.code_scanning-* -
Filter by fields such as
severity,rule_id, orrepository.name
-
Option 3: Secret Scanning Alerts
Description:
Detect and alert on exposed secrets in source code repositories.
Requirements
-
Secret Scanning must be enabled in repository settings
-
You must be a repository or organization administrator
-
Use either:
-
GitHub App with
secret_scanning_alertsread permission -
PAT with:
-
repoorsecurity_events(for private repos) -
public_repo(for public repos)
-
-
What It Does
-
Flags exposed API keys, tokens, and credentials
-
Helps prevent credential leaks
Setup Steps
-
Enable Secret Scanning
-
Go to GitHub repo → Settings → Code Security and Analysis
-
Enable "Secret scanning alerts"
-
-
Generate Access
-
Create a PAT with appropriate scopes
-
Or set up a GitHub App with necessary permissions
-
-
Configure in Elastic
-
Go to the GitHub integration in Kibana
-
Enable the "Secret Scanning" stream
-
Provide token and repository/org details
-
-
Test and Save
-
Test the connection
-
Select desired polling interval (e.g., 10 minutes)
-
Save and deploy
-
-
Analyze Alerts
-
Open Discover and use
logs-github.secret_scanning-* -
Use filters such as
alert_type,secret_type, andstate
-
Option 4: Dependabot Alerts
Description:
Monitor dependency vulnerabilities in GitHub repositories using Dependabot.
Requirements
-
Dependabot must be enabled in repository settings
-
You must be a repository or organization administrator
-
Use either:
-
GitHub App
-
PAT with:
-
repo,security_events, orpublic_reposcope
-
-
What It Does
-
Identifies and alerts on known insecure packages
-
Includes CVE metadata and suggested fixes
Setup Steps
-
Enable Dependabot in GitHub
-
Go to Repository → Settings → Code Security and Analysis
-
Enable "Dependency Graph" and "Dependabot alerts"
-
-
Generate GitHub App or PAT
-
Ensure scopes include
repo,security_events, orpublic_repo
-
-
Configure in Elastic
-
Go to GitHub integration
-
Enable "Dependabot"
-
Enter org/repo and credentials
-
-
Test and Deploy
-
Test the integration
-
Select polling interval
-
Save settings
-
-
Monitor in Kibana
-
Use Discover →
logs-github.dependabot-* -
Filter by
dependency_name,ecosystem,severity, etc.
-
Option 5: Issues & Pull Requests
Description:
Ingest GitHub issues, pull requests, comments, labels, milestones, and other metadata.
Requirements
-
Use a GitHub App or PAT with:
-
repo(for private repositories) -
public_repo(for public repositories) -
Optional:
read:orgfor org-wide access
-
What It Does
-
Collects all issue and PR activity
-
Enables filtering of pull requests with
github.issues.is_pr = true
Setup Steps
-
Create or Use PAT / GitHub App
-
Ensure appropriate access to repositories
-
-
Enable GitHub Integration in Elastic
-
Choose "Issues" as the data stream
-
Enter credentials and repository/organization name
-
-
Customize Settings
-
Set state filter (e.g.,
state=openfor open issues only) -
Configure sync interval
-
-
Test and Activate
-
Verify GitHub API connectivity
-
Deploy integration
-
-
View Data in Kibana
-
Go to Discover →
logs-github.issues-* -
Use filters such as
assignees,labels,state, oris_pr
-
Comparison Table
| Feature | GitHub App | PAT Support | Required Scopes | Public Repos | Private Repos |
| Audit Logs | No | Yes | read:audit_log |
No | Yes |
| Code Scanning | Yes | Yes |
|
Yes | Yes |
| Secret Scanning | Yes | Yes | repo, security_events, public_repo |
Yes | Yes |
| Dependabot | Yes | Yes | repo, security_events, public_repo |
Yes | Yes |
| Issues & PRs | Yes | Yes | repo, public_repo, read:org |
Yes | Yes |
Documentation References
- Elastic GitHub Integration: CyTech Docs
- GitHub Official Docs:
If you need further assistance, kindly contact our support at support@cytechint.com for prompt assistance and guidance.
NG SIEM - GoogleWorkspace Integration
Introduction
The Google Workspace integration collects and parses data from various Google Workspace audit reports APIs using a service account authorized via the Admin SDK API.
Requirements
To ingest data from the Google Reports API, the following must be completed:
-
An administrator account in Google Workspace.
-
Enable the Admin SDK API in GCP.
-
Create and configure a Service Account.
-
Enable Domain-Wide Delegation for the service account.
-
Configure the OAuth Consent Screen.
Note this is only applicable for Administrator Account in Google Workspace. Thank you and have a nice day.
Enable Admin SDK API
Complete the following steps:
- Select the Google Cloud navigation menu > APIs & Services > Enabled APIs & Services
- Search and enable “Admin SDK API” from the API library page
Configure OAuth Consent Screen
Complete the following steps:
- Select the Google Cloud navigation menu > APIs & Services > Enabled APIs & Services > OAuth Consent Screen
- User Type > Internal > Create
- Fill out the following information in subsequent steps
- App name:
- User support email:
- Authorized domains:
- Developer contact information:
- Save and Continue
- Save and Continue
- Back to Dashboard
Create a Service Account
To create a service account, do the following:
Enable Domain-wide Delegation
- In your GW Admin Console select > Navigation Menu > Security > Access and data control > API controls
- Select Manage Domain Wide Delegation > Add New
- Client ID: OAuth ID from Service Account in GCP
- Google Cloud Console > IAM & Admin > Service Accounts > OAuth 2 Client ID (copy to clipboard)
- OAuth Scopes: https://www.googleapis.com/auth/admin.reports.audit.readonly
Please provide the following information to CyTech Support. Thank you
- Delegated Account - the email of the administrator account, and not the email of the ServiceAccount.
- Jwt JSON - The JSON credentials file downloaded from GCP. Raw contents of the JWT file. Useful when hosting a file along with the agent is not possible. NOTE: Please use either JWT File or JWT JSON parameter.
Reference link: https://www.elastic.co/security-labs/google-workspace-attack-surface-part-two
If you need further assistance, kindly contact our support at support@cytechint.com for prompt assistance and guidance.
NG SIEM - Microsoft 365 Integration
Overview
This integration with Microsoft Office 365 supports the ingestion of user, administrator, system, and policy-related events. It leverages the Office 365 Management Activity API to retrieve activity logs from both Office 365 and Azure Active Directory (Azure AD).
This guide outlines the required steps to integrate with Microsoft Office 365 and Azure AD using the Office 365 Management Activity API. It covers application registration, permission setup, audit log configuration, and retrieval of key credentials for secure API access.
Requirements
Summary of Actions Required:
-
Register an Application in Microsoft Entra ID (formerly Azure AD) to establish identity and enable API access.
-
Configure API Permissions for Microsoft Graph and Office 365 Management APIs to authorize required data access.
-
Grant Admin Consent to ensure permissions are applied tenant-wide.
-
Collect Key Credentials such as Application ID, Tenant ID, and Client Secret for use in your integration.
-
Verify if Unified Audit Logging is Enabled in Microsoft 365 to ensure activity data is available via the API.
Action Items Before Proceeding:
-
Ensure you have Global Admin access to your Azure/Microsoft 365 tenant.
-
Prepare to create or use an existing App Registration in Microsoft Entra ID.
-
Confirm that Unified Audit Logging is enabled; otherwise, prepare to activate it via the Microsoft 365 portal or PowerShell.
-
Take note of your admin email address for PowerShell commands if using CLI to manage audit log settings.
Steps to Configure Office 365 Integration for the Client
Step 1: Microsoft Entra ID - App Registration
Register Your Application in Microsoft Entra ID:
- Log in to your Azure Account, click here - Azure Portal Link.
-
Navigate to Azure Active Directory > App registrations.
-
Click New Registration.
-
Provide a Name for the application, we can suggest "CyTechAQUILA-Monitoring".
-
Click Register.
Step 2: API Permissions
Microsoft Graph API Permissions:
If User.Read permission under Microsoft Graph tile is not added by default, add this permission.
Office 365 Management API Permissions:
- Search for Office 365 Management APIs and add the required permissions.
-
In Application Permissions, look for permissions.
-
Under ActivityFeed select: ActivityFeed.Read
-
Optionally, select ActivityFeed.ReadDLP to read DLP policy events.
Grant Admin Consent:
- In API Permissions, click Grant admin consent for <tenant name>.
-
Confirm the action.
Step 3: Integration Requirements for Office 366
Application (Client) ID:
- Go to App registrations > Select your application.
-
Copy the Application (client) ID from the overview page.
Directory (Tenant) ID:
- In the Azure Portal, navigate to Azure Active Directory > Overview.
-
Copy the Directory (tenant) ID.
Create New Client Secret (Value):
- In App registrations > Select your application, go to Certificates & secrets.
-
Click New client secret.
-
Add a description and expiration period, then click Add.
-
Copy the Value (displayed only once).
Step 4: Verify Unified Audit Logging is Enabled
Unified Audit Logging must be enabled before accessing data via the Office 365 Management Activity API.
Method 1: Using Microsoft 365 Security & Compliance Center
-
Sign in to Microsoft 365:
-
Go to https://admin.microsoft.com and sign in with your Global Admin credentials.
-
-
Access the Security & Compliance Center:
-
In the left-hand menu, under Admin centers, click on Security (or go directly to https://security.microsoft.com).
-
-
Navigate to Audit Log Search:
-
In the Security & Compliance Center, go to Search in the left-hand menu and click on Audit log search.
-
-
Check Audit Log Status:
-
If you see an option to search the audit log, then audit logging is already enabled.
- If you see a banner that says "Start recording user and admin activity" or a prompt to enable auditing, it means that audit logging is not yet enabled.
-
-
Enable Audit Logging:
-
If audit logging is not enabled, you can click on the prompt to enable it. This will enable auditing for all activities within your Microsoft 365 environment. The process may take a few hours to be fully operational.
-
Please provide the following information to CyTech:
- Directory (tenant) ID:
- Application (client) ID:
-
Client Secret Value:
NG SIEM - Mimecast Integration
Introduction
The Mimecast integration collects events from the Mimecast API.
Agentless integrations allow you to collect data without having to manage Elastic Agent in your cloud. They make manual agent deployment unnecessary, so you can focus on your data instead of the agent that collects it. For more information, refer to Agentless integrations and the Agentless integrations FAQ. Agentless deployments are only supported in Elastic Serverless and Elastic Cloud environments. This functionality is in beta and is subject to change. Beta features are not subject to the support SLA of official GA features.
Requirements
- API URL
- Client ID
- Client Secret
Creating an API 2.0 Application:
- Log in to Mimecast Administration Console
- Navigate to Integrations | API and Platform Integrations
- Locate the following Mimecast API 2.0 tile and click on Generate Keys.
-
After reading the Terms & Conditions, complete the I accept check box to enable the Next button to progress onto the next step.
-
Complete the Application Details section.
We highly recommend creating a dedicated custom role with only the permissions required for the Application to function.
Select the minimum set of Products the App needs to access to function.
- Should we need to contact you regarding this API application, please provide details for a Technical Point of Contact.
Mimecast recommends a group rather than an individual contact.
- Review the Summary information for the API application and click on Add if you are happy to proceed with creating the application.
-
The wizard completes and displays a pop-up window including your Client ID and Client Secret key data, where you can copy and save the credentials for the API application.
Base URL (Mimecast API v2)
To transition from your current API 1.0 URLs to API 2.0, we provide three API gateway options tailored to fulfill your performance, compliance, and data residency requirements:
- Global URL: The global API URL api.services.mimecast.com which serves traffic from the nearest instance ensuring reduced latency and enhanced performance.
- UK Instance URL: For compliance and data residency requirements, customers can choose to process traffic via the UK instance using the regional URL: uk-api.services.mimecast.com. This ensures API traffic is only processed within the UK instance of the Apigee Gateway.
- US Instance URL: Similarly, customers with compliance or residency requirements in the US can use us-api.services.mimecast.com to process API traffic exclusively through the US instance of the Apigee Gateway.
Please provide the following information to CyTech Support. Thank you
- API URL
- Client ID
- Client Secret
If you need further assistance, kindly contact our support at support@cytechint.com for prompt assistance and guidance.
NG SIEM - Salesforce Integration via JWT Authentication
Introduction
The Salesforce integration enables you to monitor your Salesforce instance. Salesforce is a customer relationship management (CRM) platform that supports businesses in managing marketing, sales, commerce, service, and IT teams from a unified platform accessible from anywhere.
Recommendation - Username / Password Authentication Integration
Create New User Account
- Go to Home page of Salesforce and click Setup in the top right menu bar.
- In the left side you will see a Quick Find search textbox, type Users.
- Click Users and it will redirect you to the Users setup page.
- Click New User button and fill up the form:
- First Name
- Last Name
- Set User License to "Salesforce"
- Choose an appropriate Profile (see below)
- Profile and Permission Set Configuration
- Create a custom profile or clone an existing minimal profile:
- Clone the "Standard User" profile and name it something like "Log Extraction Service" or whatever you prefer.
- Remove unnecessary permissions, keeping only:
- API Enabled
- View Setup and Configuration
- Specific object permissions for logs you need to extract
- Essential permissions for log extraction:
- API Enabled - Required for programmatic access
- View All Data - If you need comprehensive log access
- Read access to specific objects containing log data
- API Enabled - Required for programmatic access
- Create a custom profile or clone an existing minimal profile:
- Profile and Permission Set Configuration
- Scroll down to the bottom and check the box that says Generate new password and notify user immediately.
- Click Save.
- Open the account and set a new password.
Please take note of the Email Address, Username and Password associated with this account, as they will be required during the API and integration setup process.
Salesforce instance URL
This is the URL of your Salesforce Organization.
-
Salesforce Classic: Given the example URL https://na9.salesforce.com/home/home.jsp, the Salesforce Instance URL is extracted as https://na9.salesforce.com.
-
Salesforce Lightning: The instance URL is available under your user name in the View Profile tab. Use the correct instance URL in case of Salesforce Lightning because it uses *.lightning.force.com but the instance URL is *.salesforce.com.
Ensure the Instance URL is noted, as it will be used in both API creation and integration steps.
Client Key and Client Secret for Authentication
To use this integration, you need to create a new Salesforce Application using OAuth. Follow these steps to create a connected application in Salesforce:
-
Log in to Salesforce with the user credentials you want to collect data with.
-
Click Setup in the top right menu bar.
- In the Quick Find textbox, search for App Manager or you can scroll down to PLATFORM TOOLS and select App Manager.
- In the upper right corner, choose the New External Client App.
-
Provide a name for the connected application. This name will be displayed in the App Manager and on its App Launcher tile.
-
Enter the API name. The default is a version of the name without spaces. Only letters, numbers, and underscores are allowed. If the original app name contains any other characters, edit the default name.
-
Enter the email address of the new account you created earlier.
-
Under the API (Enable OAuth Settings) section, check the box for Enable OAuth Settings.
-
In the Callback URL field, enter the instance URL as specified in Salesforce instance URL. Example URL: https://na9.salesforce.com
-
Select the following OAuth scopes to apply to the connected app:
-
Manage user data via APIs (api)
-
Perform requests at any time (refresh_token, offline_access)
-
(Optional) If you encounter any permission issues during data collection, add the Full access (full) scope.
-
- Select Require Secret for the Web Server Flow to require the app's client secret in exchange for an access token.
-
Select Require Secret for Refresh Token Flow to require the app's client secret in the authorization request of a refresh token and hybrid refresh token flow.
- Then scroll up above the Callback URL on the App Settings you will see the Consumer Key and Secret button, click it.
- It will create another tab. Verify the user account by entering the Verification Code.
- Copy the
Consumer KeyandConsumer Secretfrom the Consumer Details section. These values should be used as the Client ID and Client Secret, respectively, in the integration. - Close that tab and go back to the External Client App Manager. Click Save.
Username
- Provide the Username of the new account that you created earlier.
Password
- Please provide the password you set upon accessing the new account.
Note: When using a Salesforce instance with a security token, append the token directly to your password without spaces or special characters. For example, if your password is Password and your security token is 12345 enter: Pasword12345
Token URL:
- Use the token URL to obtain authentication tokens for API access.
- For most Salesforce instances, the token URL follows this format: https://login.salesforce.com/services/oauth2/token.
- If you're using a Salesforce sandbox environment, use https://test.salesforce.com/services/oauth2/token instead.
- For custom Salesforce domains, replace
login.salesforce.comwith your custom domain name. For example, if your custom domain ismycompany.my.salesforce.com, the token URL becomes https://mycompany.my.salesforce.com/services/oauth2/token. This applies to Sandbox environments as well. - In the Salesforce integration, we internally append
/services/oauth2/tokento the URL. Make sure that the URL you provide in the Salesforce integration is the base URL without the/services/oauth2/tokenpart. For example, if your custom domain ismycompany.my.salesforce.com, the complete token URL would be https://mycompany.my.salesforce.com/services/oauth2/token, but the URL you provide in the Salesforce integration should be https://mycompany.my.salesforce.com. In most cases, this is the same as the Salesforce instance URL.
NOTE: Salesforce Lightning users must use URL with *.salesforce.com domain (similar to the Salesforce instance URL) instead of *.lightning.force.com because the Salesforce API does not work with *.lightning.force.com.
API Version
To find the API version:
-
Go to the search textbox and type Api Version. Click the first Api Version on the list.
Reference: https://www.integrate.io/blog/salesforce-rest-api-integration/
Please provide these credentials and send it to CyTech Support:
-
Salesforce instance URL
-
Client key and client secret for authentication
-
Username
-
Password
-
Token URL
-
API version (Optional)
Recommendation - JWT Integration
This guide provides a step-by-step process for setting up a secure integration between Salesforce and AQUILA. The focus is on using JWT (JSON Web Token) Bearer authentication, which is recommended for server-to-server communication as it avoids sharing passwords. We'll cover preparing Salesforce (where you generate and upload required credentials) and entering those into AQUILA configuration fields.
Prerequisites
- Salesforce Account: Admin access to create users and apps. Ensure your org supports API access (most do).
- AQUILA Setup: Access to Aquila (for managed agents).
- Tools Needed: OpenSSL (free, install via your OS: e.g., apt install openssl on Linux, or download for Windows/Mac).
- Dedicated Integration User: Create a Salesforce user specifically for this (not your personal account) with minimal permissions:
- License: Salesforce Integration (API-only).
- Permissions: "API Enabled" (required); add "View Event Log Files" if ingesting logs.
Create a Connected App in Salesforce
This app generates the Client ID and links your certificate for JWT trust.
- Log in to Salesforce > Click the gear icon > Setup.
- Search for Setup > External Client Apps> Enable and click button New Connected Apps.
- Fill in:
- Connected App Name: e.g., "AQUILA JWT Integration".
- API Name: Auto-fills (edit if needed).
- Contact Email: Your integration user's email.
- Under API (Enable OAuth Settings):
- Check Enable OAuth Settings.
- Callback URL: Enter http://localhost (placeholder; not used in JWT).
- Selected OAuth Scopes: Add api, refresh_token, offline_access. (Optional: Add full for broader access if needed.)
- Check Use digital signatures > Upload salesforce_cert.crt.
- Do not check any "Require Secret" options (no secret needed for JWT).
- Click Save (wait 2-10 minutes for activation).
- On the app page, copy the Consumer Key—this is your Client ID.
- Click Manage > Edit Policies > Set Permitted Users to "Admin approved users are pre-authorized".
- Assign the app to your integration user: Under Profiles or Permission Sets, add your user's profile.
Now Salesforce is ready—note your Instance URL (e.g., from your Salesforce homepage: https://your-instance.my.salesforce.com).
Please provide these credentials and send it to CyTech Support:
-
Username
-
Client ID
-
JWT Authentication Audience URL
-
JWT Authentication Client Key Path
Summary Table
| Field | Username–Password | JWT |
|---|---|---|
| Client ID | ✔ required | ✔ required |
| Client Secret | ✔ required | ❌ not used |
| Username | ✔ required | ✔ required |
| Password | ✔ required | ❌ not used |
| Private Key Path | ❌ | ✔ required |
| Audience URL | ❌ | ✔ required |
| Token URL | ✔ required | ❌ leave blank |
| API Version | optional | optional |
If you need further assistance, kindly contact our support at support@cytechint.com for prompt assistance and guidance.
NG SIEM - Sophos Central Integration
Sophos Central Integration
The Sophos Central integration allows you to monitor Alerts and Events logs. Sophos Central is a cloud-native application with high availability. It is a cybersecurity management platform hosted on public cloud platforms. Each Sophos Central account is hosted in a named region. Sophos Central uses well-known, widely used, and industry-standard software libraries to mitigate common vulnerabilities.
Use the Sophos Central integration to collect logs across Sophos Central managed by your Sophos account. Visualize that data in Kibana, create alerts to notify you if something goes wrong, and reference data when troubleshooting an issue.
Step-by-Step: How to Get Your Sophos Central API Credentials (Client ID, Client Secret, Tenant ID, Request URL)
-
-
Log in to Sophos Central Admin Open your browser and go to: https://central.sophos.com Log in with your admin account.
-
Go to API Credentials Manager On the left sidebar, click Global Settings (gear icon at the bottom). Then click API Credentials Manager.
-
Create a new credential Click the blue button + Add Credential (top right).
-
Fill in the details
- Name: Give it a clear name (e.g., “PowerShell Automation”, “SIEM Integration”, “My Script 2025”)
- Role: Choose the role that matches what you need (usually “Admin” or “Read-Only” is fine)
- Click Save (or Add)
-
Copy the four pieces of information immediately A new window/pop-up will appear showing:
What you need Value shown in the portal Action Client ID Long string (e.g., 12345678-abcd-1234-efgh-1234567890ab) Copy it Client Secret Long secret key COPY THIS NOW – it will never be shown again! Tenant ID (Customer ID) GUID like a1b2c3d4-e5f6-7890-g1h2-i3j4k5l6m7n8 Copy it Request URL Use the Whoami endpoint first: Always use this URL first: https://api.central.sophos.com/whoami/v1 → Click Copy buttons or select + Ctrl+C for each field. → Paste everything into a secure password manager or your script immediately.
-
Close the window Once you’ve copied everything, click Done or close the pop-up.
-
Please provide the following information to CyTech:
- Client ID:
- Client Secret:
- Tenant ID:
- Request URL:
NG SIEM- AWS CSPM Integration
Introduction
CSPM discovers and evaluates the services in your cloud environment, like storage, compute, IAM, and more, against hardening guidelines defined by the Center for Internet Security (CIS) to help you identify and remediate configurations risks like:
- Publicly exposed storage buckets
- IAM Users without MFA enabled
- Networking objects that allow ingress to remote server administration ports (22, 3389, etc.)
Recommendation
The CSPM integration requires access to AWS’s built-in SecurityAudit IAM policy in order to discover and evaluate resources in your cloud account. To provide access we need:
- IAM Role
- Direct access keys
Follow AWS’s IAM roles for Amazon EC2 documentation to create an IAM role using the IAM console, which automatically generates an instance profile.
-
Create an IAM role:
- In AWS, go to your IAM dashboard. Click Roles, then Create role.
- On the Select trusted entity page, under Trusted entity type, select AWS service.
-
Under Use case, select EC2. Click Next.
- On the Add permissions page, search for and select
SecurityAudit. Click Next. - On the Name, review, and create page, name your role, then click Create role.
-
Attach your new IAM role to an EC2 instance:
- In AWS, select an EC2 instance.
-
Select Actions > Security > Modify IAM role.
- On the Modify IAM role page, search for and select your new IAM role.
- Click Update IAM role.
-
Create Direct access keys
Access keys are long-term credentials for an IAM user or AWS account root user. To use access keys as credentials, you must provide the
Access key IDand theSecret Access Key. After you provide credentials, finish manual setup.For more details, refer to Access Keys and Secret Access Keys.
Access key ID: The first part of the access key.Secret Access Key: The second part of the access key.
Please provide the following information to CyTech:
- Access Key ID
- Secret Access Key
NG SIEM – LastPass Integration
Overview
The LastPass Elastic Integration allows the ingestion of data from the LastPass Admin Console for enhanced monitoring and reporting.
This integration collects three main data streams:
These logs help monitor password management activities, access permissions, and user behavior for compliance and auditing purposes.
Prerequisites
Before configuring the integration, ensure that the following components and credentials are available.
LastPass Business Account
A LastPass Business account is required to use this integration.
Free or personal accounts are not supported.
Elastic Stack Requirements
- Elasticsearch – Required to store and index collected data.
- Kibana – Required to visualize and manage data streams.
You can use Elastic Cloud (recommended) or a self-managed Elastic Stack deployment.
API Credentials
Two key credentials are required for Elastic to access the LastPass API:
- Account Number (CID)
- Found in the Admin Console → Dashboard tab.
- Displayed at the top of the page, preceded by the label “Account Number”.

- Provisioning Hash
- Go to Admin Console → Advanced → Enterprise API.
- If no hash exists: click Create provisioning hash → OK.
- If forgotten: click Reset your provisioning hash → OK to generate a new one.
- Important: Resetting invalidates the previous hash, requiring reconfiguration in all connected integrations.



Keep both the CID and Provisioning Hash secure. These credentials grant access to your organization’s LastPass data.
Integration Configuration
1. Access the Integrations Page
2. Input Connection Settings
Under Configure integration, fill in the required fields:
-
Account Number:
- Enter the LastPass Business Account Number (CID) found in your LastPass Admin Console → Dashboard tab, at the top of the page.
-
Provisioning Hash:
- Enter the Provisioning Hash generated in Admin Console → Advanced → Enterprise API. This serves as the API secret used for authentication.
-
URL:
- Default API endpoint for LastPass Enterprise integration. This is automatically pre-filled in most cases.
3. Select Data Streams
Enable the data streams you want to collect. It can be enabled or disable specific data streams based on visibility needs:
4. Save and Deploy
Once all required fields are configured:
- Click Save and continue
- Assign the integration to your Elastic Agent policy
- Confirm deployment
Notes
- The integration only supports LastPass Business accounts via the Enterprise API.
- The Provisioning Hash must be updated in Elastic whenever it is regenerated in LastPass.
- Multifactor authentication may be required to access the Admin Console.
- The LastPass API does not manage pre-configured SSO (Cloud) app groups, these remain outside integration scope.
If you need further assistance, kindly contact support@cytechint.com for prompt assistance and guidance.
NG SIEM - Apache Tomcat
NG SIEM - Microsoft Defender ATP Logs
Prerequisite
Before starting, ensure you have the following ready:
|
Item |
Details |
|
OS |
Windows 10 / Windows Server 2016 or later |
|
Privileges |
Local Administrator access on the machine |
|
Network |
Outbound HTTPS (port 443) to our Elastic endpoint |
Step 1. Connect local Kibana to a Cloud instance
If you are running this Kibana instance against a hosted Elasticsearch instance, proceed with manual setup.
Save the Elasticsearch endpoint as <es_url> and the cluster Password as <password> for your records
Step 2. Download and install Filebeat
First time using Filebeat? See the Quick Start.
- Download the Filebeat Windows zip file from the Download page.
- Extract the contents of the zip file into
C:\Program Files. - Rename the
filebeat-9.2.0-windowsdirectory toFilebeat. - Open a PowerShell prompt as an Administrator (right-click the PowerShell icon and select Run As Administrator). If you are running Windows XP, you might need to download and install PowerShell.
- From the PowerShell prompt, run the following commands to install Filebeat as a Windows service.
cd "C:\Program Files\Filebeat"
.\install-service-filebeat.ps1
Modify the settings under output.elasticsearch in the C:\Program Files\Filebeat\filebeat.yml file to point to your Elasticsearch installation.
Step 3. Edit the configuration
Modify C:\Program Files\Filebeat\filebeat.yml to set the connection information:
output.elasticsearch:
  hosts: ["<es_url>"]
  username: "elastic"
  password: "<password>"
  # If using Elasticsearch's default certificate
  ssl.ca_trusted_fingerprint: "<es cert fingerprint>"
setup.kibana:
  host: "<kibana_url>"
Where <password> is the password of the elastic user, <es_url> is the URL of Elasticsearch, and <kibana_url> is the URL of Kibana. To configure SSL with the default certificate generated by Elasticsearch, add its fingerprint in <es cert fingerprint>.
Important: Do not use the built-in
elasticuser to secure clients in a production environment. Instead set up authorized users or API keys, and do not expose passwords in configuration files. Learn more.
Step 4. Enable and configure the microsoft module
From the C:\Program Files\Filebeat folder, run:
Modify the settings in the modules.d/microsoft.yml file. You must enable at least one fileset.
filebeat.exe modules enable microsoftStep 5. Start Filebeat
The setup command loads the Kibana dashboards. If the dashboards are already set up, omit this command.
.\filebeat.exe setup
Start-Service filebeat
Step 6. Module status
We will check that data is received from the Filebeat microsoft module
Modules
These are the modules that will be ingested after integrating Microsoft Defender ATP Logs
microsoft.defender_atp : Module for ingesting Microsoft Defender ATP.
microsoft.defender_atp.lastUpdateTime:  The date and time (in UTC) the alert was last updated. (type: date)
microsoft.defender_atp.resolvedTime: The date and time in which the status of the alert was changed to 'Resolved'. (type: date)
microsoft.defender_atp.incidentId: The Incident ID of the Alert. (type: keyword)
microsoft.defender_atp.investigationId: The Investigation ID related to the Alert. (type: keyword)
microsoft.defender_atp.investigationState: The current state of the Investigation. (type: keyword)
microsoft.defender_atp.assignedTo: Owner of the alert. (type: keyword)
microsoft.defender_atp.status: Specifies the current status of the alert. Possible values are: 'Unknown', 'New', 'InProgress' and 'Resolved'. (type: keyword)
microsoft.defender_atp.classification: Specification of the alert. Possible values are: 'Unknown', 'FalsePositive', 'TruePositive'. (type: keyword)
microsoft.defender_atp.determination: Specifies the determination of the alert. Possible values are: 'NotAvailable', 'Apt', 'Malware', 'SecurityPersonnel', 'SecurityTesting', 'UnwantedSoftware', 'Other'. (type: keyword)
microsoft.defender_atp.threatFamilyName: Threat family. (type: keyword)
microsoft.defender_atp.rbacGroupName: User group related to the alert (type: keyword)
microsoft.defender_atp.evidence.domainName: Domain name related to the alert (type: keyword)
That's everything needed on your end. Once the Filebeat service is running, logs will automatically begin forwarding to our Elastic instance in real time — no ongoing maintenance is required on your side. If the service ever stops for any reason (e.g. after a Windows update or restart), it will resume automatically as it is installed as a Windows service. If you run into any issues during setup, just reach out and we'll walk you through it.
NG SIEM - Microsoft Defender for Cloud
Overview
The Microsoft Defender for Cloud(external, opens in a new tab or window) integration allows you to monitor security alert events and assessments. When integrated with Elastic Security, this valuable data can be leveraged within Elastic for analyzing the resources and services that users are protecting through Microsoft Defender.
Use the Microsoft Defender for Cloud integration to collect and parse data from Azure Event Hub, Azure REST API, and then visualize that data in Kibana.
Compatibility
The Microsoft Defender for Cloud integration uses the Azure REST API. It uses the 2021-06-01 API version for retrieving assessments and the 2019-01-01-preview API version for retrieving sub-assessments.
How it works
For the assessment data stream, the /assessments endpoint retrieves all available assessments for the provided scope, which can be a Subscription ID or a Management Group Name. For each assessment, if sub-assessments are available, we will make another call to collect them. We will aggregate the results from both calls and publish them.
What data does this integration collect?
This integration collects log messages of the following types:
Event: allows users to preserve a record of security events that occurred on the subscription, which includes real-time events that affect the security of the user's environment. For further information connected to security alerts and type, refer to the security alerts reference guide(external, opens in a new tab or window).Assessment: collect security assessments on all your scanned resources inside a scope from the Assessments(external, opens in a new tab or window) and Sub Assessments(external, opens in a new tab or window) endpoints.
Requirements
Collect logs from Azure Event Hub
- Azure Event Hub - Elastic recommends using one Azure Event Hub for each integration. Visit Create an Azure Event Hub to learn more. Use Azure Event Hub names up to 30 characters long to avoid compatibility issues.
- Consumer Group - We recommend using a dedicated consumer group for the Azure Event Hub input. Reusing consumer groups among non-related consumers can cause unexpected behavior and possibly lost events.
- Connection String - The connection string required to communicate with Azure Event Hubs. See Get an Azure Event Hubs connection string to learn more.
- Storage Account - The name of the storage account where the consumer group's state/offsets will be stored and updated.
- Storage Account Key - The storage account key will be used to authorise access to data in your storage account.
Collect Microsoft Defender Cloud logs via API
- Client ID - The client ID related to creating a new application on Azure.
- Client Secret - The secret related to the client ID.
- Tenant ID - The tenant ID related to creating a new application on Azure.
- Management Group Name - The name of the management group. Provide either
Subscription IDorManagement Group Nameas the scope for the request. If both are provided, thenManagement Group Namewill take precedence. - Subscription ID - The unique identifier for the subscription. Provide either
Subscription IDorManagement Group Nameas the scope for the request. If both are provided, thenManagement Group Namewill take precedence.
Conclusion
Integrating Microsoft Defender for Cloud with Elastic Security provides a powerful way to centralize and analyze your cloud security posture. By leveraging Azure Event Hub for real-time security event streaming and the Azure REST API for assessment data, you gain comprehensive visibility into the threats and vulnerabilities affecting your Azure resources — all within Kibana.
With the Event data stream capturing live security alerts and the Assessment data stream continuously evaluating your scanned resources at both the assessment and sub-assessment level, your team can detect, investigate, and respond to risks more efficiently.
To get the most out of this integration, ensure your Azure environment is properly configured with dedicated Event Hub instances, isolated consumer groups, and the appropriate API credentials (Client ID, Client Secret, and Tenant ID). Choosing the right scope — whether a Subscription ID or Management Group Name — will also determine the breadth of coverage across your organization's Azure resources.
Once set up, this integration serves as a foundational component of a broader cloud security monitoring strategy, enabling your security operations team to act on meaningful, contextualized data rather than navigating siloed tools.
AQUILA - Microsoft Defender for Endpoint
Overview
This guide walks through the full process of integrating Microsoft Defender for Endpoint (MDE) to centralize security telemetry, enrich alerts, and enable unified threat hunting across your environment.
This integration is for Microsoft Defender for Endpoint logs.
Microsoft Defender for Endpoint integration collects data for Alert, Machine, Machine Action, and Vulnerability logs using REST API.
This integration collects the following logs:
- Alert - Retrieves alerts generated by Microsoft Defender for Endpoint.
- Machine - Retrieves machines that have communicated with Microsoft Defender for Endpoint.
- Machine Action - Retrieves logs of actions carried out on machines.
- Vulnerability - Retrieves logs of Vulnerability.
Prerequisites
Before you begin, ensure the following are in place:
-
An active Microsoft Defender for Endpoint license (Plan 1 or Plan 2, or Microsoft 365 Defender)
-
Access to the Microsoft Entra ID (formerly Azure AD) portal to register an application
-
Permissions to grant API permissions within your tenant (typically a Global Administrator or Security Administrator role)
Azure App Registration
This integration authenticates to the MDE API using OAuth 2.0 client credentials. You need to register an application in Microsoft Entra ID and grant it the appropriate API permissions.
Step 1: Register a New Application
Step 2: Create a Client Secret
-
In your newly created app registration, navigate to Certificates & secrets > Client secrets > New client secret.
-
Add a description and choose an expiry period appropriate for your organization.
-
Click Add, then immediately copy the secret Value. This is the only time it is shown in full.
Step 3:
-
In the app registration, go to API permissions > Add a permission.
-
Select APIs my organization uses, then search for and select WindowsDefenderATP.
-
Choose Application permissions and grant the following minimum required scopes:
|
Permission |
Purpose |
|---|---|
|
Alert.Read.All |
Read all MDE alerts and incidents |
|
Machine.Read.All |
Read device inventory and health state |
|
Vulnerability.Read.All |
Read vulnerability and software inventory |
|
AdvancedQuery.Read.All |
Execute advanced hunting queries (optional) |
Step 4:
-
Click Add permissions, then click Grant admin consent for [Your Tenant]. Confirm when prompted.
-
Verify the Status column shows Granted for [tenant] for all added permissions.
Please saved and provide this values:
- Directory (tenant) ID
- Application (client) ID
-
Client Secret Value
If you need further assistance, kindly contact our support at support@cytechint.com for prompt assistance and guidance.
NG SIEM - Microsoft Defender XDR
Overview
This guide covers the full integration of Microsoft Defender XDR with the Elastic Stack. Microsoft Defender XDR is a unified extended detection and response platform that correlates signals across endpoints, identities, email, cloud apps, and cloud workloads. Bringing its data into Elastic enables centralized threat hunting, cross-platform correlation, and unified SIEM workflows alongside your other log sources.
Prerequisites
Microsoft Requirements
-
An active Microsoft 365 Defender or Microsoft Defender XDR license
-
Access to Microsoft Entra ID (Azure AD) to register an application
-
Global Administrator or Security Administrator role to grant API permissions and admin consent
-
(Optional) Microsoft Defender XDR Streaming API requires a Microsoft 365 E5 or equivalent license for real-time event streaming
Azure App Registration
The Elastic Agent authenticates to the Microsoft Graph Security API using OAuth 2.0 client credentials. If you do not already have an app registration, follow the steps below.
Step 1: Register the Application
-
Go to portal.azure.com and navigate to Microsoft Entra ID > App registrations > New registration.
-
Name the app (e.g., elastic-xdr-integration) and select Single tenant under Supported account types.
-
Leave the Redirect URI blank and click Register.
-
On the overview page, copy and save the Application (client) ID and Directory (tenant) ID.
Step 2: Create a Client Secret
-
Go to Certificates & secrets > Client secrets > New client secret.
-
Add a description and set an appropriate expiry period.
-
Click Add and immediately copy the secret Value — it is only shown once.
Important Secret Visibility: Azure only displays the secret value immediately after creation. If the page is refreshed or the value was not saved, you will need to generate a new secret. If you regenerate, remember to update the secret in all Elastic integrations that reference this app registration to avoid breaking existing data pipelines.
Step 3: Grant API Permissions
-
Go to API permissions > Add a permission > Microsoft Graph.
-
Select Application permissions and add the following:
- Click Add permissions.
- If also integrating Microsoft Defender for Endpoint data, additionally add WindowsDefenderATP > Application permissions: Alert.Read.All and Machine.Read.All.
- Click Grant admin consent for [Your Tenant] and confirm. Verify all permissions show Granted status.
Elastic Fleet Configuration
With the Azure application registered, the next step is to configure Elastic Fleet to deploy the MDE integration.
- Collect alerts and incidents using Microsoft Graph Security API
- Client ID
- Client Secret
- Tenant ID
- Collect events using Azure Event Hub
- Event Hub
- Consumer Group
- Connection String
- Storage Account
- Storage Account Key
- Collect vulnerabilities using Microsoft Defender for Endpoint API
- Client ID
- Client Secret
- Tenant ID
- Oauth2 Token URL
Conclusion
Integrating Microsoft Defender XDR with Elastic unlocks a truly unified security operations experience, bringing together telemetry from endpoints, identities, email, cloud apps, and cloud workloads into a single platform for detection, investigation, and response. By connecting the Microsoft Graph Security API to Elastic's SIEM and search capabilities, security teams gain correlated, cross-workload visibility that goes far beyond what any single Defender product can offer on its own. Whether you're leveraging prebuilt detection rules, building custom threat hunting queries, or streaming real-time events via the XDR Streaming API, this integration gives your SOC the context and speed needed to tackle modern multi-stage attacks — all from one place.
NG SIEM Microsoft Entra ID
Overview
This guide walks you through connecting Microsoft Entra ID to Elastic so that your identity logs flow automatically into Elasticsearch. Once set up, you'll be able to search, visualize, and alert on Sign-in logs, Audit logs, and Identity Protection logs directly in Kibana.
The integration uses Azure Event Hub as the bridge — Entra ID pushes logs into Event Hub, and the Elastic Agent reads from it in real time. A Storage Account is used behind the scenes to checkpoint progress, so Elastic always picks up exactly where it left off.
Prerequisite
Before you begin, ensure the following are in place:
- Active Azure subscription with a Microsoft Entra ID tenant
- An Elastic deployment (Cloud or self-managed 8.x) with Kibana accessible
- Microsoft Entra ID Free or P1 license for Sign-in and Audit logs
- Microsoft Entra ID P2 license if you want Identity Protection logs (UserRiskEvents, RiskyUsers)
- Azure permissions to create Event Hubs and Storage Accounts
Part 1 — Set Up Azure Resources
In this part you will create the Event Hub and Storage Account in Azure. These are the two Azure-side components that Elastic connects to.
Step 1.1 Create an Event Hub Namespace and Hub
The Event Hub is the channel that Entra ID will push logs into.
-
In the Azure Portal (portal.azure.com), search for Event Hubs in the top search bar and click Create.
-
Choose your Subscription and Resource Group (or create a new one).
-
Set a Namespace Name — for example: entra-elastic-hub. This is the parent container.
-
Choose a Region close to your Elastic deployment and set Pricing tier to Standard or above.
-
Click Review + Create, then Create. Wait for the deployment to complete.
-
Once deployed, open the namespace and click + Event Hub in the top toolbar.
-
Name the hub — for example: entra-logs — and click Create.
Step 1.2 Create a Consumer Group
A consumer group is a named reader slot on the Event Hub. Elastic needs its own so it does not conflict with any other tools reading from the same hub.
-
Inside your Event Hub (entra-logs), click Consumer Groups in the left sidebar.
-
Click + Consumer Group.
-
Name it elastic-consumer and click Save.
-
Write this name down — you will paste it into Elastic in Part 3.
Step 1.3 Copy the Connection String
The connection string is how Elastic authenticates to your Event Hub Namespace.
Step 1.4 Create a Storage Account
Elastic uses a Storage Account to checkpoint which events it has already read. This prevents duplicate ingestion if the agent restarts.
-
In the Azure Portal, search for Storage Accounts and click Create.
-
Choose the same Subscription and Resource Group as your Event Hub.
-
Enter a Storage Account Name — for example: entraelascheckpoint. Names must be lowercase, 3–24 characters, no hyphens.
-
Choose the same Region as your Event Hub and leave all other defaults.
-
Click Review + Create, then Create.
-
Once deployed, open the storage account and click Access Keys in the left sidebar.
-
Click Show next to key1 and copy both the Storage account name and the Key value.
Keep your Storage Account Key secure. Anyone with this key has full access to the storage account. You can rotate it later from the Access Keys page without breaking the integration — just update the key in Elastic too.
Part 2 — Configure Entra ID Diagnostic Settings
Now you will tell Entra ID which log categories to send and point them at the Event Hub you just created.
-
In the Azure Portal, go to Microsoft Entra ID from the left sidebar or top search.
-
Under Monitoring in the left sidebar, click Diagnostic settings.
-
Click + Add diagnostic setting at the top.
-
Give it a descriptive name such as: Stream to Elastic via Event Hub.
-
Under Logs, check the categories you want to stream:
|
SignInLogs |
Free |
All interactive user sign-ins, MFA results, Conditional Access outcomes |
|
AuditLogs |
Free |
Directory changes — user creation, group changes, role assignments |
|
NonInteractiveUserSignInLogs |
Free |
Service and application sign-ins without user interaction |
|
UserRiskEvents |
P2 only |
Identity Protection risky sign-in detections |
|
RiskyUsers |
P2 only |
Users flagged as at-risk by Identity Protection |
-
Under Destination details, check Stream to an event hub.
-
Set Event Hub Namespace to your namespace (entra-elastic-hub).
-
Set Event Hub name to your hub (entra-logs).
-
Leave Event Hub policy name as the default (RootManageSharedAccessKey).
-
Click Save at the top of the page.
Changes to Diagnostic Settings take effect immediately, but it can take 5–15 minutes before the first events begin appearing in the Event Hub — and then another minute or two before Elastic picks them up. This is normal.
Elastic Fleet Configuration
With Azure fully configured, the final step is to install the Microsoft Entra ID integration in Kibana and enter the four connection details you collected.
To enable log collection from the Microsoft Entra ID, provide the following information to CyTech Support:
- Consumer Group
- Connection String
- Storage Account
- Storage Account Key
Conclusion
With the integration configured, Microsoft Entra ID logs are now streaming continuously into Elasticsearch via Azure Event Hub. Sign-in, Audit, and Identity Protection events will be indexed automatically and available for search, visualization, and alerting in Kibana.
To maintain the integration, ensure the Elastic Agent remains healthy in Fleet and rotate the Storage Account Key and Event Hub connection string in both Azure and the Elastic integration settings as part of your regular credential rotation cycle.
NG SIEM - Microsoft Entra ID Entity Analytics
Overview
This guide provides step-by-step instructions for integrating Microsoft Entra ID (formerly Azure Active Directory) Entity Analytics with the Elastic Security platform. By completing this integration, your security team will be able to ingest identity-based risk signals from Entra ID directly into Elastic, enabling enriched detection, investigation, and response workflows.
Entity Analytics in Elastic Security correlates user and host risk scores derived from your identity provider with security events, helping analysts prioritize high-risk entities and reduce alert fatigue.
Prerequisite
Before beginning the integration, ensure the following requirements are met:
Microsoft Entra ID Requirements
-
An active Microsoft Azure subscription with Entra ID (Azure AD) configured
-
Global Administrator or Privileged Role Administrator permissions in Entra ID
-
Microsoft Graph API access enabled for your tenant
-
Entra ID Identity Protection license (P2) for risk signal data
Azure App Registration
Elastic connects to Entra ID via the Microsoft Graph API using an Azure App Registration with appropriate permissions. Follow these steps to configure the application.
Register a New Application
-
Sign in to the Azure Portal at portal.azure.com with administrative credentials.
-
Navigate to Microsoft Entra ID > App registrations.
-
Click New registration.
-
Provide the following details:
|
Field |
Value |
|---|---|
|
Name |
Elastic-EntraID-EntityAnalytics |
|
Supported account types |
Accounts in this organizational directory only (Single tenant) |
|
Redirect URI |
Leave blank (not required for this integration) |
-
Click Register.
Note down the Application (client) ID and Directory (tenant) ID — these will be needed when configuring the Elastic integration.
Create a Client Secret
-
-
In your new App Registration, navigate to Certificates & secrets > Client secrets.
-
Click New client secret.
-
Set a description (e.g., "Elastic Entity Analytics") and choose an expiry period.
-
Click Add, then immediately copy the Value. This is shown only once.
-
Grant API Permissions
The application requires the following Microsoft Graph API permissions:
|
User.Read.All |
Application |
Read all user profiles |
|
IdentityRiskEvent.Read.All |
Application |
Read identity risk events |
|
IdentityRiskyUser.Read.All |
Application |
Read risky user data |
|
AuditLog.Read.All |
Application |
Read audit log data |
|
Directory.Read.All |
Application |
Read directory data |
-
In the App Registration, go to API permissions > Add a permission.
- Select Microsoft Graph > Application permissions.
-
Search for and add each permission listed in the table above.
- Click Grant admin consent for [Your Organization] and confirm.
Note: Admin consent must be granted by a Global Administrator. If you do not have this role, coordinate with your Azure administrator
Elastic Fleet Configuration
With the Azure application registered, the next step is to configure Elastic Fleet to deploy the Microsoft Entra ID Entity Analytics integration.
To enable log collection from the Microsoft Entra ID, provide the following information to CyTech Support:
|
Tenant ID |
Directory (Tenant) ID from App Registration |
|
Client ID |
Application (Client) ID from App Registration |
|
Client Secret |
Secret value created in Section 3.2 |
|
Dataset |
azure.entityanalytics (auto-populated) |
|
Sync Interval |
Recommended: every 30 minutes (default) |
|
Enable User Sync |
Toggle ON |
|
Enable Risk Sync |
Toggle ON (requires P2 license) |
Conclusion
Integrating Microsoft Entra ID Entity Analytics with Elastic Security gives your team a significant advantage in identifying and responding to identity-based threats. By pulling user risk signals directly from Entra ID into Elastic, you gain a unified view of your security posture without having to switch between platforms.
Once the Elastic Agent is configured with the App Registration credentials, it handles everything automatically — authenticating to Microsoft Graph API, syncing user and risk data on your set interval, and feeding that data into Elastic's Entity Analytics engine. From there, detection rules can alert your team on risky sign-ins, elevated risk levels, and behavioral anomalies in real time.
For Elastic Cloud deployments specifically, the integration works out of the box with no additional network configuration needed. The main things to keep on top of after go-live are tuning your detection rules to fit your environment and rotating the Azure App Registration client secret before it expires to avoid any interruption in data collection.
NG SIEM Microsoft Exchange Online Message Trace
Overview
Microsoft Exchange Online Message Trace is a powerful diagnostic and security feature within Microsoft 365 that tracks the flow of email messages through your Exchange Online organization. Integrating Message Trace data into Elastic provides security operations teams with centralized visibility into email traffic, anomaly detection, and compliance monitoring.
This guide covers the end-to-end process of collecting, ingesting, parsing, and analyzing Exchange Online Message Trace data within the Elastic Stack, including configuration of the Microsoft 365 integration via Elastic Agent, index templates, field mappings, dashboards, and alerting
Prerequisite
Before configuring the integration, ensure the following prerequisites are met:
Microsoft 365 Requirements
-
An active Microsoft 365 or Office 365 subscription (Business Premium, E3, or E5 recommended)
-
An Azure Active Directory (Azure AD) tenant with Global Administrator or Security Administrator privileges
-
An Azure AD App Registration with appropriate API permissions
-
Exchange Online Plan 1 or Plan 2 license for the service account used
Azure App Registration
The Microsoft 365 integration authenticates using OAuth2 client credentials. You must create an App Registration in Azure AD and grant it the correct API permissions.
Creating the App Registration
-
Sign in to the Azure portal at portal.azure.com with Global Administrator credentials.
-
Navigate to Azure Active Directory > App registrations > New registration.
-
Provide a descriptive name such as Elastic-M365-MessageTrace.
-
Set the Supported account type to Accounts in this organizational directory only (Single tenant).
-
Leave the Redirect URI blank and click Register.
-
Note the Application (client) ID and Directory (tenant) ID from the Overview page.
Configuring API Permissions
|
API |
Permission |
Type |
|---|---|---|
|
Office 365 Management APIs |
ActivityFeed.Read |
Application |
|
Office 365 Management APIs |
ActivityFeed.ReadDlp |
Application |
|
Microsoft Graph |
Reports.Read.All |
Application |
After adding permissions, click Grant admin consent for [your tenant] to activate them. The status column should show a green checkmark.
Creating a Client Secret
Elastic Fleet Configuration
With the Azure application registered, the next step is to configure Elastic Fleet to deploy the Microsoft Exchange Online Message Trace integration.
Collect Microsoft Exchange Online Message Trace logs from Graph API
To enable log collection from the Microsoft Entra ID, provide the following information to CyTech Support:
- Collect Microsoft Exchange Online Message Trace logs from Graph API
- Tenant ID
- Client ID
- Client Secret
- Collect Microsoft Exchange Online Message Trace logs via file
- Local Domains
- Paths
Conclusion
Integrating Microsoft Exchange Online Message Trace into Elastic is straightforward when using the Graph API collection method. The client is only required to complete the Azure AD App Registration, grant the necessary API permissions, and securely share three credentials — Tenant ID, Client ID, and Client Secret — with the Elastic team.
Once those credentials are entered into the Microsoft 365 integration in Kibana, Elastic Cloud handles the rest. Data will begin flowing into the platform within 5 to 30 minutes, and the built-in dashboards provide immediate visibility into email traffic, delivery status, and suspicious activity.
No backend configuration, file paths, or command-line access is required for this setup. The alternative file-based collection method available in the Elastic UI is not applicable here, as logs are pulled directly from Microsoft's Graph API.
The only ongoing maintenance required is coordinating with the client to renew the Client Secret before it expires, typically every 24 months.
NG SIEM - Microsoft Exchange Server
Overview
The Microsoft Exchange Server integration for Elastic enables you to monitor Exchange Server installations by collecting and indexing server log data into Elasticsearch. With Kibana, you can visualize, search, and alert on Exchange activity in real time.
This integration is part of the Elastic integrations library and is deployed via Elastic Agent. It is designed for on-premises Exchange Server environments (versions 2013, 2016, and 2019) and supports the following log streams:
-
Exchange HTTPProxy Logs
-
Exchange IMAP4 / POP3 Logs
-
Exchange Message Tracking Logs
-
Exchange SMTP Logs (Send/Receive)
Prerequisite
Before setting up the integration, ensure the following components are in place:
- Exchange Server Requirements
-
Microsoft Exchange Server 2013, 2016, or 2019
-
Local or remote access to Exchange log directories
-
Administrative privileges to enable SMTP protocol logging (if required)
-
Windows Server 2012 R2 or later
-
Permissions
The Elastic Agent service account (or the user running Filebeat) must have read access to the Exchange log directories. Default log paths require local administrator or at minimum read access to:
- C:\Program Files\Microsoft\Exchange Server\V15\Logging\
- C:\Program Files\Microsoft\Exchange Server\V15\TransportRoles\Logs\
Log Streams and File Paths
The integration collects the following log streams. Below are the default file paths for Exchange Server V15 (2013/2016/2019):
Enabling SMTP Protocol Logging
SMTP Send and Receive logs are not enabled by default on Exchange Server. Follow these steps to enable them using the Exchange Management Shell (EMS).
Enable SMTP Send Logging (Hub Transport)
- Open the Exchange Management Shell as Administrator.
- Run the following command to enable protocol logging for the Hub Send connector:
Set-TransportService -Identity <ServerName> -SendProtocolLogPath "C:\Program Files\Microsoft\Exchange Server\V15\TransportRoles\Logs\Hub\ProtocolLog\SmtpSend" -SendProtocolLogMaxAge 30.00:00:00 -SendProtocolLogMaxDirectorySize 250MB
- Enable protocol logging on the Send connector:
- Set-SendConnector -Identity "<ConnectorName>" -ProtocolLoggingLevel Verbose
- Enable SMTP Receive Logging (Frontend Transport)
- Run the following command to enable logging on the Frontend Receive connector:
- Set-ReceiveConnector -Identity "<ServerName>\<ConnectorName>" -ProtocolLoggingLevel Verbose
- Verify that the log path is configured:
- Get-TransportService <ServerName> | Select ReceiveProtocolLogPath
Verify SMTP Logging is Active
After enabling, you can verify log files are being written to the configured path. Wait a few minutes for mail flow to generate entries, then check the directory for new .LOG files.
Enable SMTP Receive Logging (Frontend Transport)
- Run the following command to enable logging on the Frontend Receive connector:
- Set-ReceiveConnector -Identity "<ServerName>\<ConnectorName>" -ProtocolLoggingLevel Verbose
-
Verify that the log path is configured:
- Get-TransportService <ServerName> | Select ReceiveProtocolLogPath
Verify SMTP Logging is Active
After enabling, you can verify log files are being written to the configured path. Wait a few minutes for mail flow to generate entries, then check the directory for new .LOG files.
|
Log Stream |
Default File Path |
Notes |
|
HTTPProxy |
...\Logging\HttpProxy\{ECP,OWA,EWS,RPC}\*.LOG |
Enabled by default |
|
IMAP4 |
...\Logging\Imap4\*.LOG |
Enabled by default |
|
POP3 |
...\Logging\Pop3\*.LOG |
Enabled by default |
|
Message Tracking |
...\TransportRoles\Logs\MessageTracking\*.LOG |
Enabled by default |
|
SMTP Send |
...\TransportRoles\Logs\Hub\ProtocolLog\SmtpSend\*.LOG |
Must be enabled manually |
|
SMTP Receive |
...\TransportRoles\Logs\FrontEnd\ProtocolLog\SmtpReceive\*.LOG |
Must be enabled manually |
Elastic Fleet Configuration
With the Azure application registered, the next step is to configure Elastic Fleet to deploy the Microsoft Exchange Server integration.
To enable log collection from the Microsoft Entra ID, provide the following information to CyTech Support:
Collect Microsoft Exchange Server Logs from file
- Exchange HTTPProxy Logs
- Paths: eg: C:\Program Files\Microsoft\Exchange Server\V15\Logging\HttpProxy\*\*.LOG
- Collect Exchange Server IMAP4 POP3 logs
- Paths: C:\Program Files\Microsoft\Exchange Server\V15\Logging\Imap4\IMAP*.LOG
- Paths: C:\Program Files\Microsoft\Exchange Server\V15\Logging\Pop3\POP*.LOG
- Collect Exchange Messagetracking logs
- Paths: C:\Program Files\Microsoft\Exchange Server\V15\TransportRoles\Logs\MessageTracking\*.LOG
- Collect Exchange SMTP logs
- Paths: C:\Program Files\Microsoft\Exchange Server\V15\TransportRoles\Logs\Hub\ProtocolLog\SmtpSend\*.LOG
- Paths: C:\Program Files\Microsoft\ExchangeServer\V15\TransportRoles\Logs\FrontEnd\ProtocolLog\SmtpReceive\*.LOG
Conclusion
The Microsoft Exchange Server integration for Elastic is a practical and well-structured solution for organizations that need visibility into their on-premises email infrastructure. By leveraging Elastic Agent to collect and index Exchange log data — covering HTTPProxy, IMAP4/POP3, Message Tracking, and SMTP streams — teams gain centralized observability without having to build custom pipelines from scratch.
The integration's strength lies in its alignment with the Elastic Common Schema (ECS), which makes Exchange logs immediately searchable and compatible with Kibana's pre-built dashboards and alerting tools. This significantly reduces the time-to-value for security and operations teams who need to monitor mail flow, detect anomalies, or audit user activity.
That said, it does require some upfront effort — particularly around enabling SMTP protocol logging manually on the Exchange side and ensuring Elastic Agent has proper file system access. Organizations running non-standard Exchange installations will also need to adjust default file paths accordingly.
Overall, it's a solid community-supported integration that fits well into broader SIEM or observability strategies built on the Elastic Stack. For teams already invested in Elastic, adding Exchange Server monitoring is a natural and low-friction extension of their existing setup.
NG SIEM Microsoft Graph Activity Logs
Overview
Microsoft Graph Activity Logs capture API-level interactions with Microsoft Graph — including the identity of the caller, the resources accessed, permissions used, and the outcome. Forwarding these logs to Elastic gives security and operations teams a centralized platform for detection, alerting, and long-term retention.
Prerequisite
Azure Requirements
-
An active Microsoft Azure subscription
-
Microsoft Entra ID (Azure AD) tenant with at least one application registered
-
Global Administrator or Security Administrator role to configure diagnostic settings
-
Azure Event Hub namespace and Event Hub instance (Standard tier recommended)
-
A dedicated Azure AD application for Elastic with appropriate API permissions
Required Azure AD Permissions
|
Parameter |
Description |
|---|---|
|
AuditLog.Read.All |
Read all audit log data from Microsoft Graph |
|
Directory.Read.All |
Read directory data associated with activity records |
|
User.Read.All |
Resolve user display names and UPNs in enrichment |
|
Policy.Read.All |
Read conditional access and authorization policies |
Azure App Registration
Register an Azure AD Application
-
In the Azure Portal, navigate to Microsoft Entra ID > App registrations > New registration.
-
Set the name (e.g., elastic-graph-logs-reader) and choose "Accounts in this organizational directory only".
-
Click Register. Note the Application (client) ID and Directory (tenant) ID.
-
Under Certificates & secrets, create a new client secret. Copy the secret value immediately.
-
Under API permissions, add the permissions listed in Section 3.3 above, then grant admin consent.
Create an Azure Event Hub
-
In the Azure Portal, navigate to Event Hubs > Create.
-
Create a namespace (Standard tier) in your preferred region.
-
Inside the namespace, create an Event Hub named insights-logs-microsoftgraphactivitylogs.
-
Under Shared access policies, create a new policy with Listen permission for Elastic.
-
Note the connection string — you will need this in Elastic Fleet.
Configure Diagnostic Settings in Entra ID
-
In the Azure Portal, go to Microsoft Entra ID > Diagnostic settings > Add diagnostic setting.
-
Name the setting (e.g., elastic-graph-activity-stream).
-
Under Logs, check MicrosoftGraphActivityLogs.
-
Under Destination, select Stream to an event hub and choose the namespace and Event Hub created above.
-
Click Save. Logs will begin flowing within 5–15 minutes.
Note: The MicrosoftGraphActivityLogs category may appear as a preview feature. Ensure the feature is enabled for your tenant under Entra ID > User settings > Manage what information is shown.
Elastic Fleet Configuration
With the Azure application registered, the next step is to configure Elastic Fleet to deploy the Microsoft Graph Activity Logs integration.
To enable log collection from the Microsoft Entra ID, provide the following information to CyTech Support:
- Event Hub Name
- Consumer Group
- Connection String
- Storage Account
- Storage Account Key
Conclusion
Integrating Microsoft Graph Activity Logs into Elastic gives your security and operations teams a powerful, centralized view of every API interaction occurring across your Microsoft 365 and Entra ID environment. What was previously a siloed audit stream within Azure becomes a first-class signal in your Elastic security ecosystem — queryable, correlatable, and actionable alongside all your other data sources.
By following this guide, you have established a reliable log pipeline from Microsoft Entra ID through Azure Event Hub into Elasticsearch, mapped raw Graph API telemetry to ECS fields for out-of-the-box detection compatibility, and laid the groundwork for long-term retention, compliance reporting, and threat hunting in Kibana.
As Microsoft continues to expand the Graph Activity Logs preview with richer metadata, this pipeline will grow in value without requiring significant re-architecture. The Event Hub ingest pattern is inherently scalable, and Elastic's data stream model ensures index management stays efficient as log volume increases.
Security visibility is only as strong as the signals feeding it. Microsoft Graph Activity Logs are one of the highest-fidelity sources of identity and access telemetry available in the modern enterprise — and with Elastic, you now have the tools to make the most of them.
NG SIEM - CISCO DUO
Overview
This guide provides step-by-step instructions for integrating Cisco DUO multi-factor authentication (MFA) with Elastic Fleet for centralized log collection and security monitoring.
Cisco DUO is a cloud-based access security platform that provides multi-factor authentication, device health checks, and zero-trust access policies. Elastic Fleet, part of the Elastic Stack (ELK), provides a centralized management interface for deploying and managing Elastic Agents across your infrastructure.
By integrating DUO authentication logs into Elastic Fleet, security teams gain:
-
Real-time visibility into authentication events across all users and devices
-
Centralized log aggregation from DUO's Admin API into Elasticsearch
-
Pre-built dashboards for authentication analytics and anomaly detection
-
Correlation of DUO events with other security telemetry in the Elastic SIEM
Prerequisite
Before beginning the integration, ensure all of the following prerequisites are met. Incomplete prerequisites are the most common cause of integration failures.
Cisco DUO Requirements
- Verify Admin API credentials:
- Hostname: exactly the Duo Admin API host (e.g., api-XXXXXXXX.duosecurity.com) as shown in Duo Admin Panel > Applications > Protect an Application > Admin API.
- Integration key and Secret key: copy/paste fresh to rule out typos.
- Ensure the Admin API application has the required permissions:
- “Grant read information” and “Grant read log” must be enabled for activity logs.
- Duo IP allowlist:
- If you have IP whitelisting in Duo, add this egress IP - 50.250.130.122(es-ui.cytechint.io)
To enable log collection from the Cisco DUO, provide the following information to CyTech Support:
- API Hostname (e.g., api-XXXXXXXX.duosecurity.com)
- Integration Key (ikey)
- Secret Key (skey)
Conclusion
The Cisco DUO integration with Elastic Fleet enables centralized visibility into authentication events across your environment. By leveraging DUO's Admin API alongside Elastic's log collection and SIEM capabilities, security teams can monitor, analyze, and respond to authentication activity in real time — all from a single platform.